
Bridging the Cost Gap: A Comprehensive Analysis of CAPEX and
OPEX for Smart Home Transition from a Provider’s Perspective
Nilton F. S. Seixas, Adriano H. O. Maia
a
, George P. Pinto
b
, Dhyego Tavares M. da Cruz
c
,
Bruno P. Santos
d
, Ivan do C. Machado
e
, Eduardo S. Almeida
f
, Frederico A. Durao
g
,
Maycon L. M. Peixoto
h
, Gustavo B. Figueiredo
i
and Cassio V. S. Prazeres
j
Institute of Computing, Computer Science Department, Federal University of Bahia (UFBA), Salvador, Bahia, Brazil
Keywords:
IoT, Smart Homes, Smart Grids, CAPEX, OPEX.
Abstract:
The urgency of addressing global warming has driven global efforts to enhance energy efficiency and transform
energy acquisition methods. In this context, the adoption of smart technologies has gained relevance across
various domains, including smart cities and smart homes. While smart cities are often promoted through gov-
ernment initiatives, transforming conventional homes into smart homes largely depends on consumer adoption.
However, there is a significant gap in the literature regarding the implementation costs and benefits of this tran-
sition, with many studies focused on unrealistic scenarios tailored to the average American consumer profile.
This study aims to fill that gap by proposing a methodology to estimate the conversion of conventional homes
into smart homes, accounting for both capital expenditures (CAPEX) and operational expenditures (OPEX).
The proposed approach seeks to enable an affordable transition for a wider range of consumer profiles. Four
case studies are presented to demonstrate how smart systems can be integrated into homes, maximizing eco-
nomic and environmental benefits for end-users. Additionally, the paper analyzes the commercial relationship
between manufacturers and smart environment providers, exploring acquisition and operational cost mod-
els. As an alternative to the traditional device-based business model, the study suggests a subscription-based
system, supported by the continuous delivery of smart solutions, promoting greater customer retention and
scalability.
1 INTRODUCTION
The emergence of smart environments has ushered in
an era where billions of devices are seamlessly con-
nected to the Internet. The current count surpasses
16 billion devices (Sinha, 2023), exceeding twice the
global population of approximately 8 billion. Inte-
grating home and street devices with 5G networks
has facilitated a profound transformation across var-
a
https://orcid.org/0009-0007-1739-4295
b
https://orcid.org/0000-0002-6082-9211
c
https://orcid.org/0009-0005-1061-9733
d
https://orcid.org/0000-0003-4501-2323
e
https://orcid.org/0000-0001-9027-2293
f
https://orcid.org/0000-0002-9312-6715
g
https://orcid.org/0000-0002-7766-6666
h
https://orcid.org/0000-0002-4851-5228
i
https://orcid.org/0000-0001-9756-378X
j
https://orcid.org/0000-0003-0197-0909
ious sectors, including the economy, health, agricul-
ture, and education. This transformative landscape
has given rise to the Internet of Things (IoT) field,
providing a platform to comprehensively study and
understand the intricate phenomena associated with
this interconnected web of devices.
The IoT establishes a paradigm connecting
dayling physical objects to the Internet, enabling
seamless communication. Coined by Kevin Ash-
ton (Ashton, 2009), the term ‘Internet of Things’ envi-
sions a world where these interconnected ‘things’ can
communicate, collect data, and make informed deci-
sions. The IoT provides advantages like improved re-
source utilization, increased productivity, and an en-
hanced quality of life for human communities. Mean-
while, smart environments are characterized “as one
that can acquire and apply knowledge about the en-
vironment and its inhabitants to improve their experi-
ence in that environment” (Cook and Das, 2007). In
this sense, the IoT stands as a fundamental enabler
Seixas, N. F. S., Maia, A. H. O., Pinto, G. P., M. da Cruz, D. T., Santos, B. P., Machado, I. C., Almeida, E. S., Durao, F. A., Peixoto, M. L. M., Figueiredo, G. B. and Prazeres, C. V. S.
Bridging the Cost Gap: A Comprehensive Analysis of CAPEX and OPEX for Smart Home Transition from a Provider’s Perspective.
DOI: 10.5220/0013201900003944
In Proceedings of the 10th International Conference on Internet of Things, Big Data and Security (IoTBDS 2025), pages 27-38
ISBN: 978-989-758-750-4; ISSN: 2184-4976
Copyright © 2025 by Paper published under CC license (CC BY-NC-ND 4.0)
27

of smart environments, including smart homes, smart
cities, and smart health, among others (Gomez et al.,
2019).
The IoT-enabled Smart Homes pose as an impor-
tant application of IoT. Their technologies have revo-
lutionized the way we interact with our living spaces,
offering a multitude of possibilities for utilizing IoT
devices (Martins et al., 2024; Jr et al., 2024). Their
innovations are pivotal in enhancing our daily lives
by monitoring and adjusting various aspects of our
homes. From measuring environmental conditions to
seamlessly overseeing household appliances and even
regulating access to our homes, Smart Homes pro-
vide security, energy efficiency, low operating costs,
and convenience (Campos et al., 2024). Moreover,
they possess a dynamic and flexible nature, allowing
them to accommodate the evolving requirements of
the home residents. Additionally, they have an adapt-
able infrastructure capable of integrating with devices
from different providers and standards (Domb, 2019).
Although smart homes seem to be the future for
homes and despite the advantages highlighted earlier,
embracing smart home systems requires an invest-
ment in both hardware and setup (Larionova et al.,
2024). Additionally, we also face a significant imped-
iment to their widespread adoption that lies in con-
sumers’ perception that the investment in this transi-
tion may not justify the associated costs. This percep-
tion forms a barrier, hindering the broader acceptance
of smart home solutions (de Souza Dutra et al., 2020).
Moreover, while there has been extensive scrutiny
of capital and operational expenditures (CAPEX and
OPEX) in the context of smart cities, particularly in
energy-related domains like smart lighting and grids,
research on the corresponding costs for smart homes
remains scant. Previous studies (de Souza Dutra et al.,
2020; Larionova et al., 2024) have provided prelim-
inary CAPEX/OPEX estimations for smart homes,
with estimated costs distant from the average Ameri-
can. Hence, there is a critical need for a more com-
prehensive assessment to facilitate a smooth transition
from traditional residences to smart ones. Addition-
ally, it’s essential to delve deeper into the operational
expenses associated with managing data generated by
smart home devices.
To address the aforementioned problem, this pa-
per introduces a novel methodology aimed at esti-
mating a cost-effective CAPEX for end-users looking
to upgrade their residences into smart homes, along-
side OPEX considerations for smart home providers.
These providers manage the influx of messages and
API calls from smart devices, facilitating the delivery
of smart services to end-users. This approach stream-
lines the transition from conventional houses to smart
ones by eliminating the need for users to invest in ex-
pensive devices outright. The contributions of this pa-
per include: (i) methodology for estimating CAPEX
for smart end users and providers; (ii) methodology
for estimating OPEX for smart providers; (iii) intro-
duction of a new player: smart providers; (iv) four
smart home case studies; (v) suggestion of subscrip-
tion plans for monthly billing.
The remainder of this paper is organized as fol-
lows: Section 2 presents the related works. Section 3
describes our methodology. Section 4 summarizes
and discusses the results of our study cases. Finally,
Section 5 summarizes our contributions and presents
some future works.
2 RELATED WORKS
The energy consumption has become a matter of
greater importance to the world, especially after the
pandemic. The authors in (Pare
ˇ
zanin, 2023) under-
scores the critical necessity for the European Union
to diminish its energy reliance on the Russian Feder-
ation. Central to this imperative is the exploration of
adopting smart grids across the twelve member states
of the bloc, a move fraught with multifaceted chal-
lenges. The authors interrogate key aspects, such as
the readiness of distributed system operators to seam-
lessly integrate services with smart meters, as well as
the feasibility of categorizing member states based on
energy usage levels, among others.
Furthermore, the authors conduct a thorough anal-
ysis of the costs and advantages linked to deploy-
ing smart meters across all member states, presented
in a detailed tabular format. Despite the growing
significance of Smart Homes as a solution for en-
ergy conservation and reducing energetic dependency,
their absence in the discussion warrants further in-
vestigation. Subsequent subsections will explore the
CAPEX/OPEX associated with implementing smart
homes and other intelligent environments in greater
detail.
2.1 Smart Homes
The paper (de Souza Dutra et al., 2020) presents a
comprehensive framework for determining a set of
combinations of home appliances, taking into account
factors such as the structural layout of the house, local
weather conditions, pricing, and energy consumption.
The selected home appliances considered in this study
include wind turbines, photovoltaic panels, energy
storage systems, electric vehicles, heating, air con-
ditioning, and ventilation. Additionally, the authors
IoTBDS 2025 - 10th International Conference on Internet of Things, Big Data and Security
28

have provided a detailed cost analysis of these appli-
ances, ranging from USD 424.31 to USD 31,775.14.
While the paper introduces an intriguing method-
ology for generating appliance combinations based on
pricing considerations, it is pertinent to note that prior
research, particularly in the related works section, has
utilized mixed-integer linear programming (MILP)
techniques to yield superior results. To enhance the
credibility of the proposed framework, it is recom-
mended to compare its outcomes directly with those
obtained through MILP, thereby gauging its proxim-
ity to optimal solutions.
Furthermore, the selection of appliances for ex-
perimentation may not adequately address the transi-
tion from conventional to smart homes. The absence
of discussion regarding existing appliances within
households also raises questions about the practical-
ity and effectiveness of the smart home implementa-
tion. A more thorough examination of household ap-
pliances is imperative to facilitate a seamless transi-
tion towards smart homes, ensuring compatibility and
integration with pre-existing systems.
The paper (Larionova et al., 2024) introduces
a compelling study aimed at elucidating the poten-
tial energy and operational cost savings achievable
through the adoption of smart appliances, including
smart thermostats, lighting systems, security systems,
and HVAC units. Initially, the authors delineate the
CAPEX involved, detailing the costs associated with
each equipment, ranging from USD 250.00 to USD
1800.00, with installation and setup expenses total-
ing USD 500.00, amounting to USD 3720.00. Sub-
sequently, they present the OPEX through a tabu-
lar representation showcasing monthly energy savings
from each device under scrutiny, cumulatively reach-
ing USD 240.00.
While the paper serves as a commendable foun-
dation for assessing the costs of integrating smart ap-
pliances into conventional households, it falls short of
adequately addressing the concept of a smooth transi-
tion. Specifically, there is a notable oversight in con-
sidering the average income levels of individuals, par-
ticularly in the context of the USA, along with associ-
ated living expenses. For instance, the average salary
is noted as USD 4,537.48, while the cost of living
for a single person, excluding rent, is USD 1,170.40.
Factoring in average rent in suburban areas, the total
living expenses surge to USD 2,943.48, leaving a re-
mainder of USD 1,594.00 for discretionary spending.
This crucial aspect merits further attention to ensure a
more comprehensive evaluation of the feasibility and
practicality of transitioning to smart homes ((Zillow),
2024).
2.2 Other Smart Environments
The paper (Cacciatore et al., 2017) investigates the
cost analysis of implementing smart lighting in smart
cities, evaluating four solutions: Current implemen-
tation (CUR), Delay-based (DEL), Encounter-based
(ENC), and Dimming (DIM). These solutions involve
combinations of two types of lighting devices: Light-
Emitting Diode lamps (LEDs) and High-Pressure
Sodium (HPS) lamps. LEDs offer the capability to
adjust light intensity, whereas HPS lamps only pro-
vide on/off functionality.
In the CUR solution, traditional lamps are utilized,
operating at full intensity for a predetermined dura-
tion. The DEL solution utilizes both LED and HPS
lamps, activating at full intensity when sensors detect
people within a designated radius R and turning off
when no presence is detected within a period W. The
ENC proposal activates lights in the morning upon de-
tecting the presence and remains on for a period W,
exclusively employing HPS lamps. Lastly, the DIM
solution adjusts light intensity based on the number
of people detected within a radius R, utilizing only
LED lamps. The authors ascertain that the DIM solu-
tion, leveraging LEDs, yields the most favorable en-
ergy savings.
The study in (Yaacoub and Alouini, 2020) advo-
cates for embracing the concept of ”smart living” as
a means to counter the migration from rural to ur-
ban settings. They define smart living as the inte-
gration of advanced technologies and connectivity to
stem or mitigate the flow of individuals to urban cen-
ters. Achieving this objective entails ensuring robust
connectivity in rural areas to facilitate remote work
opportunities, leveraging solar panels for sustainable
energy generation, implementing high-speed rail sys-
tems for occasional urban transit, and employing vir-
tual and augmented reality tools to enhance educa-
tional experiences for children. To support the re-
alization of these initiatives, the paper outlines the
necessary capital and operational expenditures for es-
sential infrastructure components such as microwave
towers and equipment, spectrum licenses, fiber optic
networks, satellite systems, and related installations.
The paper (Mehta and Eleftheriadis, 2022) intro-
duces a framework aimed at assessing the expenses
associated with deploying edge cloud resources, with
the goal of mitigating energy consumption’s effects
on the nodes within the electrical grid. This frame-
work categorizes CAPEX into two distinct categories:
active and passive equipment. Active expenditures
encompass the primary costs associated with servers,
radio equipment, and network infrastructure. Con-
versely, passive expenditures encompass expenses re-
Bridging the Cost Gap: A Comprehensive Analysis of CAPEX and OPEX for Smart Home Transition from a Provider’s Perspective
29
lated to building construction, procurement, and in-
stallation of power distribution systems, as well as
cooling infrastructure. Additionally, OPEX is bifur-
cated into two segments: the electricity required to
power and cool the servers and operational costs cov-
ering aspects such as security measures and mainte-
nance activities.
3 METHODOLOGY
In this section, we delineate a comprehensive method-
ology to estimate the expenses of transforming a tra-
ditional household into a Smart Environment. To
achieve this, we explore two key cost dimensions.
Firstly, we examine the perspective of the com-
pany offering Smart Environment solutions (OPEX).
This entails outlining all expenditures associated with
licensing communication channels between device
manufacturers and the new provider, the procurement
costs of sensors for resale, licensing fees for Software
Development Kits (SDKs) required for implementing
intervention applications on the devices, and cloud
hosting expenses for delivering associated services.
We also highlight the communication costs of the de-
vice with the manufacturer’s cloud, charged monthly
throughout the entire useful life of the device. Sec-
ondly, we delve into the costs from the customer’s
viewpoint, encompassing the acquisition of Smart En-
vironment solutions and projecting potential expenses
(CAPEX).
3.1 OPEX
In this subsection, we describe our approach to ana-
lyzing and calculating the costs related to operating
the devices through a Smart Environment provider.
We aimed to understand all the values involved in
the relationship between Smart Devices manufactur-
ers and the new Smart Devices provider. This work
aims to establish a guide that provides an overview of
costs for a new provider so that new entrants can ad-
equately consider the values related to CAPEX and
OPEX of their new venture, having detailed infor-
mation to avoid unforeseen circumstances and main-
tain financial health in their new operation. Further-
more, the customer-centric aspect may offer valuable
commercial insights for composing sensor and device
sales kits or establishing a monthly service plan for re-
curring income. Additionally, it allows the customer
to assess their investment in this type of solution tan-
gibly. To carry out this study, we followed five steps,
which are described as follows.
Step 1
We researched potential Smart device manufactur-
ers and their methods of establishing partnerships
with new providers interested in commercializing
and distributing these devices.
Step 2
We selected a manufacturer to conduct the case
study and investigated the commercial and con-
tractual conditions for establishing partnerships be-
tween the manufacturer and the new provider.
Step 3
After analyzing these conditions, we identified the
related costs within two main areas. The first area
pertains to acquiring a physical batch of specific
devices, such as power plugs, smart bulbs, robotic
vacuums, and electronic locks, among others. The
values are presented in product batches and are
based on US dollars. The second area involves
licensing for communication between the devices
and the manufacturer’s cloud. In this scenario, the
messages are charged to the provider from the mo-
ment of sale until the device is discarded by the
customer.
After selecting the manufacturer and obtaining the
devices, It is essential to highlight the associated costs
for the interactions among the device, manufacturer,
and cloud provider, considering the associated costs.
The devices typically communicate using the Mes-
sage Queuing Telemetry Transport (MQTT) protocol,
renowned for its efficient transmission of data over
networks with limited resources. MQTT is favored in
IoT environments due to its simplicity in implementa-
tion and its ability to minimize data usage and energy
consumption during operation.
The MQTT protocol is used in this context to pe-
riodically report their status whenever there is any
change in the environment or configuration, referred
to by the manufacturer as a message subscription. An-
other form of communication is a direct intervention
by a user or application in the device, whether to turn
it on, or off, change its configuration, or request its
current status, this scenario is referred to by the man-
ufacturer as an API call.
Figure 1 provides a general overview of how
the communication scheme between the device and
the manufacturer’s cloud operates. Additionally, the
same figure illustrates how the new provider physi-
cally operates in this context.
In general, there exist charges regarding commu-
nication licensing between companies. In this anal-
ysis, the manufacturer offers three annual plans with
IoTBDS 2025 - 10th International Conference on Internet of Things, Big Data and Security
30
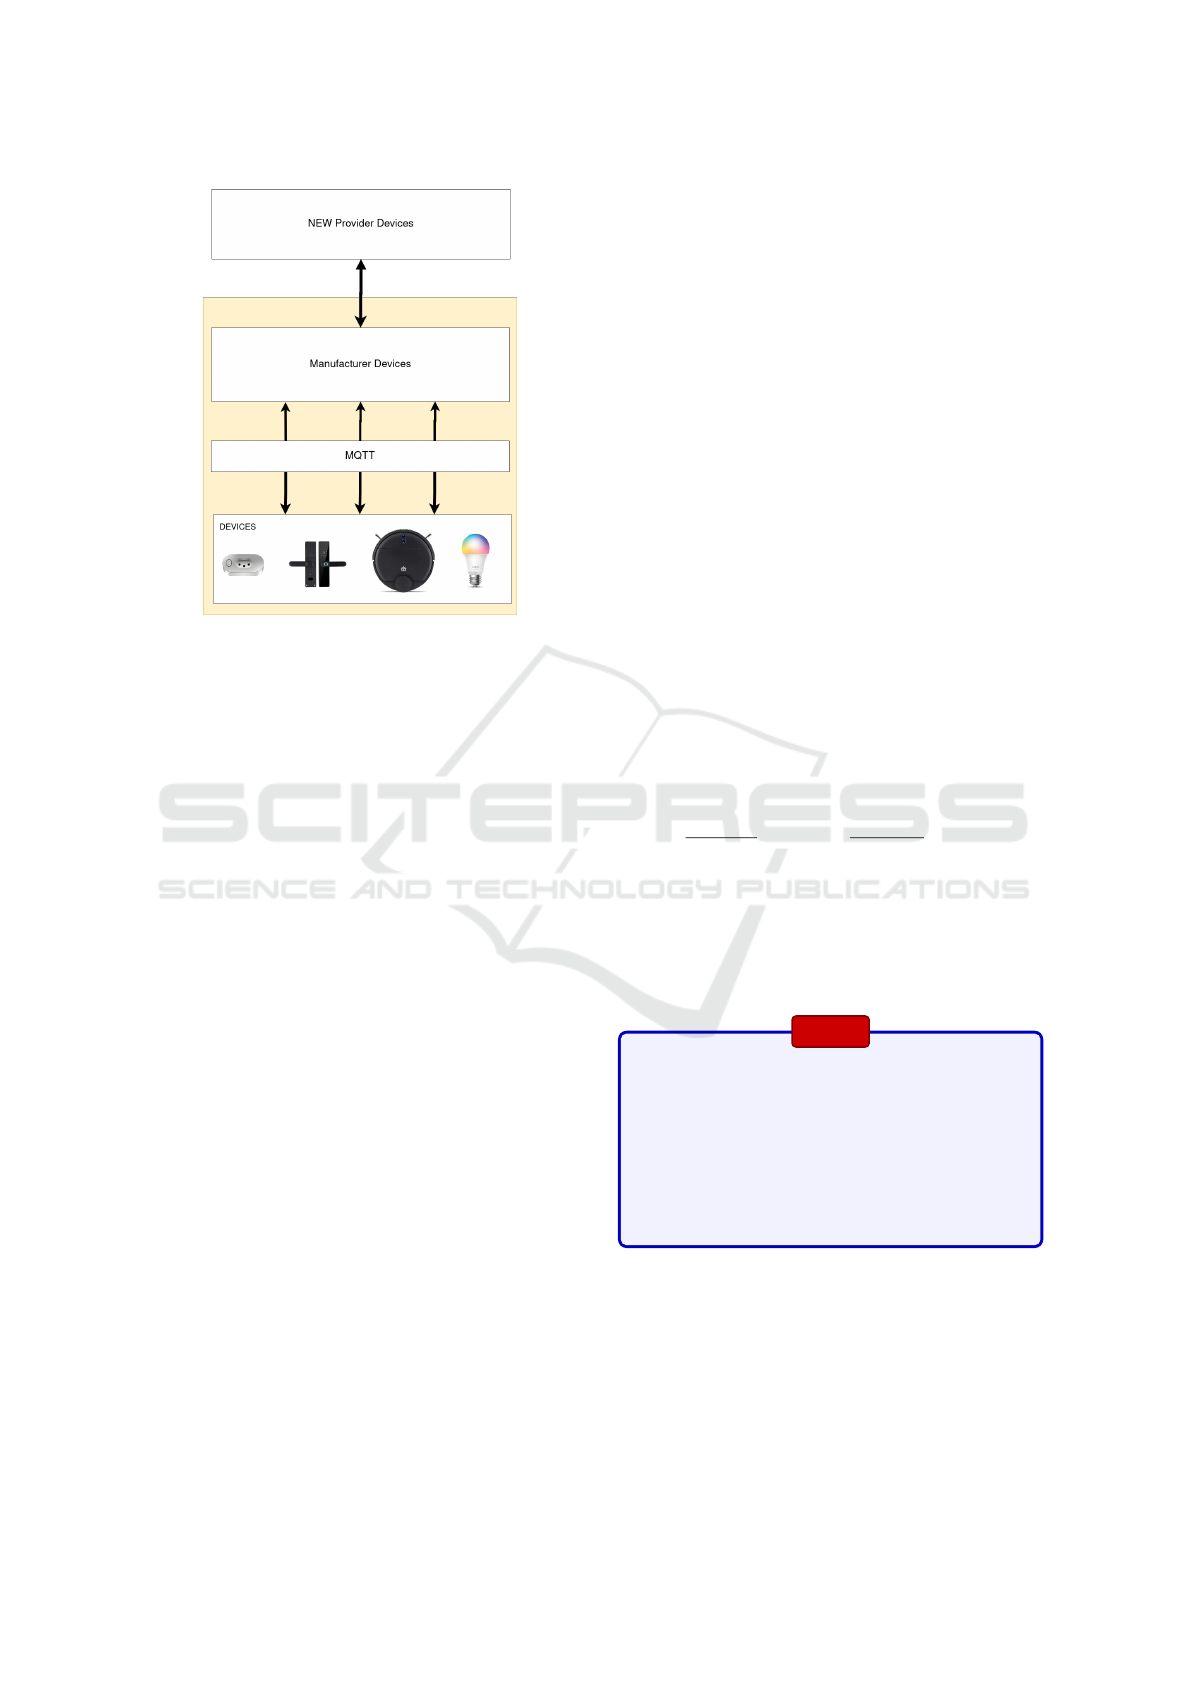
Figure 1: Device communication scheme.
fixed values charged in US dollars. These plans fea-
ture fixed values for specific monthly quotas. In
other words, regardless of the chosen plan, the tar-
iffed amount will remain predetermined if the quota
limit is not reached. However, if the quota limit is
exceeded, an excess fee will be charged and added
to that month’s quota. This excess fee is calculated
per million subscription messages and API calls and
is charged in US dollars. Additionally, it’s worth not-
ing that the excess fees differ between subscription
messages and API calls. The manufacturer also ap-
plies different rates between China and the rest of the
world, with lower rates in the former. This structure is
independent of the chosen plan, with only a potential
difference in value based on the selected plan.
In the monthly plans, the manufacturer under anal-
ysis initially offers a trial plan, which is solely for
experimentation purposes. In this case, the quota is
set at a small value, and when the limit is exceeded,
there is a charge for the automatic transition to the
subsequent plan. Additionally, the manufacturer re-
stricts the number and types of devices for this plan.
The intermediate plan is viewed by the manufacturer
as the bestseller and is geared towards sales consoli-
dation and structural expansion of the new provider.
The monthly quota for both subscription messages
and API calls is set at over 250 million each, aiming
to be sufficient for an entry-level provider to operate
with minimal excess during their first year. The third
and final plan is seen by the manufacturer as corpo-
rate and features a quota approximately double that
of the intermediate plan. This plan targets an estab-
lished smart home provider with a definitive product
mix.
To determine the method for calculating the cost
per device, we first measured the message subscrip-
tions performed by a plug-in operation in the lab for
one hour. Then, we performed the multiplications to
arrive at the monthly consumption of message sub-
scriptions, and to determine the value of the API calls;
we assumed that it was equal to the number of mes-
sage subscriptions collected.
Finally, we divided the result of these two items
by one million and multiplied it by the specific over-
age rate. The result is then added together, generating
the cost of the device in relation to the communica-
tion license per month. It is worth mentioning that
we used the overage values to establish a calculation
mechanism; however, it is important to remember that
within the plans offered, there are monthly quotas.
This cost serves the provider as part of the com-
position of the sales price, in addition to a point of
attention in the development of the sales planning and
the maintenance of the entire operation, as this cost
must be sustained by the provider throughout the en-
tire useful life of the device. In light of this, the plan-
ning should consider not only the initial sales costs
but also the ongoing expenses related to communica-
tion and maintenance, ensuring that the operation re-
mains financially viable and sustainable. Equation 1
illustrates this calculation mechanism.
C =
SMH×24×30
1,000,000
×CS M
+
APIH×24×30
1,000,000
×CAPI
(1)
where C is the cost per device per month in US dol-
lars, SMH stands for the number of message sub-
scriptions per hour, CSM indicates the excess cost per
message subscription per million, APIH refers to the
quantity of API calls per hour, and CAPI is the value
of excess cost per API call per million.
Step 4
A requirement from the device manufacturer for
the new provider to interact via its application on
its smart devices is the acquisition of the SDK. This
resource is essential for the provider to effectively
abstract the manufacturer from the customer’s per-
spective, with the customer using the application
assuming that the particular device is manufactured
and provided by the provider. The cost of the SDK
is annual and based on US dollars.
Figure 2 provides a general overview of how the
communication scheme between the device and the
manufacturer’s cloud operates. It considers the adop-
tion of the SDK and cloud hosting service. To de-
termine the method of calculating the annual cost of
a provider, add up the yearly communication licens-
ing plan, the annual SDK cost, and the annual cloud
hosting cost for the new provider. The Equation 2 il-
Bridging the Cost Gap: A Comprehensive Analysis of CAPEX and OPEX for Smart Home Transition from a Provider’s Perspective
31
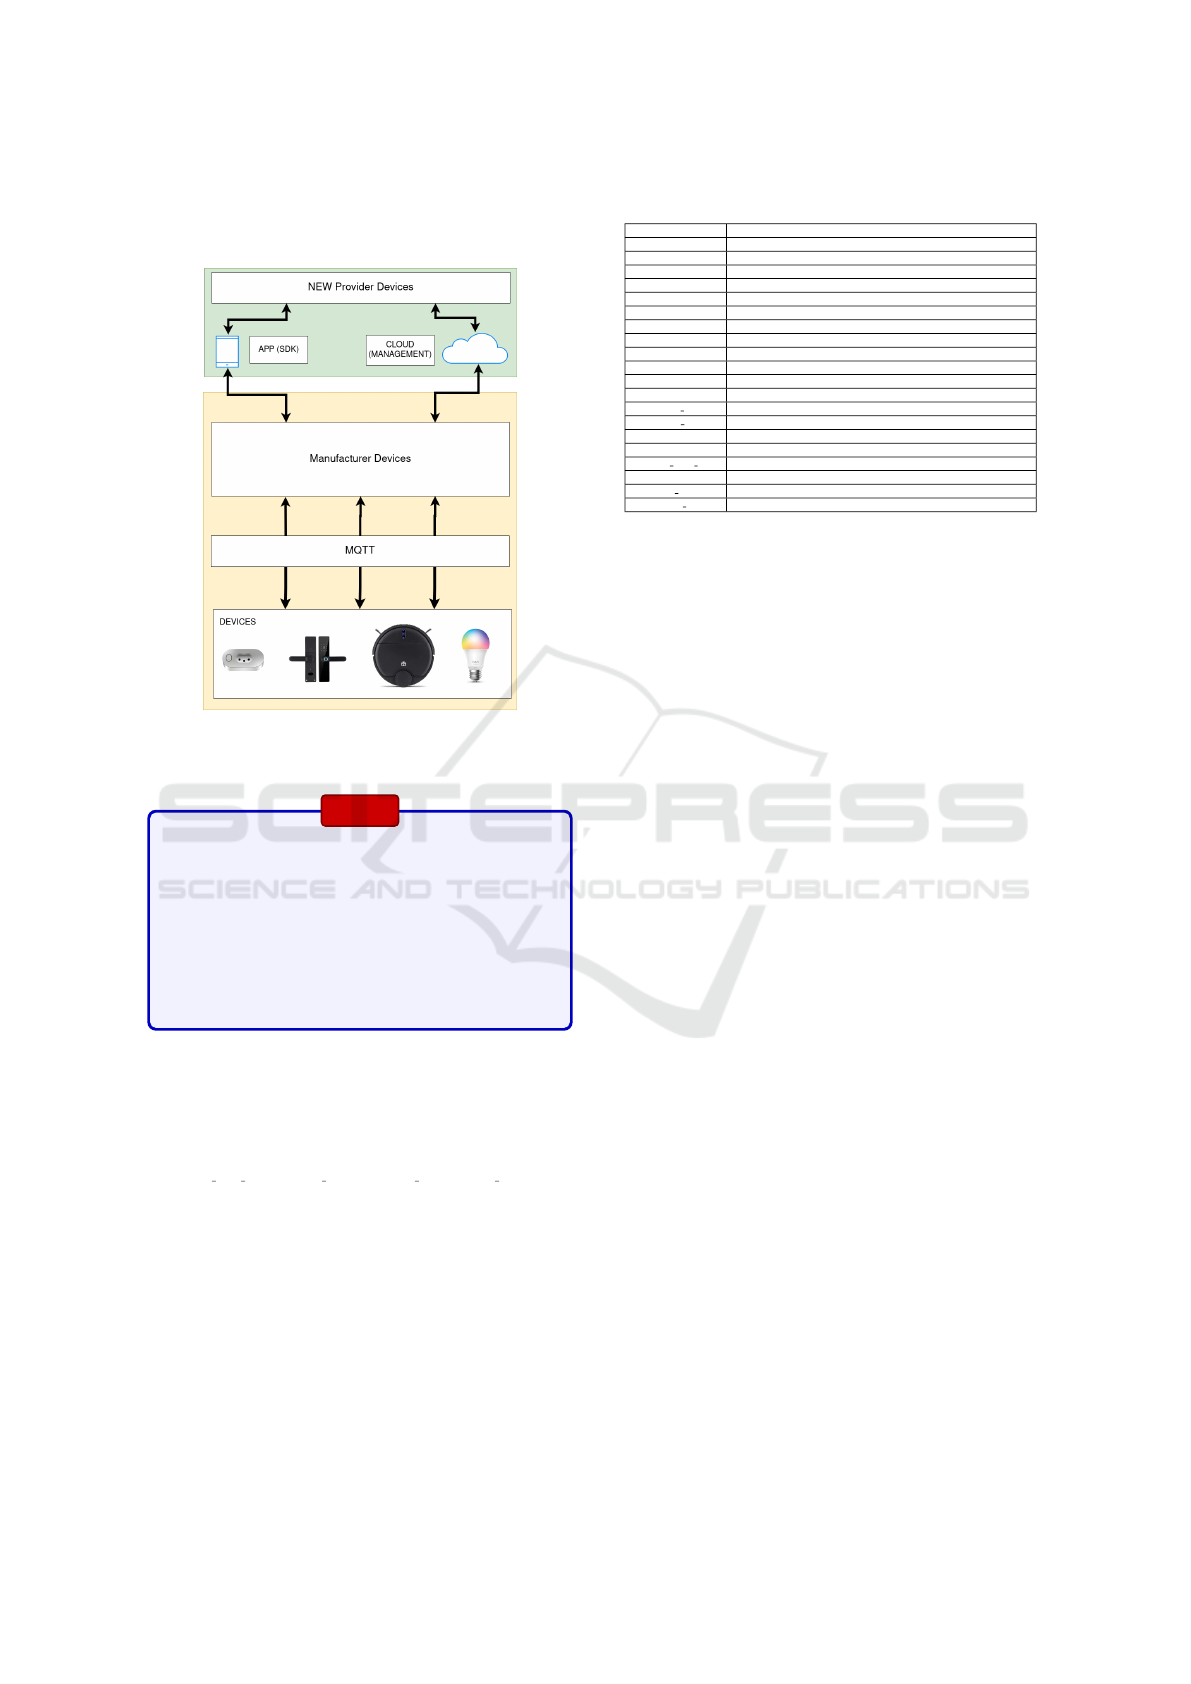
lustrates this calculation mechanism.
AnnualCost = AnnuaPlan +SDK + (Cloud × 12) (2)
Figure 2: Device communication scheme with the adoption
of the SDK and cloud hosting service.
Step 5
For the new provider to have an overview of all de-
vices within its domain, apply additional services,
or simply manage them in a global view, the acqui-
sition of cloud servers to support these services is
necessary. Therefore, in this work, we estimated a
minimum structure for adopting a platform to man-
age all devices of a new provider and sought prices
from providers such as AWS and Azure to estimate
the costs of this operation.
Important to highlight that this value may be sub-
ject to additional charges due to any monthly ex-
cesses. In this case, simply apply the mechanism of
Equation 1 for the months and add it to the annual
cost (Equation 2).
Annual Cost Exc = Annual Cost + (C × Dev Exc × Months Exc) (3)
Where the AnnualCostExc is the final value of the
year in case there are excesses, AnnualCost is the to-
tal cost of the year without excesses, C is the cost per
device per month in US dollars, DevExc is the num-
ber of devices that had excesses, and MonthsExc is
the number of months that had excesses in the year.
In this work, we are abstracting costs related to labor,
compliance with legislation, and accounting, among
others. Thus, we highlight the more specific costs
of the commercial relationship between the manufac-
turer and the new smart environment provider.
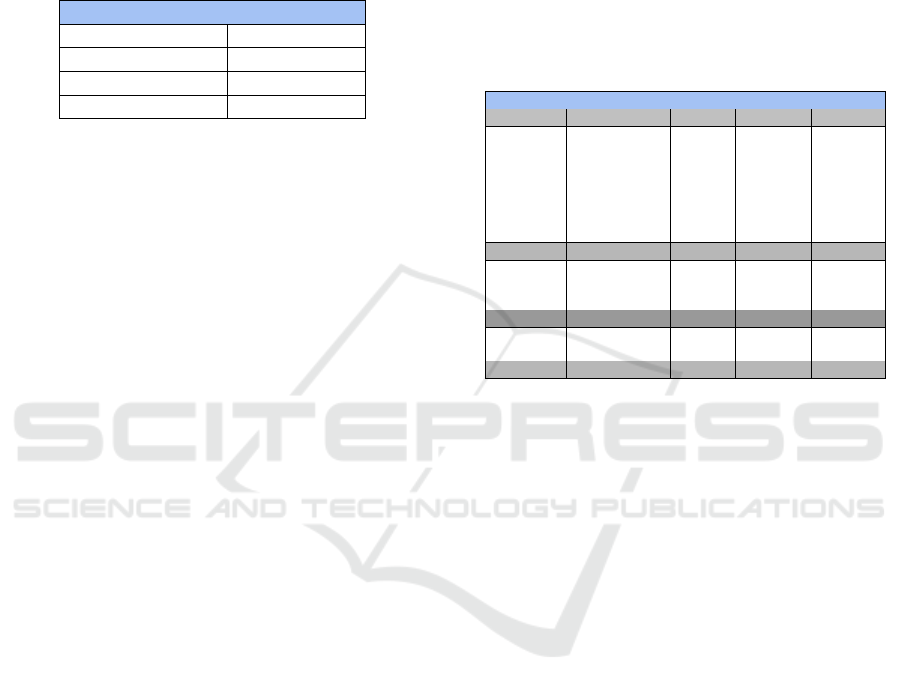
Table 1: Symbol table for CAPEX, OPEX, and equations.
Symbol Description
CAPEX Total capital expenditure for smart devices
n Number of devices
Device
i
The i-th smart device
UnitCost
i
The cost of the i-th smart device
C Operational expenditure for communication licensing per device
SMH Number of message subscriptions per hour
CSM Excess cost per message subscription per million
APIH Number of API calls per hour
CAPI Excess cost per API call per million
24 Hours per day
30 Days per month
1, 000, 000 Normalization factor (per million)
Annual Cost Total annual cost without exceeding quota
Annual Plan The annual cost of the communication licensing plan
SDK The annual cost of the Software Development Kit (SDK)
Cloud The monthly cost of cloud hosting services
Annual Cost Exc Total annual cost with excess quota charges
C Cost per device per month (for excess calculations)
Dev Exc Number of devices that exceeded the monthly quota
Months Exc Number of months where the quota was exceeded
3.2 CAPEX
We applied a customer-centric approach in our cost
analysis to assess the feasibility of Smart Environ-
ment and Smart Homes solutions. This study was
conducted to evaluate the cost-benefit for various
types of customers, considering factors such as the
size of the residence, number of rooms, family size,
and purchasing power, among others. This analysis
aims to understand the financial investment required
by users for the transition from a conventional house
to a smart home, as well as to provide commercial
guidance for new providers in this market segment.
To carry out this task, we initially needed to de-
fine usage models based on certain criteria. For this
purpose, we used data from ((Zillow), 2024) to un-
derstand the financial potential and associated cost of
living issues for American citizens. Subsequently, we
had to consider which devices would have the great-
est utility in the context of a smart home, taking into
account the legacy structure of a conventional house.
The definition of this device acquisition structure
is important for sizing the capacity that a provider
must have to support an operation that reflects this
acquisition. For example, the CAPEX of all devices
acquired by all customers is calculated by summing
the total number of devices multiplied by the unit
cost within a purchase lot offered by the manufac-
turer. This equation 4 illustrates the relationship be-
tween the initial investment represented by the acqui-
sition of the device lots and the consequent number
of active devices at customers. Providers need to con-
sider CAPEX comprehensively, as these devices will
be sending messages and generating monthly costs
while they are active, potentially consuming all as-
sociated profitability.
CAPEX =
∑
n
i=1
(Device
i
× UnitCost
i
) (4)
Following this approach, we determined that
smart plugs, light switches, and universal remotes
IoTBDS 2025 - 10th International Conference on Internet of Things, Big Data and Security
32
would have the highest effectiveness in terms of con-
version to a smart environment. These devices fa-
cilitate the transformation of conventional appliances
into smart ones; for example, a smart plug can auto-
mate the occasional shutdown of a freezer that might
otherwise remain on for the entire month.
Table 2: Basic smart devices costs.
Devices Required (USD)
Smart plug 17.80
Light Switch 19.80
Universal Control 17.00
Mesh router 69.00
Another key point highlighted in this analysis is
the high dependence on device connectivity, consid-
ering the constant need for message exchange with
the cloud. To address this, we researched and rec-
ommended mesh routers to meet the specific needs of
a smart home environment. Table 2 summarizes the
costs of basic devices to convert conventional houses
into smart ones.
4 STUDY CASES
In this section, we will present the cost analysis we
conducted for acquiring Smart Environment solutions
to convert a conventional house into a smart home
(CAPEX). Based on the analysis presented in Sec-
tion 3, Subsection 3.2, we defined four usage models,
taking into account the utilization of the smart envi-
ronment and the quantitative aspects related to house
size and the financial potential of American citizens.
This analysis is essential for guiding and align-
ing a provider’s operational costs, considering the mix
of different types of residences that will be explored
throughout this article. Understanding the variations
in consumption profiles and the specific demands of
each kind of residence enables the provider to adjust
its strategies more precisely in terms of infrastructure
and the services offered. This ensures not only a more
efficient operation but also the opportunity to opti-
mize resource allocation and improve profitability.
Considering this scenario, we will present the cost
perspective for the end customer and estimate the
number of residences for the development of the cost
model for a service provider in the following subsec-
tions.
4.1 End Customer View
These models will be detailed below:
Smart Environment Starter Kit: The suggested
Smart Environment starter kit is specifically designed
to meet the needs of individuals living alone or cou-
ples who are at the early stages of their financial
journey, with a growing yet still limited purchasing
power. This proposal aims to provide an affordable
and effective home automation experience for small
to medium-sized residences, with up to 5 rooms. Ta-
ble 3 provides a detailed breakdown of this composi-
tion.
Table 3: Cost analysis of the starter model.
Smart Environment Starter Kit
Device Appliance Quantity Unit Price Total Price
TV 1 $17.80 $17.80
Refrigerator 1 $17.80 $17.80
Microwave 1 $17.80 $17.80
Washing Machine 1 $17.80 $17.80
Computer 1 $17.80 $17.80
Outlets 1 $17.80 $17.80
Plug
Fan 2 $17.80 $35,60
Light Switch Light Switch 1 $19.80 $19.80
Universal
Control
Air Conditioner -
TV -
TV Receiver
1 $17.00 $17.00
Router Mesh 1 $69.98 $69.98
Total
Equipment
$249,18
To ensure a smooth transition to a smart environ-
ment, the kit includes a variety of essential devices.
Among them are 8 smart plugs, ideal for remotely
controlling and monitoring the operation of various
household appliances efficiently. Additionally, a
smart switch is included to offer convenient lighting
control throughout the home. For seamless inte-
gration of devices and a unified experience, the kit
also features a universal remote, allowing control
of multiple infrared-compatible devices, such as
TVs and audio systems, through a single device.
Lastly, a mesh router is recommended to ensure
reliable and consistent Wi-Fi coverage throughout
the residence, providing a stable connection for
all smart devices. This combination of devices
is designed to deliver comfort, convenience, and
energy efficiency, all within an affordable budget
for those taking their first steps into home automation.
Smart Environment Model 1: The suggestion for
Smart Environment Model 1 is specifically aimed at
families with at least 5 members, characterized by a
stabilized yet constantly expanding purchasing power.
The recommended residence for this scenario has a
maximum of 8 rooms and aims to automate at least 17
different household appliances, ensuring a smart and
efficient environment. The table 4 provides a detailed
breakdown of this composition.
In this context, we recommend including 21 smart
Bridging the Cost Gap: A Comprehensive Analysis of CAPEX and OPEX for Smart Home Transition from a Provider’s Perspective
33
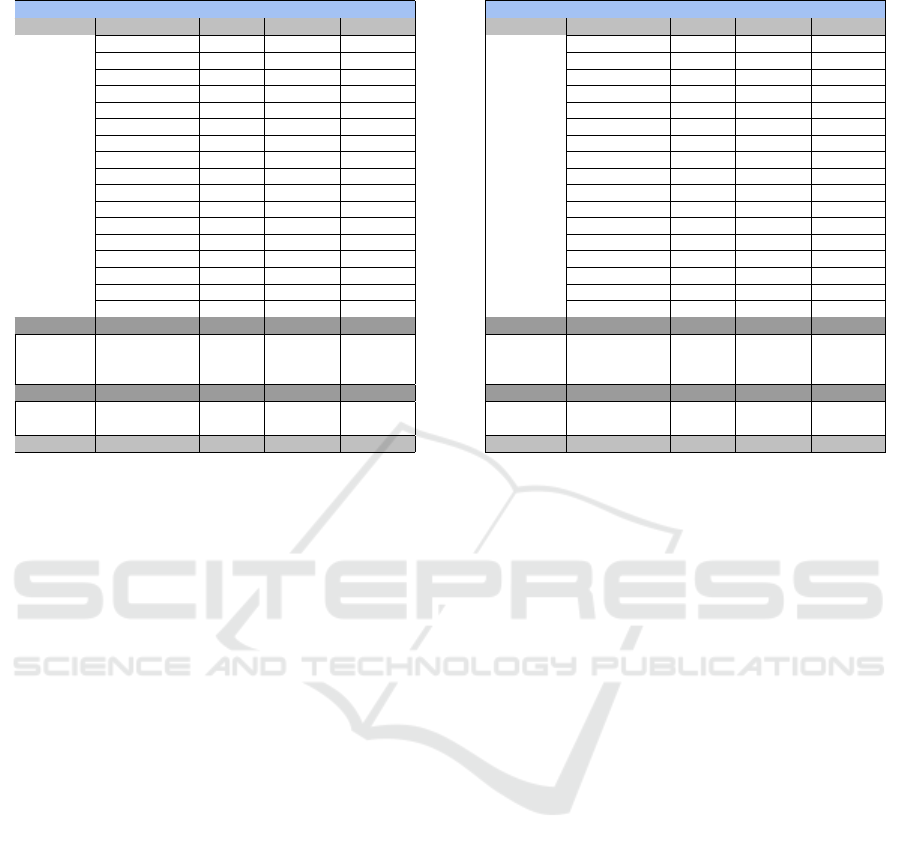
Table 4: Cost analysis of the model 1.
Smart Environment Model 1
Device Appliance Quantity Unit Price Total Price
TV 1 $17.80 $17.80
Refrigerator 1 $17.80 $17.80
Microwave 1 $17.80 $17.80
Coffee Maker 1 $17.80 $17.80
Air Conditioner 1 $17.80 $17.80
Washing Machine 1 $17.80 $17.80
Computer 1 $17.80 $17.80
Printer 1 $17.80 $17.80
Dishwasher 1 $17.80 $17.80
Plugs 5 $17.80 $89.00
Fan 1 $17.80 $17.80
Air fryer 1 $17.80 $17.80
Water filter 1 $17.80 $17.80
Stove 1 $17.80 $17.80
Freezer 1 $17.80 $17.80
TV receiver 1 $17.80 $17.80
Plug
Videogame 1 $17.80 $17.80
Switch Light Switch 3 $19.80 $59.40
Universal
Control
Air Conditioner -
TV -
TV Receiver
1 $17.00 $17.00
Mesh Router 2 $69.98 $139.96
Total
Equipment
$638.36
plugs, ideal for remote control and monitoring of
a wide variety of household appliances, providing
convenience and energy savings. Additionally, we
suggest installing 3 smart switches to facilitate
lighting management throughout the residence,
ensuring comfort and safety for the entire family.
For seamless integration and a unified experience,
the kit also includes a universal remote, allowing
convenient control of multiple infrared-compatible
devices, such as TVs, audio systems, and other
electronic devices, all from a single device. To ensure
comprehensive and stable Wi-Fi coverage throughout
the residence, we recommend including two mesh
routers, providing reliable connectivity for all smart
devices, regardless of their location in the house.
Smart Environment Model 2: The Smart Environ-
ment Model 2 suggestion is aimed at larger fami-
lies, with at least 10 individuals, characterized by
stable and defined purchasing power. The recom-
mended residence for this scenario has a maximum
of 12 rooms but with a considerable area compared to
Smart Environment Model 1. Additionally, the aim
is to automate at least 17 different household appli-
ances, with redundancy in some cases, such as 3 tele-
visions. The table 5 provides a detailed breakdown of
this composition.
In this context, we recommend the inclusion of 39
smart plugs, providing remote control and monitoring
of a wide variety of appliances, ensuring convenience
and energy efficiency. Furthermore, we suggest
installing 8 smart switches for lighting management
and 3 universal remotes to facilitate control of
Table 5: Cost analysis of the model 2.
Smart Environment Model 2
Device Appliance Quantity Unit Price Total Price
TV 3 $17.80 $53.40
Refrigerator 1 $17.80 $17.80
Microwave 1 $17.80 $17.80
Coffee Maker 1 $17.80 $17.80
Air Conditioner 2 $17.80 $35.60
Washing Machine 1 $17.80 $17.80
Computer 2 $17.80 $35.60
Printer 1 $17.80 $17.80
Dishwasher 1 $17.80 $17.80
Plugs 16 $17.80 $284.80
Fan 2 $17.80 $35.60
Air fryer 1 $17.80 $17.80
Water filter 1 $17.80 $17.80
Stove 1 $17.80 $17.80
Freezer 1 $17.80 $17.80
TV receiver 3 $17.80 $53.40
Plug
Videogame 1 $17.80 $17.80
Switch Light Switch 8 $19.80 $158.40
Universal
Control
Air Conditioner -
TV -
TV Receiver
3 $17.00 $51.00
Mesh Router 3 $69.98 $209.94
Total
Equipment
$1095.74
entertainment devices throughout the residence. To
ensure seamless integration and comprehensive Wi-Fi
coverage, we recommend including 3 mesh routers.
This will ensure a stable and reliable connection for
all smart devices, regardless of their location in the
house.
Smart Environment Model 3: The Smart Environ-
ment Model 3 suggestion is aimed at very large fami-
lies or small businesses, such as those in the hospital-
ity industry, with significant purchasing power. The
suggested location has a maximum of 22 rooms, with
a considerable area, and aims to automate at least 17
different household appliances, with redundancy in
some cases, such as 5 televisions. The table 6 pro-
vides a detailed description of this composition.
Within this context, we highly advocate for the
integration of 65 smart plugs, offering remote con-
trol and real-time monitoring capabilities for a diverse
range of appliances. Moreover, we propose the instal-
lation of 25 smart switches dedicated to efficient light-
ing management, complemented by the addition of 5
universal remotes. These remotes serve to streamline
device control across the entire residence or establish-
ment, further enhancing the smart living experience.
Figure 3 shows a bar chart illustrating the capi-
tal expenditure (CAPEX) associated with each smart
home model: the starter kit, model 1, model 2, model
3, and model 4. Each bar represents the total cost re-
quired to implement the respective model, highlight-
ing the scalability and different investment levels of
the smart home solutions offered from the end cus-
tomer’s perspective.
IoTBDS 2025 - 10th International Conference on Internet of Things, Big Data and Security
34
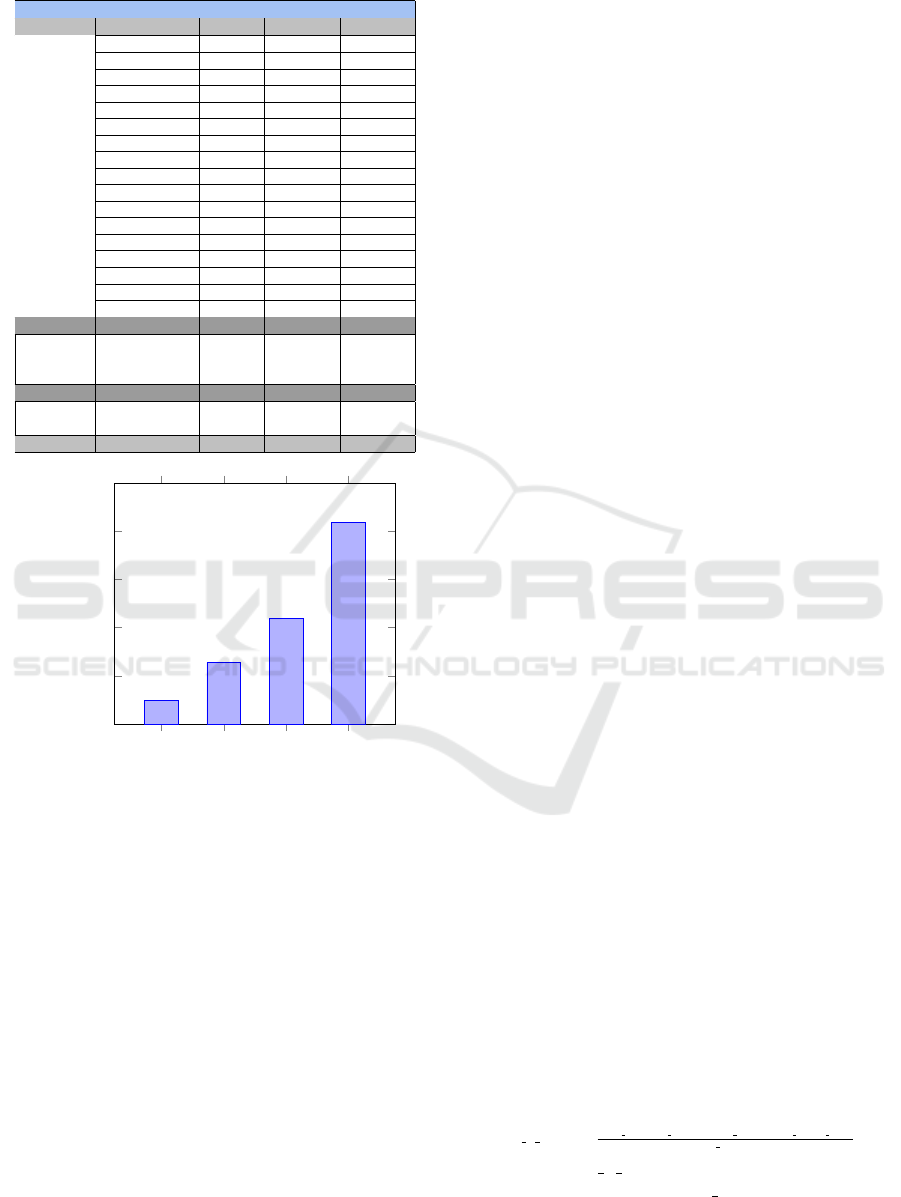
Table 6: Cost analysis of the model 3.
Smart Environment Model 3
Device Appliance Quantity Unit Price Total Price
TV 5 $17.80 $89.00
Refrigerator 2 $17.80 $35.60
Microwave 1 $17.80 $17.80
Coffee Maker 2 $17.80 $35.60
Air Conditioner 5 $17.80 $89.00
Washing Machine 1 $17.80 $17.80
Computer 2 $17.80 $35.60
Printer 1 $17.80 $17.80
Dishwasher 1 $17.80 $17.80
Plugs 30 $17.80 $534.00
Fan 5 $17.80 $89.00
Air fryer 1 $17.80 $17.80
Water filter 1 $17.80 $17.80
Stove 1 $17.80 $17.80
Freezer 2 $17.80 $35.60
TV receiver 3 $17.80 $53.40
Plug
Videogame 2 $17.80 $35.60
Switch Light Switch 25 $19.80 $495.00
Universal
Control
Air Conditioner -
TV -
TV Receiver
5 $17.00 $85.00
Mesh Router 5 $69.98 $349.90
Total
Equipment
$2086.90
Starter Model 1 Model 2 Model 3
0
500
1,000
1,500
2,000
2,500
249.18
638.36
1,095.74
2,086.9
CAPEX Costs (USD)
Figure 3: CAPEX for Different Smart Home Models.
To guarantee robust and consistent Wi-Fi coverage
throughout the area, we strongly advise the incorpora-
tion of 5 mesh routers. This strategic addition ensures
a stable connection for all smart devices, irrespective
of their placement within the space. Carefully curated
for optimal performance, this combination of devices
promises unparalleled convenience, comfort, and effi-
ciency in expansive family residences or commercial
settings. It represents a noteworthy investment in the
advancement of home or business automation, posi-
tioning stakeholders for a seamless transition into the
future of smart living and operational excellence.
Also, Figure 3 effectively underscores the range of
smart home solutions available, allowing consumers
to select a model that aligns with their specific needs,
household size, and financial capacity. The progres-
sive increase in CAPEX from the Starter Kit to Model
4 demonstrates the flexibility of smart environment
offerings, catering to a diverse spectrum of users,
from individual homeowners to large families and
small businesses.
4.2 Provider Cost Analysis
The definition of acquisition models for converting
conventional homes into smart homes serves as a ref-
erence for a provider to design the costs associated
with its operations, considering a specific volume of
assets. This mechanism is essential for identifying the
profitability of this type of operation. In addition to
the costs related to acquiring a specific lot of devices,
such as importation, logistics, storage, resale, market-
ing, post-sales, support operation, and infrastructure,
the provider must calculate the monthly communica-
tion costs between the device and the manufacturer.
This communication occurs automatically when the
device reports its status or when the application re-
quests information about its condition.
This scenario directly impacts the maintenance of
the profit obtained from a direct sales transaction,
which tends to be consumed over the equipment’s
lifecycle. To address this situation, the provider must
ensure a high and constant volume of sales of this
type of equipment or consider adding solutions to this
structure. An effective strategy is to implement a sub-
scription model, which enables recurring billing. In
this way, the provider can accommodate these ongo-
ing costs and establish a new source of revenue.
Table 7 presents an overview of the estimated
monthly and recurring costs for a universe of 500,000
homes. We considered the costs associated with the
development of the device management software, in-
cluding expenses for the software development kit
(SDK) necessary for creating the application. Addi-
tionally, the costs related to cloud servers, which are
essential for managing the APIs and services that en-
sure the proper functioning of the platform, are in-
cluded. We also accounted for the labor required to
support this entire infrastructure, as well as the com-
munication costs between the devices and the manu-
facturer. This comprehensive analysis is fundamental
for understanding the financial viability of the project
and for formulating strategies that ensure profitability
over time.
With this analysis, we were able to project the re-
curring cost of each house model for the previously
mentioned universe, using the mechanics of Equa-
tion 5.
Cost P House =
Mess Cost∗Qtd Houses+Cost Cloud+Cost OPEX Empl
Qtd Houses
(5)
Where Cost P House represents the monthly unit
cost per house model, Mess Cost refers to the to-
tal recurring cost of messages per house model for
Bridging the Cost Gap: A Comprehensive Analysis of CAPEX and OPEX for Smart Home Transition from a Provider’s Perspective
35
Table 7: Cost Assessment - Provider Perspective per house.
Cost Assessment - Provider Perspective per house
Description
Monthly Operation Cost
Capex Cost - AWS (Estimated) $ 3,642.38
Opex Cost - Employees (Estimated) $ 172,384.64
Number of Houses 500,000.00
Model Message Cost Operation Cost Unit Cost per house
House 1 $ 9.67 $ 5,014,895.75 $ 10.03
House 2 $ 19.35 $ 9,853,764.47 $ 19.70
Starter Kit $ 19.36 $ 2,111,574.52 $ 4.22
House 3 $ 36.77 $ 18,563,728.16 $ 37.13
the month. Qtd Houses pertains to the universe of
500,000 smart homes, while Cost Cloud is the value
associated with the cloud servers that support this
large-scale operation. Finally, Cost OPEX Empl cor-
responds to the labor cost necessary to maintain this
operation monthly. It is important to note that we are
abstracting costs related to regulatory compliance, ac-
counting, and other operational expenses. Thus, the
focus is on the more specific costs of the commercial
relationship between the manufacturer and the new
smart environment provider.
This tool enables the understanding of the sales
volume that the provider needs to maintain to sup-
port these recurring costs. By analyzing the costs of
each model, we can identify the variations that di-
rectly influence the provider’s financial sustainability.
Furthermore, this projection aids in formulating re-
curring sales strategies, ensuring that the provider not
only covers its expenses but also achieves additional
recurring profitability.
Based on these results, the vendor can design busi-
ness scenarios and assess whether current sales strate-
gies, which rely exclusively on device transactions
with customers, are sustainable in the long term. As
illustrated in Table 7, there are fixed operational costs
that occur monthly, regardless of whether the supplier
carries out new sales transactions. In other words,
even if sales are interrupted, the supplier’s fleet of
devices will continue to generate costs. This means
that the profitability obtained from previous sales will
have to be used to cover these ongoing operating
costs.
In this scenario, during a sales plateau, where
sales reach a point of stagnation, suppliers will face
a direct impact on their financial health. The ab-
sence of new revenue streams to offset these costs
may compromise the sustainability of the business in
the medium and long term.
The graphs 4 illustrate these trends, highlight-
ing the relationship between fixed costs, sales, profit,
sending messages and time. Therefore, it is essential
that providers diversify their monetization strategies
and seek new sources of revenue to maintain the fi-
nancial health of their operations.
Figure 4: Trends in sensor transaction-based model.
When analyzing the relationships and trends pre-
sented in the graphs, it is observed that profit can be
entirely consumed over time. Simultaneously, it is
noted that as the volume of messages sent increases,
whether through API calls or device status messages,
monthly costs also rise. There is a direct relationship
between sales and profit in this context: if sales stabi-
lize at an equilibrium point, profit decreases as it gets
absorbed by recurring costs.
These conclusions are supported by data analysis,
which shows the increase in costs over the months,
directly impacting profit. Over time, the accumula-
tion of messages tends to intensify this effect, further
increasing operational costs.
To address this scenario, we propose implement-
ing a solution that integrates device commercializa-
tion with a qualified sales strategy. Additionally, we
suggest adopting a monthly subscription model for
the service, based on the studies conducted on the
house model, allowing for a more predictable and sta-
ble revenue stream.
Table 8 offers an alternative to address the recur-
ring costs associated with devices by proposing the
adoption of monthly plans tied to the different types
of homes outlined in this study. These plans are de-
signed as the financial component of an integrated so-
lution aligned with the concept of a smart home, cre-
ating a sense of added value for the end customer and
encouraging subscription to a monthly plan.
From the provider’s perspective, this approach fa-
IoTBDS 2025 - 10th International Conference on Internet of Things, Big Data and Security
36

Table 8: Suggested Plans and Simulation.
Suggested Plans
Device Range Price (USD)
Between 1 and 15 Devices $ 7.20
Between 16 and 40 Devices $ 16.00
Between 41 and 65 Devices $ 32.00
Between 66 and 100 Devices $ 59.80
Plan Simulation
Model Distribution Operation Cost (USD) Revenue (USD) Profit (USD)
House 1 100,000 $ 1,143,800.78 $ 1,599,800.00 $ 455,999.22
House 2 100,000 $ 2,111,574.52 $ 3,199,800.00 $ 1,087,225.48
House 3 50,000 $ 2,014,797.15 $ 2,990,000.00 $ 975,202.85
Starter Kit 250,000 $ 1,143,800.78 $ 1,799,500.00 $ 655,699.22
Total 500,000 $ 6,413,973.24 $ 9,589,100.00 $ 3,175,126.76
cilitates the management of ongoing messaging costs,
which are incurred regardless of new sales. For the
end customer, the plan goes beyond the mere pur-
chase of a device, offering an additional solution that
enhances both functionality and value. In this way,
the subscription model not only fosters customer re-
tention but also provides a recurring revenue stream,
increasing the financial predictability of the operation.
In this simulation scenario, we projected the dis-
tribution of 500,000 smart homes in the suggested
models to estimate total operating costs. We then de-
signed monthly subscription plans based on the range
of devices corresponding to the home models used in
this study. With the projected distribution in place, we
calculated the monthly revenue from these subscrip-
tions. At the end of the process, we determined the
difference between the projected subscription revenue
and the total monthly costs, providing insight into the
profitability of the distribution. In addition, we out-
lined a scenario for supplemental profitability, which
could offset recurring operating expenses if sales vol-
ume stabilized over time. Below, we detail the steps
taken to perform these calculations, providing clarity
on the underlying assumptions, methods, and results.
Equation 6 calculates the operational costs based
on the distribution of different home models. For
example, for Model 1, we assigned a distribution of
100,000 units, and the equation computes the associ-
ated costs for this quantity and type of home.
Cost P Dist = Mess Cost ∗ Q Houses Dist + Cost Cloud + Cost OPEX Empl (6)
Where Cost P Dist represents the total monthly
cost per residential model, Mess Cost refers to the to-
tal recurring cost of messages per residential model
for the month. Q Houses Dist refers to the universe
of smart home distribution for the study model, while
Cost Cloud is the value associated with the cloud
servers that support this large-scale operation. Fi-
nally, Cost OPEX Empl corresponds to the labor cost
required to maintain this operation on a monthly ba-
sis.
Equation 7 The revenue is calculated based on the
distribution of different smart home models. For ex-
ample, Model 2 has a distribution of 100,000 units,
and the equation multiplies this quantity by the sug-
gested plan price to determine the total revenue for
that model.
Reven P Dist = Q Houses Dist ∗ Price Plan Model (7)
Where Reven P Dist represents the total monthly
revenue per residential model, Q Houses Dist refers
to the distribution universe of smart homes for the
study model, while Price Plan Model is the value as-
sociated with the suggested monthly subscription per
residential model.
Profitability, as shown in Equation 8, is also de-
termined based on the distribution of different smart
home models. It is calculated by finding the differ-
ence between the total revenue generated and the as-
sociated distribution costs
Profit P Dist = Reven P Dist − Cost P Dist (8)
Where Profit P Dist represents the total monthly
profit per residential model.
Finally, the total values of operating costs, rev-
enue, and profitability are calculated. These metrics
are represented by the equations 9, 10, and 11, re-
spectively. In this context, Total Operation Cost cor-
responds to the accumulated operating cost of the en-
tire scenario, Total Revenue represents the total rev-
enue generated by the distribution of smart home
models, and Total Profit reflects the net profitability,
calculated as the difference between total revenue and
operating costs. These calculations provide a compre-
hensive financial overview, allowing the assessment
of the sustainability of the business model and guid-
ing the provider for strategic decisions.
Total Operation Cost =
∑
n
i=1
(Cost P Dist
i
) (9)
Total Revenue =
∑
n
i=1
(Reven P Dist
i
) (10)
Total Profit =
∑
n
i=1
(Profit P Dist
i
) (11)
Bridging the Cost Gap: A Comprehensive Analysis of CAPEX and OPEX for Smart Home Transition from a Provider’s Perspective
37

5 CONCLUSION AND FUTURE
WORKS
To enable an affordable transition from conventional
to smart homes, the introduction of a new key player,
the smart environment provider, is essential. This en-
tity is responsible for delivering and managing smart
applications that control household appliances and
devices, ensuring an integrated and seamless experi-
ence for users. The analysis in this study highlights
that even the most advanced packages proposed are
more cost-effective than those presented in previous
research, offering a sustainable and advantageous so-
lution.
Additionally, our study explored subscription
models as an alternative to the traditional device sales
model, demonstrating the feasibility of a monthly
subscription-based approach. The research showed
that this model can foster greater customer reten-
tion, financial health, and scalability for smart ser-
vice providers. Future work will focus on optimizing
the cloud infrastructure needed to efficiently support
these services and further refining the transition pro-
cess, ensuring that smart solutions are accessible to
consumers with diverse profiles and economic back-
grounds.
ACKNOWLEDGEMENTS
Thanks to FAPESB, CAPES, and CNPq organizations
for supporting the Graduate Program in Computer
Science at the Federal University of Bahia. Alto,
thanks to Fundac¸
˜
ao de Amparo a Pesquisa do Estado
da Bahia (FAPESB) grant INCITE PIE0002/2022.
REFERENCES
Ashton, K. (2009). That ’internet of things’ thing: in the
real world, things matter more than ideas. RFiD Jour-
nal, page 4986.
Cacciatore, G., Fiandrino, C., Kliazovich, D., Granelli, F.,
and Bouvry, P. (2017). Cost analysis of smart light-
ing solutions for smart cities. In 2017 IEEE Interna-
tional Conference on Communications (ICC), pages
1–6. IEEE.
Campos, D., Martins, L., Mota, J., Tavares, D., Pereira, J.,
Oliveira, M., Boaventura, D., Correa, D., Ferreira, E.,
Pinto, G., Seixas, N., Maia, A., Rom
´
ario, M., Pas-
sos, E., Durao, F., Figueiredo, G. B., Peixoto, M.,
Januario, T., Prazeres, C., Machado, I., and Almeida,
E. (2024). Designing, implementing, and test-
ing ai-oriented smart home applications: Challenges
and best practices. In Ampatzoglou, A., P
´
erez, J.,
Buhnova, B., Lenarduzzi, V., Venters, C. C., Zdun, U.,
Drira, K., Rebelo, L., Di Pompeo, D., Tucci, M., Nak-
agawa, E. Y., and Navarro, E., editors, Software Ar-
chitecture. ECSA 2024 Tracks and Workshops, pages
83–99, Cham. Springer Nature Switzerland.
Cook, D. J. and Das, S. K. (2007). How smart are our en-
vironments? an updated look at the state of the art.
Pervasive and Mobile Computing, 3:53–73.
de Souza Dutra, M. D., da Conceic¸
˜
ao J
´
unior, G.,
de Paula Ferreira, W., and Chaves, M. R. C. (2020).
A customized transition towards smart homes: A fast
framework for economic analyses. Applied Energy,
262:114549.
Domb, M. (2019). Smart home systems based on internet
of things. In Ismail, Y., editor, Internet of Things (IoT)
for Automated and Smart Applications, chapter 3. In-
techOpen, Rijeka.
Gomez, C., Chessa, S., Fleury, A., Roussos, G., and Preuve-
neers, D. (2019). Internet of things for enabling
smart environments: A technology-centric perspec-
tive. Journal of Ambient Intelligence and Smart Envi-
ronments, 11:23–43.
Jr, J., Martins, L., Tavares, D., Campos, D., Dur
˜
ao, F.,
Prazeres, C., Peixoto, M., Figueiredo, G., Machado,
I., and Almeida, E. (2024). Unleashing the future of
smart homes: A revelation of cutting-edge distributed
architecture. In Anais do XVIII Simp
´
osio Brasileiro
de Componentes, Arquiteturas e Reutilizac¸
˜
ao de Soft-
ware, pages 41–50, Porto Alegre, RS, Brasil. SBC.
Larionova, Y. V., Sharma, D., Nijhawan, G., Kumari, N.,
and Devi, S. (2024). The economic viability of smart
home investments: A cost-benefit analysis. In BIO
Web of Conferences, volume 86, page 01086. EDP
Sciences.
Martins, L., Campos, D., Mota, J., Tavares, D., Pereira, J.,
Oliveira, M., Boaventura, D., Correa, D., Ferreira, E.,
Pinto, G., Seixas, N., Maia, A., Romario, M., Batista,
E., Durao, F., Bittencourt, G., Peixoto, M., Prazeres,
C., Machado, I., and de Almeida, E. S. (2024). A case
study of smart home development. IEEE Software,
pages 1–7.
Mehta, A. and Eleftheriadis, L. (2022). Smart edge
power management to improve availability and cost-
efficiency of edge cloud. In 2022 IEEE 15th Inter-
national Conference on Cloud Computing (CLOUD),
pages 125–133. IEEE.
Pare
ˇ
zanin, M. (2023). Costs and benefits of the implemen-
tation of smart grids in the european union. E-business
technologies conference proceedings, 3(1):28–33.
Sinha, S. (2023). State of IoT 2023: Number of con-
nected IoT devices growing 16% to 16.7 billion glob-
ally — iot-analytics.com. https://iot-analytics.com/
number-connected-iot-devices/. [Accessed 23-02-
2024].
Yaacoub, E. and Alouini, M.-S. (2020). Efficient fronthaul
and backhaul connectivity for iot traffic in rural areas.
IEEE Internet of Things Magazine, 4(1):60–66.
(Zillow), P. P. P. S. F. (2024). Cost of Liv-
ing in United States — numbeo.com. https:
//www.numbeo.com/cost-of-living/country result.
jsp?country=United+States. [Accessed 22-02-2024].
IoTBDS 2025 - 10th International Conference on Internet of Things, Big Data and Security
38
