
Modelling and Clustering Patterns from Smart Meter Data in Water
Distribution Systems
Mariaelena Berlotti
1a
, Sarah Di Grande
1b
, Salvatore Cavalieri
1c
and Roberto Gueli
2d
1
Department of Electrical Electronic and Computer Engineering, University of Catania, Viale A.Doria n.6, Catania, Italy
2
EHT, Viale Africa n.31, Catania, Italy
Keywords: Water Distribution System, Decision Support System, Smart Metering, Machine Learning.
Abstract: In recent years, water utilities have increasingly required a deeper understanding of users’ water demand
across their distribution networks to optimize resource management and meet customers' needs. With the
adoption of smart metering solutions, it has become possible to investigate water usage at a finer resolution,
enabling the collection of more detailed consumption data. In the present study, the authors present an
innovative methodology for identifying water usage using data from smart meters. First, a Multiple Seasonal-
Trend Decomposition algorithm is applied to extract seasonality from the raw time-series data. Next, the
Bootstrap sampling technique is used to train an optimized Time Series K-means algorithm on multiple data
configurations. Finally, the clustering results are interpreted graphically and validated, providing valuable
insights into consumption habits and a comprehensive assessment of the methodology's effectiveness and
stability.
1 INTRODUCTION
The increasing global population, along with rapid
urbanization and ongoing climate change, continues
to strain water resources. In many countries
worldwide, it has become increasingly common to
discuss about water crisis, referring to a deficiency in
the water systems. The causes of this crisis vary and
include several factors such as, primarily, the drought
due to climate change; the reduced rainfall and high
temperatures lead to a significant reduction in the
volume of water available in reservoirs (McDonald et
al., 2011). Another major cause is the lack of
maintenance of water infrastructures, which have
become outdated and poorly managed. In regards, the
International Water Association (IWA) estimates that
water losses from water systems worldwide amount
to 346 billion litres per day. The World Bank states
that 8.6 trillion gallons per year of water is lost due to
leakage and breakage in water networks worldwide
(Pearson, 2019). In this context, understanding water
a
https://orcid.org/0009-0008-8895-2175
b
https://orcid.org/0009-0007-6564-704X
c
https://orcid.org/0000-0001-9077-3688
d
https://orcid.org/0000-0002-8014-0243
usage is becoming crucial for an efficient
management of Water Distribution Systems (WDS).
Recently, the rise and expansion of smart-
metering technologies facilitate the quick and
extensive collection of water usage data at high
spatial and temporal detail (Cominola et al., 2019).
This data provides essential information, crucial for
improving the efficiency and sustainability of WDS
with specific applications including the development
of predictive models for water demand (Di Grande et
al., 2024), the advancement of water reuse and
recycling technologies (Du Plessis et al., 2018), the
classification of users profiles based on individual
water consumption patterns (Mazzoni et al., 2023)
together with the detection of possible anomalies and
irregularities through the investigation of unusual
water consumption behaviours (Berlotti et al., 2023 ).
Profiling consumers and evaluating the water demand
patterns to detect abnormal water consumption
behaviour is strongly requested to achieve a
sustainable management of WDS. Data-driven
approach based on machine learning or artificial
Berlotti, M., Di Grande, S., Cavalieri, S. and Gueli, R.
Modelling and Clustering Patterns from Smart Meter Data in Water Distribution Systems.
DOI: 10.5220/0013200500003929
In Proceedings of the 27th International Conference on Enterprise Information Systems (ICEIS 2025) - Volume 1, pages 691-698
ISBN: 978-989-758-749-8; ISSN: 2184-4992
Copyright © 2025 by Paper published under CC license (CC BY-NC-ND 4.0)
691

intelligence algorithms may be of great help to reach
this goal.
In this paper, the authors introduce a novel
clustering approach for identifying different user
profiles from water demand time series. By grouping
users with similar, though not identical, consumption
patterns, the method generates representative profiles
for both residential and non-residential users. This
approach not only allows for user type identification
based on consumption patterns but also makes the
clustering algorithm a robust tool for detecting
abnormal water demands, which may indicate the
presence of issues as leakages, irregularities, or
unauthorized consumption.
The paper is structured as follows: Section 2 is an
overview of the state of the art regarding the paper
subject. In Section 3 the authors give a detailed
description of the proposed approach. Section 4 will
provide a description of the representative patterns
featured by different types of consumers; moreover,
the main results obtained from the final test carried
out during the research, are presented. Finally, in
Section 5 concluding remarks will summarize the
contents of the paper.
2 RELATED WORKS
In this section, the authors provide an overview of the
current state of the art about methods used to identify
user profiles based on water demand data.
Traditionally, research on water consumption has
focused on the residential sector, as residential users
typically represent the largest share of water
consumers (Aksela and Aksela, 2011). Several
studies have been conducted to evaluate residential
water usage at different levels of spatial aggregation,
ranging from large-scale, such as entire cities or
District Metered Areas (DMA), to individual user
levels. Historically, water consumption at the user
level was examined using data collected from water
meters, aggregated on a monthly or yearly basis for
billing purposes. This kind of data provides a broad
view of the aggregate water consumed over a long
period, limiting the ability to analyze detailed
consumption behavior or identify specific trends.
With advancements in technology and the widespread
adoption of smart meters, much more granular data
can now be collected, such as every 15 minutes or
hourly. The availability of such high-resolution data
opens up new possibilities for more accurate profiling
and analysis of water usage, facilitating better
resource management and the identification of
possible anomalies that were previously difficult to
detect.
In their study, (Obringer and White, 2023)
propose a clustering approach to develop a typology
of residential water users. The study focuses on
understanding community-specific attitudes towards
water usage and conservation by applying
unsupervised learning techniques on social survey
data collected in three cities in the Southwestern
United States. The methodology combines social
survey data with unsupervised machine learning,
making it a novel approach to segmenting water users
based on behavioural patterns.
Similarly, (Arsene et al., 2021) explore the
profiling of water consumers in a WDS using K-
Means clustering along with multiple pre-processing
methods. The study analyses a sample of 800
households, and it focuses on improving the
identification of distinct water consumer profiles.
All the aforementioned studies focus specifically
on water consumption in the residential sector.
However, residential users account for only a small
portion of the total water supplied by utilities. A large
share of water is also consumed by industries,
commercial businesses, and other services (Aksela
and Aksela, 2011). On the basis of this consideration,
more recent studies have shifted focus toward
analysing water consumption at the non-residential
level.
In particular, (Cheifetz et al., 2017) proposed a
two-step machine learning approach for exploring
both residential and non-residential user profiles from
water consumption data produced by smart meters.
Their methodology is fully data-driven, applying a
Fourier decomposition algorithm to extract seasonal
patterns from time series data. Two clustering
strategies, K-Means and FReMix generative models,
are then evaluated and compared, providing a
qualitative interpretation of the resulting clusters.
In line with the approach by (Cheifetz et al.,
2017), the authors of this paper propose a multi-step
machine learning method to analyse hourly water
consumption data collected from smart meters of a
WDS in real WDS located in a city of the central Italy.
The first part of the approach focuses on profiling
typical water usage patterns for different consumer
types. To achieve this, several data-cleaning
techniques were applied, including Multiple
Seasonal-Trend time series decomposition using
LOESS (MSTL) (Bandara et al., 2021). Decomposing
the original time series into its main components,
helps isolate recurring consumption patterns,
enabling the clustering algorithm to focus on seasonal
trends instead of noise. An optimized Time Series K-
ICEIS 2025 - 27th International Conference on Enterprise Information Systems
692

means algorithm (TSKmeans), rather than the
standard K-Means, was used for profiling the
different users. To ensure stability in the clustering
results, the authors applied Bootstrap Sampling,
testing various clustering solutions with different sets
of hyperparameters during the optimization process.
Differently from (Cheifetz et al., 2017), in the
second part of the approach the authors were able to
validate the clustering results using geo-referenced
users’ information, ensuring that the identified
clusters reflect real-world patterns more reliably.
After validating the clusters, the authors conducted a
final test on a new set of residential users to identify
those whose water usage deviated from typical
patterns.
In conclusion, the integration of clustering with
geographic data represents a significant improvement
over existing methods, making the proposed approach
an effective decision-support tool for water utilities
able not only to profile the water consumption
patterns of user types but also to detect irregularities,
possibly due to billing errors, leakages or even
potential fraud in water consumption.
3 PROPOSED APPROACH
3.1 Data Acquisition
The data used in the analysis refers to the hourly
cumulative water demand in litres per second (l/s)
collected over nine months (September 5th, 2023-
May 31st, 2024) from smart meters monitoring six
District Metered Areas (DMAs) in a central Italian
city. In details, the DMAs consist of varying users
counts: 403 (DMA 1), 295 (DMA 2), 81 (DMA 3), 31
(DMA 4), 84 (DMA 5), 61 (DMA 6).
3.2 Data Preprocessing
Data preprocessing was necessary before proceeding
with clustering users. After downloading and merging
files in different formats, the authors began by
cleaning the data. Specifically, columns with more
than 30% of missing values were removed. Since the
dataset consists of time series, each column
corresponds to the hourly user's cumulative water
consumption. Therefore, removing a column means
deleting that user's data. All remaining missing values
were filled using the K-Nearest Neighbors (KNN)
spatial interpolation (Sahoo and Ghose, 2022). After
cleaning, each DMA counts the following users: 396
(DMA 1), 288 (DMA 2), 81 (DMA 3), 28 (DMA 4),
84 (DMA 5), 61 (DMA 6).
The next step was to transform the cumulative into
effective water consumption data. Smart meters
continuously monitor water use as cumulative litres
per second (l/s) meaning that they store the total
amount of water consumed until that point. However,
these aggregated values were not directly indicative
of how much water was used by the user in each hour.
To derive this information, the difference of
cumulative consumption values between two
consecutive hours was computed.
The final data preprocessing step was data
normalization, essential to establish a uniform
baseline and prevent the clustering bias from feature
scales (Ahsan et al., 2021). In the residential group,
household size can significantly affect total water
consumed, even when the overall consumption
patterns remain similar. To address this issue and
group households by behaviours regardless of size,
Min-Max scaling was applied, standardizing each
variable to 0-1 scale.
3.3 Data Exploration
Before proceeding with the analysis, an initial data
exploration was conducted to gain a basic
understanding of the dataset. Due to the authors'
inability to access information regarding the type of
user contract, a reconstruction of this data was
necessary. Thanks to the availability of geographic
information, it was possible to map the users and
identify the types of activities they were associated
with. An application able to provide the type of the
activity at a given location by providing longitude,
latitude, and address information was developed.
Finally, based on the output generated by the
mapping, a two-class label is assigned to each user,
distinguishing between residential and non-
residential categories.
This initial data exploration revealed that only 60
users in the sample are non-residential. This
imbalance reflects reality, as residential users
typically constitute the majority of water consumers
in a city . To solve this issue, the clustering model was
trained on a balanced dataset consisting of 145 users:
85 residential users were randomly selected from
across the six DMAs of the WDS. The remaining 60
represent the available non-residential user’s data.
3.4 Feature Engineering
Feature engineering is the process of transforming
raw data into more meaningful features to enhance
the performance of machine learning algorithms
(Kumar et al., 2017). The next step in the analysis
Modelling and Clustering Patterns from Smart Meter Data in Water Distribution Systems
693

involves using MSTL to extract seasonal patterns
from the original time series. MSTL iteratively
decomposes the time series into its main components:
seasonality, representing repeating patterns in the
data, trend, capturing the long-term changes, and
residuals, considered as noise or irregular
fluctuations (Bandara et al., 2021). Compared with
other decomposition alternatives, MSTL is highly
efficient and well-suited to handling large datasets
due to its computational scalability. To estimate the
different components, MSTL relies on LOESS (Local
Regression Smoothing), a non-parametric regression
method that fits local polynomial regressions to the
data, smoothing the series at each time point within a
defined window. The outcome of the procedure is a
smooth curve that represents the seasonality in the
data, filtered out from noise to reveal clear patterns
(Cleveland, 1979).
Two key hyperparameters have been set in the
MSTL algorithm: periods, regulating the length of
each seasonal cycle, and windows, referring to the
LOESS smoothing window size. While the window
size was left at its default value, the period was set to
168, to align with weekly water consumption
patterns. This strategic choice enables MSTL to
capture distinct weekly variations, such as residential
users consuming more water on weekends and
commercial users peaking on weekdays. The analysis
of MSTL seasonal components makes it easier to
identify similar user behaviours, allowing a more
effective clustering.
Lastly, seasonal data was aggregated into weekly
patterns by calculating the average hourly
consumption for each day of the week, for each
month. Instead of dealing with 720 observations, the
dataset was reduced to 168 observations (24 hours for
each of the 7 days in a week). By focusing on a
representative week, general daily and weekly
consumption patterns were captured without being
skewed by unusual dates within the month.
3.5 Feature Extraction
Principal Component Analysis (PCA) is an effective
dimensionality reduction technique whose main idea
is to transform the original data into a set of linear
combinations represented in a new space with
reduced dimensions (Pearson, 1901). Several reasons
justify the introduction of PCA in this analysis. First,
by focusing on the components with the most
variance PCA reduces noise and helps filter out less
significant data. Secondly, this technique highlights
dominant water consumption patterns that may not be
immediately visible in the original high-dimensional
space. Additionally, by reducing the number of
features, PCA makes the dataset more manageable
and computationally efficient.
After cleaning and transposition, PCA was
performed on the dataset of seasonal water
consumption patterns consisting of 145 users (rows)
and 1512 features (columns). By retaining 95% of the
variance, PCA results showed that rather than using
the original 1512 features, the dataset could be
reduced to 80 principal components. In essence, 80
components were sufficient to represent most of the
relevant information from the original features,
enabling more efficient data handling while
preserving critical insights into consumption patterns.
3.6 Modelling
This section explains the clustering procedure applied
in the analysis. A key challenge in clustering is
determining the optimal number of clusters while
ensuring stability—meaning the robustness and
consistency of clusters despite data variations or
random initialization. In this paper, the authors use a
Bootstrap sampling technique to test clustering
stability.
3.6.1 Bootstrap Sampling
Bootstrap sampling, or Bootstrapping, is a resampling
technique used in statistics and machine learning,
which consists in drawing multiple samples from the
original data with replacement, meaning that the same
data point can appear more than once in the resampled
dataset (Jain and Moreau, 1987). This technique
enables clustering validation on "fake" datasets that
differ from the original, with some users’ patterns
potentially missing. Starting with an unknown
population, X of n elements, m different bootstrap
samples (S
1
, S
2
, …, S
m
) are created, each containing
the water consumption values over a series of
timesteps for the users, who are equally likely to be
selected. The number of bootstrap samples, m, is a
key hyperparameter that needs to be tuned for optimal
model performance.
3.6.2 Optimization
Hyperparameter optimization, or tuning, involves
selecting the set of hyperparameters that yields an
optimal model by minimizing a predefined loss
function for a given dataset (Claesen and De Moor,
2015). In our analysis, various clustering models were
generated and tested with different sets of
hyperparameters using the Optuna Python library
(Optuna: A Hyperparameter Optimization
ICEIS 2025 - 27th International Conference on Enterprise Information Systems
694

Framework — Optuna 4.0.0 Documentation, n.d.). A
total of 100 trials were conducted to create and
compare 100 different clustering models across
different combinations of the original dataset as
determined by the number of bootstrap samples. The
following hyperparameters directly influencing the
complexity, speed and performance of the model
have been optimized: n_of_bootstraps (number of
samples drawn from the original dataset, range from
10 to 100), n_of_clusters (number of groups, range
from 2 to 20), max_iter (maximum number of
algorithm iterations to find the optimal clusters, range
from 50 to 300), tol (convergence threshold,
measuring centroids changes, range from 1e-6 to 1e-
4), n_init (number of algorithm initializations with
different initial centroids, range from 1 to 10).
3.6.3 Evaluation Metrics
The optimization process determines the best
clustering model, including the number of clusters
using the combined score of three equally weighted
metrics, given by (1).
𝐹𝑖𝑛𝑎𝑙 𝑆𝑐𝑜𝑟𝑒 = Silhouette score
−
𝐵𝐼𝐶
+𝐴𝐼𝐶
2
(1)
In equation (1), the final score combines the
average silhouette score with the average Bayesian
Information Criterion (BIC) and the average Akaike
Information Criterion (AIC). Each trial yields an
average of the metrics obtained across all
combinations of the original dataset tested.
The silhouette score is a metric to maximize,
while BIC and AIC are metrics to minimize.
Specifically, the silhouette score, ranging from -1 to
+1, measures clusters separation. In details, +1
reflects perfectly distinct clusters, -1 indicates overlap
or misallocation , and 0 suggests ambiguity in data
point assignments (Shahapure and Nicholas, 2020).
BIC and AIC are information criteria used for
model selection. Both metrics balance the model’s
goodness of fit against its complexity by
incorporating a penalty term to discourage complex
models (Gabbay et al., 2011). As a result, these
metrics provide a more nuanced evaluation compared
to the silhouette score.
3.6.4 Clustering
Clustering algorithm used in this study is TSkmeans
(Huang et al., 2016). TSkmeans was specifically
chosen for its ability to account for the sequential
nature and temporal distortions in the data, challenges
that traditional clustering methods struggle to address
(Berlotti et al., 2024). Unlike traditional K-means,
TSkmeans incorporates Dynamic Time Warping
(DTW) metric to account for temporal shifts,
varying speeds, and local distortions in sequences,
providing a more comprehensive measure of
similarity among time-dependent data points
(Tslearn.Clustering.TimeSeriesKMeans — Tslearn
0.6.3 Documentation, n.d.). The integration of DTW
into TSkmeans improves the detection of similar
water usage patterns, leading to more accurate
insights for efficient water resource management.
4 RESULTS
In this section, the authors discuss the obtained
results. The clustering model was trained on a dataset
of 145 users: 85 residentials and 60 non-residential.
Table 1 shows the input dataset used for modelling.
Specifically, after PCA the data was transposed to
place users in columns, ensuring that each user became
a feature in the dataset. This transposition is crucial for
clustering, as it allows the algorithm to make
meaningful comparisons between user’s water
consumption patterns, rather than focusing on time
points or specific measurements. Finally, additional
daytime information (Year, Month, Day of the Week,
and Hour) was added in the dataset.
Table 1: Final input dataset for modelling.
Year Month Day of
wee
k
Hour User1 … UserN
2023 9 Monday 0 0.47738 … 0.554809
… … … … … … …
2024 5 Sunday 23 0.599534 … 0.459491
The optimization step yielded the following
hyperparameters configuration: {n_of_bootstraps=10,
num_clusters=4, max_iter=158, tol=5.69941e-06,
n_init=8}. Figure 1 shows the average weekly pattern
of each cluster for the optimal repartition K=4.
Next, a realistic explanation of the clusters is
given. Clusters 1 and 2 group residential users’
patterns with similar habits. Both show peaks around
1:00–3:00 pm (lunch time), and 7:00–11:00 pm
(dinner time), with higher water consumption on
weekends, especially Sundays. Instead, Cluster 3 and
4 include non-residential users. In Cluster 3, users
typically consume water from 9:00 am to 2:00 pm
(peak at noon) and again from 4:00 pm to 8:00 pm
(peak at 6:00 pm), primarily during weekdays with
minimal activity on weekends. Meanwhile, Cluster 4
groups users whose consumption patterns differ
significantly from those of the other clusters, though
their behaviour still follows a consistent pattern.
Modelling and Clustering Patterns from Smart Meter Data in Water Distribution Systems
695
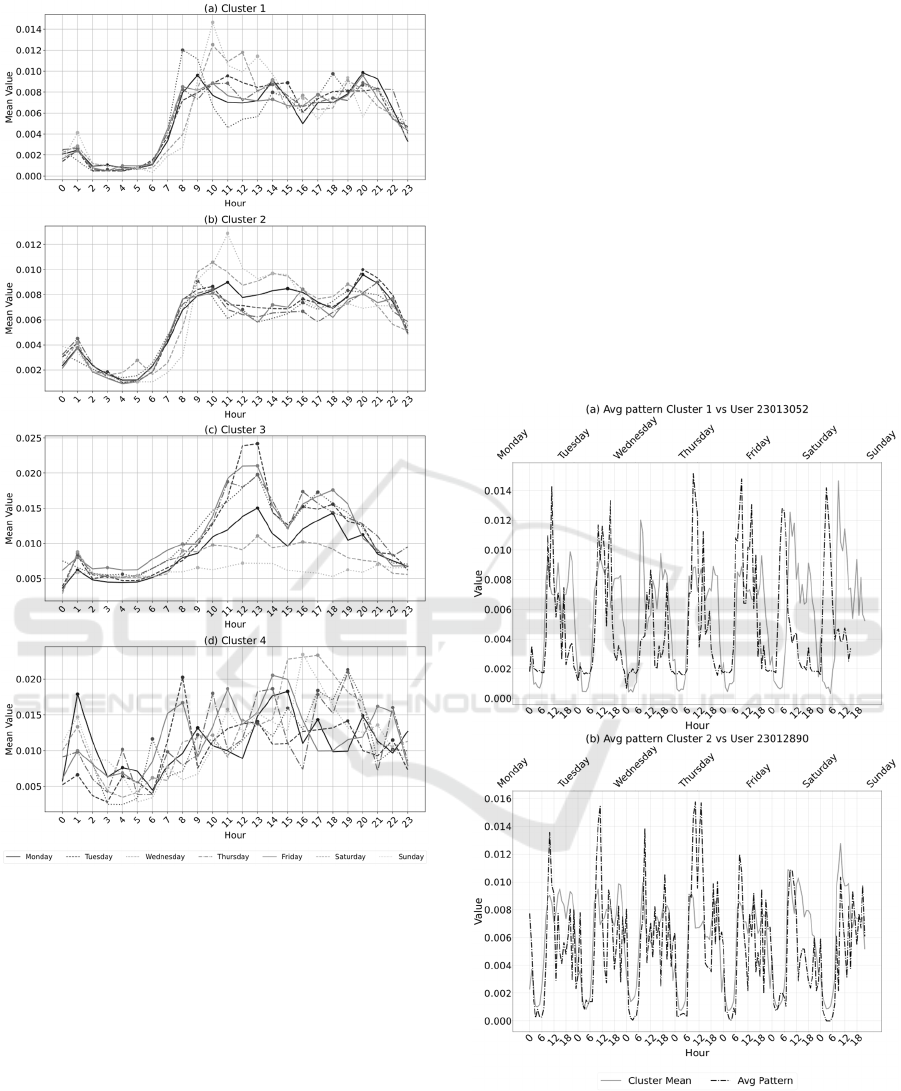
Figure 1: Average weekly pattern for each cluster.
These considerations were confirmed by the
georeferenced information. In particular, Cluster 1
and 2 include 37 and 49 users respectively, all
residential. Cluster 3 consists of 34 non-residential
users, including banks, garages, and service
companies. Finally, Cluster 4 is composed of 25
mixed users, of which only 9 are residential, while the
rest are non-residential, involved in industrial
activities.
As introduced before, in this paper a validation of
the clustering has been done with the aim of verifying
if it was possible to use the four clusters as input for
a decision-support system, capable of identifying the
user’s type from the consumption pattern and of
detecting any irregularities. In concerns, to test the
algorithm a new set of 30 randomly selected users
was considered. Some of the results achieved will be
presented in the following.
The first results shown involve two test users
(23013052 and 23012890) assigned to the residential
Cluster 1 and 2. Using georeferenced information, it
was possible to confirm that the two users were
residentials. To furthermore confirm this result, in
Figure 2 test users’ average hourly patterns (dotted
line) over one week were compared with the typical
residential pattern given by Cluster 1 and 2
(continuous line). Due to space constraints, the
timestamp is illustrated in 6-hour step. As shown in
plots (a) and (b), the two test users’ patterns closely
resemble the average patterns of the two residential
clusters in shape and structure.
Figure 2: Test users grouped as residentials.
The authors provide another example of test user
(23012939) chosen among the set considered. In
Figure 3 (a) and (b), the pattern of the test user is
compared with the average patterns of the residential
ICEIS 2025 - 27th International Conference on Enterprise Information Systems
696
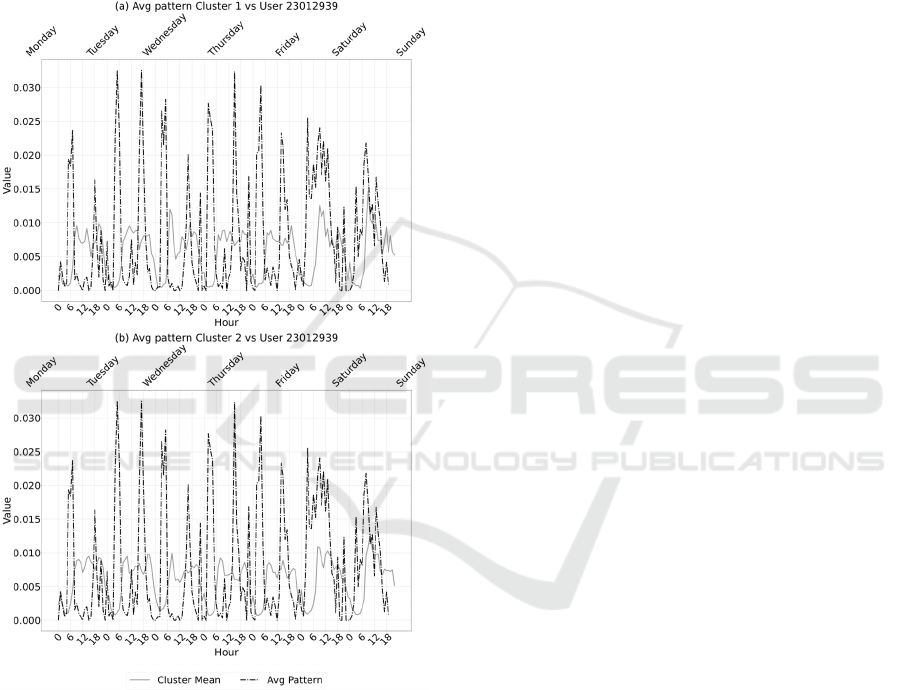
clusters 1 and 2. As shown in the plots, despite being
labelled as residential through georeferenced
information, the user was classified by the algorithm
in Cluster 4. Indeed, the test user exhibits a
completely different pattern compared to the typical
residential patterns of Cluster 1 and Cluster 2.
Specifically, the test user’s water consumption never
drops to zero at night, with unusual peaks which may
indicate an irregularity in consumption as well as the
presence of a leakage.
Figure 3: Strange user vs residential clusters patterns.
5 CONCLUSIONS
In this study, the authors propose a machine learning
approach for identifying users’ profiles from smart
meter water demand data. The data under analysis
refers to hourly time series recording the amount of
water consumed by each user over a period of nine
months. Using the MSTL algorithm, seasonality is
extracted from the original time series. Next, PCA is
performed on the seasonal patterns’ dataset, retaining
95% of the variance. The optimized TSkmeans
algorithm is then used to divide the data into different
clusters. The authors highlight a significant advantage
in using Bootstrap sampling to train the clustering
algorithm on various configurations of the input data.
This technique ensures that the model is less sensitive
to dataset variations, thus enhancing the robustness of
the results. The authors propose not only a graphical
evaluation of the clustering results, providing a
realistic explanation of the patterns' distribution, but
also its validation using the georeferenced
information available for each user. Ultimately,
testing the clustering on a new set of users, the authors
proved the ability of the algorithm to identify not only
the type of user from its pattern but also cases of
irregularities in water consumption.
Future plans involve increasing the size of the
population considered in the analysis, aiming to
include a larger number of both residential and non-
residential users to discover new possible water
consumption habits. Furthermore, the authors also
expect to extend the analysis period to one year,
incorporating users’ water consumption variations
during the summer.
ACKNOWLDEGEMENT
The research here presented has been partially
developed under the Project "DATA-SET: DATA
driven dependencies for Sustainable Energy and
Transport", "PIAno inCEntivi per la RIcerca di
Ateneo" (PIACERI) 2024/2026, Track 1 funded by
the University of Catania.
REFERENCES
Ahsan, M., Mahmud, M., Saha, P., Gupta, K., and Siddique,
Z. (2021). Effect of Data Scaling Methods on Machine
Learning Algorithms and Model Performance.
Technologies, 9(3), 52.
Aksela, K., and Aksela, M. (2011). Demand Estimation
with Automated Meter Reading in a Distribution
Network. Journal of Water Resources Planning and
Management, 137(5), 456–467.
Arsene, D., Predescu, A., Truică, C.-O., Apostol, E.-S.,
Mocanu, M., and Chiru, C. (2021). Profiling consumers
in a water distribution network using K-Means
clustering and multiple pre-processing methods. 2021
13th International Conference on Electronics,
Computers and Artificial Intelligence (ECAI), 1–6.
Bandara, K., Hyndman, R. J., and Bergmeir, C. (2021).
MSTL: A Seasonal-Trend Decomposition Algorithm for
Time Series with Multiple Seasonal Patterns
Modelling and Clustering Patterns from Smart Meter Data in Water Distribution Systems
697

(arXiv:2107.13462). arXiv. http://arxiv.org/abs/2107.1
3462
Berlotti, M., Di Grande, S., and Cavalieri, S. (2024).
Proposal of a Machine Learning Approach for Traffic
Flow Prediction. Sensors, 24(7), Article 7.
Berlotti, M., Di Grande, S., Cavalieri, S., and Gueli, R.
(2023). Detection and Prediction of Leakages in Water
Distribution Networks: Proceedings of the 12th
International Conference on Data Science, Technology
and Applications, 436–443.
Cheifetz, N., Noumir, Z., Samé, A., Sandraz, A.-C., Féliers,
C., and Heim, V. (2017). Modeling and clustering water
demand patterns from real-world smart meter data.
Drinking Water Engineering and Science, 10(2), 75–
82.
Claesen, M., and De Moor, B. (2015). Hyperparameter
Search in Machine Learning (arXiv:1502.02127).
arXiv.
Cleveland, W. S. (1979). Robust Locally Weighted
Regression and Smoothing Scatterplots. Journal of the
American Statistical Association, 74(368), 829–836.
Cominola, A., Nguyen, K., Giuliani, M., Stewart, R. A.,
Maier, H. R., and Castelletti, A. (2019). Data Mining to
Uncover Heterogeneous Water Use Behaviors From
Smart Meter Data. Water Resources Research, 55(11),
9315–9333.
Di Grande, S., Berlotti, M., Cavalieri, S., and Gueli, R.
(2024). A Proactive Approach for the Sustainable
Management of Water Distribution Systems. 115–125.
1
Du Plessis, J. L., Faasen, B., Jacobs, H. E., Knox, A. J., and
Loubser, C. (2018). Investigating wastewater flow from
a gated community to disaggregate indoor and outdoor
water use. Journal of Water, Sanitation and Hygiene for
Development, 8(2), 238–245.
Gabbay, D., Thagard, P., Woods, J., Bandyopadhyay, P.,
and Forster, M. (2011). Philosophy of Statistics (Vol.
7).
Huang, X., Ye, Y., Xiong, L., Lau, R. Y., Jiang, N., &
Wang, S. (2016). Time series k-means: A new k-means
type smooth subspace clustering for time series data.
Information Sciences, 367, 1-13.
Jain, A. K., and Moreau, J. V. (1987). Bootstrap technique
in cluster analysis. Pattern Recognition, 20(5), 547–
568.
Kumar, A., Boehm, M., and Yang, J. (2017). Data
Management in Machine Learning: Challenges,
Techniques, and Systems. Proceedings of the 2017
ACM International Conference on Management of
Data, 1717–1722.
Mazzoni, F., Alvisi, S., Blokker, M., Buchberger, S. G.,
Castelletti, A., Cominola, A., Gross, M.-P., Jacobs, H.
E., Mayer, P., Steffelbauer, D. B., Stewart, R. A.,
Stillwell, A. S., Tzatchkov, V., Yamanaka, V.-H. A.,
and Franchini, M. (2023). Investigating the
characteristics of residential end uses of water: A
worldwide review. Water Research, 230, 119500.
McDonald, R. I., Green, P., Balk, D., Fekete, B. M.,
Revenga, C., Todd, M., and Montgomery, M. (2011).
Urban growth, climate change, and freshwater
availability. Proceedings of the National Academy of
Sciences, 108(15), 6312–6317.
Obringer, R., and White, D. (2023). Leveraging
Unsupervised Learning to Develop a Typology of
Residential Water Users’ Attitudes Towards
Conservation. Water Resources Management, 37(1),
37–53.
Optuna: A hyperparameter optimization framework—
Optuna 4.0.0 documentation. (n.d.). Retrieved 23
September 2024, from https://optuna.readthedocs.io/
en/stable/index.html
Pearson, D. (2019). Standard Definitions for Water Losses.
IWA Publishing.
Pearson, K. (1901). On lines and planes of closest fit to
systems of points in space. The London, Edinburgh, and
Dublin Philosophical Mangazine and Journal of
Science, 2(11), 559-571, https://doi.org/10.1080/147
86440109462720
Sahoo, A., and Ghose, D. K. (2022). Imputation of missing
precipitation data using KNN, SOM, RF, and FNN. Soft
Computing, 26(12), 5919–5936.
Shahapure, K. R., and Nicholas, C. (2020). Cluster Quality
Analysis Using Silhouette Score. 2020 IEEE 7th
International Conference on Data Science and
Advanced Analytics (DSAA), 747–748.
tslearn.clustering.TimeSeriesKMeans—Tslearn 0.6.3
documentation. (n.d.). Retrieved 25 September 2024,
from https://tslearn.readthedocs.io/en/stable/gen_mod
ules/clustering/tslearn.clustering.TimeSeriesKMeans.h
tml
ICEIS 2025 - 27th International Conference on Enterprise Information Systems
698
