
Emerging Technologies Acceptance Within the Romanian Educational
System: A Case Study Using the UTAUT Model
Corina Pop Sitar
1 a
, Mara Hajdu M
˘
acelaru
2 b
and Petric
˘
a Pop
2 c
1
Department of Economics, Faculty of Sciences, North University Center of Baia Mare,
Technical University of Cluj-Napoca, Victoriei 76, Baia Mare, Romania
2
Department of Mathematics and Informatics, Faculty of Sciences, North University Center of Baia Mare,
Technical University of Cluj-Napoca, Victoriei 76, Baia Mare, Romania
Keywords:
Emergent Technologies (ETs), Artificial Intelligence (AI), Education, UTAUT Model, Technology
Acceptance.
Abstract:
Emerging Technologies (ETs) will play an important role in our society. Despite their crucial role, the multi-
faceted impact of technological innovation on society remains still under investigated. This study investigates
the acceptance of Artificial Intelligence (AI) in the Romanian educational system through a survey of 187
educators, analyzed using the Unified Theory of Acceptance and Use of Technology (UTAUT) and partial
least squares structural equation modeling (PLS-SEM) methods. The results reveal that Behavioral Inten-
tion strongly influences Use Behavior, driven by Performance Expectancy and Social Influence, while Effort
Expectancy and Facilitating Conditions have minimal impact. Teachers are more likely to adopt AI if it im-
proves job performance, engages students, or reduces workload. Positive attitudes are key factors, as intention
strongly predicts adoption, and teachers prioritize the benefits of AI over ease of use.
1 INTRODUCTION
Emerging Technologies (ETs) can positively impact
the economy, society, and work-life dynamics. As
ETs evolve, understanding user acceptance has be-
come essential. Several models, such as the Tech-
nology Acceptance Model (TAM), Theory of Planned
Behavior (TPB), and Unified Theory of Acceptance
and Use of Technology (UTAUT), have been de-
veloped to explain this acceptance (Davis, 1989;
Venkatesh et al., 2003).
Among these models, UTAUT is widely recog-
nized as the most successful model for technology
adoption (Marikyan and Papagiannidis, 2021). It has
been used in various domains, including:
• Economics: e-commerce, mobile banking, and
business apps.
• Healthcare: electronic health records,
telemedicine.
• Education: e-learning platforms, online teach-
ing (Abbad, 2021; Almaiah et al., 2019; Grani
´
c,
a
https://orcid.org/0000-0002-3597-7052
b
https://orcid.org/0000-0003-3135-1244
c
https://orcid.org/0000-0002-0626-9284
2022; Marques et al., 2010; Raffaghelli et al.,
2022; Xue et al., 2024).
• Public Sector: e-government services and digital
applications.
The goal of this paper is to assess UTAUT’s appli-
cability to the use of ETs in Romania’s educational
system. Despite strong international performance,
Romania faces challenges in national assessments and
OECD PISA scores, highlighting areas for improve-
ment in education (EU Education and Training Mon-
itor 2023).
This study introduces a novel questionnaire with
17 items to assess ETs acceptance in Romania’s edu-
cation sector. It applies the UTAUT model to analyze
the data and validates the results using PLS-SEM.
Our paper has the following structure: in Section
2, we describe the growing need for novel technolo-
gies in education and the challenges of their imple-
mentation. Following this introduction, in Section 3
we describe our proposed research methodology that
includes the outline of the UTAUT model, the de-
signed questionnaire, data collection and sample char-
acteristics. We validate the proposed model in Sec-
tion 4 using the PLS-SEM method and present the
Pop Sitar, C., Hajdu M
ˇ
acelaru, M. and Pop, P.
Emerging Technologies Acceptance Within the Romanian Educational System: A Case Study Using the UTAUT Model.
DOI: 10.5220/0013198700003932
In Proceedings of the 17th International Conference on Computer Supported Education (CSEDU 2025) - Volume 1, pages 191-198
ISBN: 978-989-758-746-7; ISSN: 2184-5026
Copyright © 2025 by Paper published under CC license (CC BY-NC-ND 4.0)
191

obtained results and their analysis. The paper ends
with some conclusions presented in Section 5.
2 THE GROWING NEED FOR
NEW TECHNOLOGIES IN
EDUCATION
Over the last years, the technologies have revolution-
ized also the educational system, improving teaching
and learning. Nowadays, it is essentials for schools
and universities to be up to date and integrate the lat-
est discoveries and digital tools in their educational
system. Educational games, video conferences, e-
learning platforms are now essential to be used in the
present educational system.
ETs like Artificial Intelligence (AI), virtual reality,
chatbots, metaverse, etc., have the potential to trans-
form the way students learn and collaborate with their
professors and with each other. The primary benefit of
AI and metaverse is reinforcement learning by iden-
tifying knowledge gaps and suggesting personalized
learning paths to improve the educational outcomes,
see for further information (Chiu, 2023).
We do believe that the true potential of ETs lie
not just in making learning more efficient, but in their
capacity to craft highly personalized educational ex-
periences. The main challenge is how to incorporate
these ETs in a way that take into consideration the
diversity of students’ abilities and needs.
2.1 Examples of ETs in Education
In today’s evolving world, professors and students
face various career challenges, and Educational Tech-
nologies (ETs) can help improve critical thinking,
problem-solving, and essential competencies for suc-
cess.
ETs can greatly enhance the education system
by improving both research and learning processes.
Key benefits include: improved performance for stu-
dents and professors, personalized learning, time sav-
ings and increased efficiency, development of digi-
tal skills, trans-disciplinary learning, connecting con-
cepts across disciplines.
Prominent ETs in education include:
• AI: Transforms teaching and accelerates learning.
• Metaverse, VR, AR: Enable ”learn by doing” and
simulate real-life scenarios.
• Gamification: Incorporates game elements to in-
crease engagement (Smiderle et al., 2020).
• Adaptive Learning: Personalizes content based on
individual needs.
• Online Courses/Live Streaming: Provide flexible
and affordable learning options.
• Robotics: Offers hands-on STEM learning
through educational robots.
2.2 The Challenges of Implementing
ETs in Education
Implementing emerging technologies (ETs) in educa-
tion presents both opportunities and challenges. ETs
can transform teaching and learning, foster innova-
tion, enhance access to information, and equip stu-
dents with essential technological skills for the future
workforce.
However, we need more studies to understand how
to balance the benefits and risks of using ETs in the
education system and how we can design more effec-
tive the teaching and learning process without any risk
on the student development and academic integrity.
3 THE PROPOSED RESEARCH
METHODOLOGY
3.1 Description of the UTAUT Model
In our paper, we use the Unified Theory of Accep-
tance and Use of Technology (UTAUT) model to
investigate the factors influencing the adoption of
artificial intelligence (AI) technology in education.
UTAUT is a theoretical framework intended to ex-
plain the user intentions regarding the utilization of
an information system and subsequent usage behav-
ior. It integrates elements from multiple models re-
lated to technology acceptance and use.
The key components of the UTAUT model are:
• Performance Expectancy (PE). The degree to
which a person trusts that using the system will
improve his job performance.
• Effort Expectancy (EE). The level of ease asso-
ciated with using the system.
• Social Influence (SI). The degree to which an
individual discerns that significant others believe
they should use the novel system.
• Facilitating Conditions (FC). The degree to
which a person trusts that there is adequate organi-
zational and technical infrastructure to permit the
system usage.
CSEDU 2025 - 17th International Conference on Computer Supported Education
192

The influence of core constructs on Behavioral In-
tention and Usage Behavior depends on factors like
Gender, Age, Experience, and Willingness to Use. In
the UTAUT model, Behavioral Intention (BI) reflects
a person’s decision to engage in a future behavior,
while Usage Behavior (UB) denotes the actual system
use.
In Figure 1, we illustrate graphically the UTAUT
model as described by Venkatesh et al. [13].
3.2 The Designed Questionnaire
To evaluate the variables in the UTAUT framework,
we used a questionnaire with 17 items, presented in
Table 1. Each item was evaluated using a rating be-
tween one and five, where one represented ”not at
all” and five represented ”extremely.” The respon-
dents were motivated to base their evaluations on their
own knowledge and experience.
The chosen constructs in this investigation form
the foundation for the considered hypotheses, which
are subsequently outlined below:
H1: Performance expectancy (PE) has a positive im-
pact on the behavioral intention to use AI tech-
nologies in their educational work.
H2: Effort expectancy (EE) has a positive impact on
the behavioral intention to use AI technologies
in their educational work.
H3: Social Influence (SI) positively influences the
behavioral intention to use AI technologies in
their educational work.
H4: Facilitation condition (FC) has a positive effect
on the behavioral intention to use AI technolo-
gies in their educational work.
H5: Behavioral Intentions (BI) positively affects the
behavioral intention to adopt AI technologies in
their educational work.
The survey instrument used to implement the
questionnaire from this study is Microsoft Forms. The
questionnaire was then disseminated across various
social media platforms and educational groups. Par-
ticipants were encouraged to share the questionnaire
link within their networks. During a one-week period,
the questionnaire-based investigation gathered a total
of 187 valid responses.
The survey participants were predominantly fe-
male (74%), and all the respondents were Romanian,
working in the education sector. Most of the respon-
dents were teachers (93%), with 38% being college
teachers, 37% high school teachers, and 18% univer-
sity instructors. Regarding educational qualifications,
43% of the participants have a Ph.D. degree, 31% of
them have a Master’s degree, and the rest 26% have a
Bachelor’s degree. In terms of age, 43% of the partic-
ipants were between 46-55 years old, 28% were be-
tween 36-45 years old, 9% were between 26-35 years
old, and 5% were between 20-25 years old.
Table 2 summarizes the demographic details of the
respondents.
4 THE ACHIEVED RESULTS AND
THEIR ANALYSIS
To assess the validity the proposed model, we eployed
the Partial Least Squares Structural Equation Model-
ing (PLS-SEM) method, which is an extremely valu-
able method for assessing complex theoretical rela-
tionships among multiple variables. For further infor-
mation concerning the PLS-SEM method we refer to
(Hair and Alamer, 2022). Using SmartPLS 4.0 soft-
ware, the data collected from the survey underwent
PLS-SEM analysis to evaluate the model and test the
hypotheses.
Applying PLS-SEM to the UTAUT model in-
volves specifying the structural and measurement
models, estimating the models iteratively, assessing
their validity and reliability, performing bootstrap-
ping to test significance, and interpreting the results.
This approach helps in understanding the factors in-
fluencing technology acceptance and use, providing
insights into how constructs like performance ex-
pectancy, effort expectancy, social influence, and fa-
cilitating conditions influence behavioural intention
and use behaviour.
Prior to analysing the measurement model, we
examined the mean, median, standard deviation, ex-
cess kurtosis, and skewness of the observed variables.
These values are illustrated in Table 3.
The mean is the average of a data set, representing
its central point. In UTAUT models, it reflects over-
all respondent tendencies, such as perceptions of per-
formance or effort expectancy, helping to understand
general attitudes toward technology adoption.
The median is the middle value when data is or-
dered. In UTAUT, it shows typical opinions about
technology adoption factors when data is not uni-
formly distributed.
Standard deviation indicates the spread of data
around the mean. Low values show consistency, while
high values indicate varied opinions. In UTAUT, this
helps assess agreement on technology perceptions.
Excess kurtosis measures the ”tailedness” of a dis-
tribution. Positive values indicate extreme responses,
while negative values suggest uniformity. In UTAUT,
it highlights concentration or extremes in responses.
Emerging Technologies Acceptance Within the Romanian Educational System: A Case Study Using the UTAUT Model
193
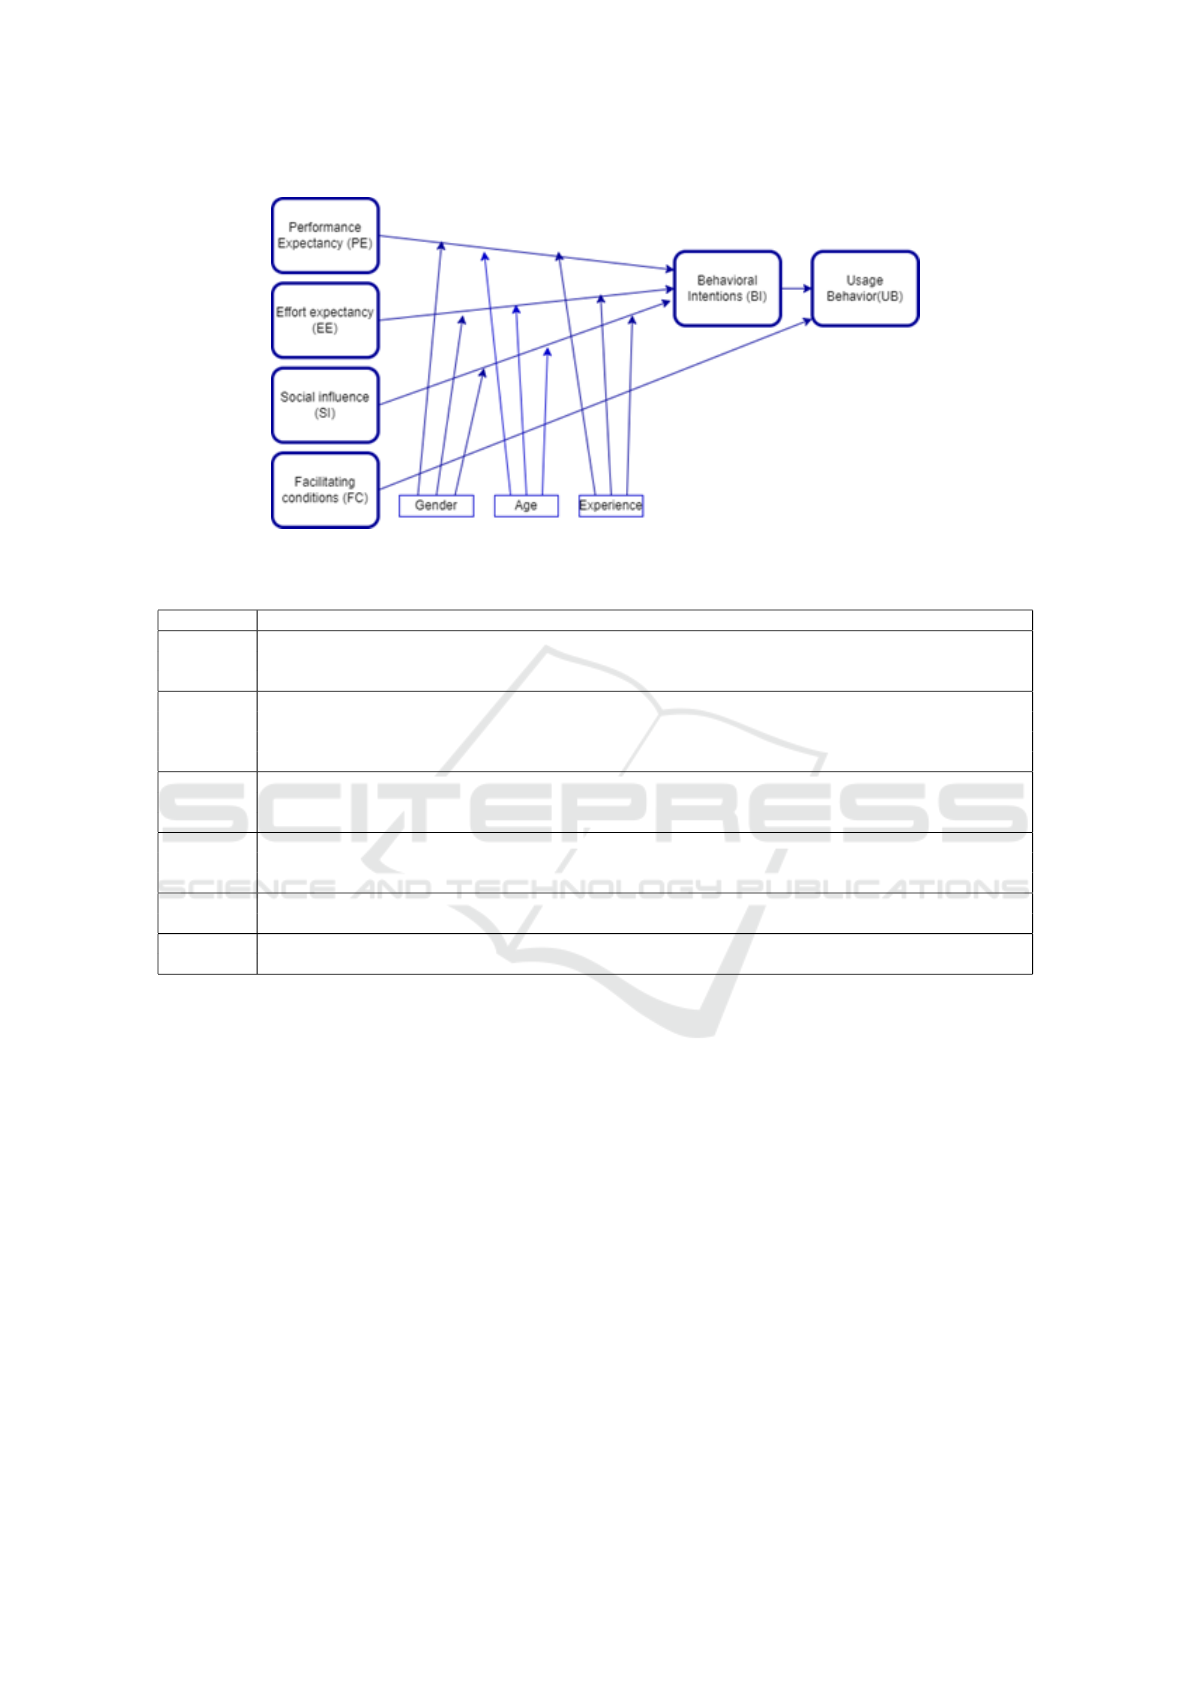
Figure 1: Illustration of the UTAUT model (Venkatesh et al., 2003).
Table 1: Constructs and measurements items.
Item code Item description
PE PE1: Use of AI technologies will help to complete the lessons and tests for the class faster.
PE2: Use of AI technologies will help to teach more effectively in the classroom.
PE3: Use of AI technologies will make students learn more effectively.
EE EE1: Learning how to use AI technologies will be easy.
EE2: To integrate AI technologies into the teaching process will be easy.
EE3: To integrate AI technologies into the student’s evaluation process will be easy.
EE4: To integrate AI technologies into the preparation of lessons and tests in class will be easy.
SI SI1: There is a pressure to adopt AI technologies into the teaching process.
SI2: There is a pressure to adopt AI technologies into the student evaluation process.
SI3: There is a pressure to adopt AI technology into the class hours.
FC FC1: I believe that the education system provide good support to be able to adopt the AI technologies.
FC2: There are necessary resources (materials, tools) available to integrate AI technologies in education.
FC3: There are necessary technical support to be able to use AI technologies in education.
BI BI1: I intend to use AI technologies in the near future.
BI2: I feel comfortable to use AI technologies.
UB UB1: I am familiar with AI technologies.
UB2: I am using AI technologies in my work.
Skewness shows distribution asymmetry. Positive
skewness means most responses are favorable, while
negative skewness reflects unfavorable clustering. In
UTAUT, this helps identify response biases.
These measures provide insights into perceptions
in UTAUT models, aiding understanding of technol-
ogy adoption. The achieved results revealed mean
scores ranging from 2.578 to 3.364 and standard de-
viations ranging from 0.765 to 1.097, suggesting re-
spondents found AI moderately easy to use.
In PLS-SEM, discriminant validity ensures con-
structs are distinct, confirming factors like perfor-
mance expectancy and social influence measure dif-
ferent aspects of technology adoption.
To assess the discriminant validity in PLS-SEM,
we used the Fornell & Larcker Criterion, as shown in
Table 4. This criterion implies comparing the square
root of the Average Variance Extracted (AVE) for ev-
ery construct with the correlations between that con-
struct and the other constructs within the model. The
discriminant validity is supported if the square root of
the AVE for each construct is greater than its correla-
tions with other constructs.
The Fornell & Larcker Criterion evaluates two key
aspects: how well each concept (represented by the
diagonal values in the table) explains itself, and how
much each concept correlates with the others (repre-
sented by the off-diagonal values). The diagonal val-
ues in the table show how well each concept measures
itself, and all of these values are higher than 0.7. This
is a good indication that each concept is explained
well by its own indicators, meaning the model is mea-
suring each concept accurately. This is an important
step in confirming the validity of the model.
To confirm discriminant validity, the diagonal val-
ues should be higher than the correlations between
different concepts. Effort Expectancy (EE), Facili-
tating Conditions (FC), and Performance Expectancy
CSEDU 2025 - 17th International Conference on Computer Supported Education
194

Table 2: Demographic details of the respondents (N=187).
Category Sub-category Frequency Percent
Gender Female 138 74
Male 49 26
Age 20-25 9 5
26-35 17 9
36-45 52 28
46-55 80 43
≥ 56 33 18
Education Bachelor’s degree 58 26
level Master’s degree 80 31
Ph.D. 48 43
Other 1
Role High school teacher 69 37
College teacher 71 38
University teacher 34 18
Other 13 7
ET Usage Not at all 0 0
Slightly 7 4
Moderately 43 23
Very much 99 53
Extremely 38 20
Table 3: Data for AI adoption using UTAUT.
Item Mean Median Standard Excess Skewness
code deviation kurtosis
PE1 3.364 3 0.893 0.171 -0.422
PE2 3.294 3 0.904 0.162 -0.311
PE3 3.246 3 0.933 -0.012 -0.271
EE1 3.123 3 0.808 0.609 0.2
EE2 3.043 3 0.773 0.693 -0.004
EE3 3.053 3 0.765 0.38 0.125
EE4 3.011 3 0.781 0.403 0.117
SI1 2.578 3 1.023 -0.564 0.076
SI2 2.594 3 1.052 -0.7 0.014
SI3 3.048 3 1.046 -0.578 -0.295
FC1 2.861 3 1.025 -0.579 -0.048
FC2 3.043 3 0.912 -0.168 -0.213
FC3 3.048 3 1.015 -0.392 -0.283
BI1 3.267 3 0.966 0.208 -0.452
BI2 2.337 2 1.089 -0.299 0.55
USE1 2.989 3 0.931 -0.02 -0.019
USE2 2.642 3 1.097 -0.621 0.112
(PE) clearly show distinct validity, as their diagonal
values are significantly higher than their correlations
with other concepts. For Behavioral Intention (BI),
which has a diagonal value of 0.880, its highest cor-
relation is with USE at 0.908. While these values are
quite close, this overlap is both expected and accept-
able, particularly in models where BI (intentions to
use) and USE (actual use) are naturally linked. Given
their close relationship in technology adoption mod-
els, this slight overlap between BI and USE is per-
fectly normal and understandable.
The model is valid based on the Fornell & Larcker
Criterion, as most diagonal values are higher than the
off-diagonal correlations, confirming discriminant va-
lidity. This means that the model successfully differ-
Table 4: Fornell & Larcker Criterion analysis for checking
Discriminant validity.
BI EE FC PE SI USE
BI 0.880
EE 0.217 0.835
FC 0.483 0.186 0.860
PE 0.549 0.186 0.488 0.934
SI 0.365 0.427 0.314 0.351 0.882
USE 0.908 0.176 0.453 0.458 0.372 0.924
entiates between the various concepts, ensuring that
they are distinct from one another.
The path coefficients represent the relationships
between latent constructs in the structural model.
These coefficients indicate the strength and direction
of the relationships.
In Figure 2, we illustrate the path coefficients,
outer loadings and the coefficient of determination R
2
for each variable in the respective structural models.
Assessing the measurement model in PLS-SEM
relies significantly on outer loadings, which indicate
the strength of relationships between indicators and
their respective constructs, thereby ensuring the con-
struct’s validity and reliability.
In Table 5, we present the outer loading values
received along with their interpretations. Indicators
with outer loadings equal to or exceeding 0.7 are
deemed to exhibit robust associations with their cor-
responding constructs, signifying their reliability in
measuring the construct and substantial contribution
to its variance. Loadings falling within the range of
0.4 to 0.7 are considered acceptable but may suggest
the necessity for further refinement, indicating that
while these indicators contribute to the construct, they
may benefit from additional indicators or reassess-
ment to enhance their reliability. Notably, all the ob-
tained results demonstrate high loading values, except
for EE1 ← EE, which displays a moderate value.
Table 5: Outer loadings value.
Outer loadings value
USE1 ← USE 0.924
USE2 ← USE 0.924
BI1 ← BI 0.880
BI2 ← BI 0.880
EE1 ← EE 0.590
EE2 ← EE 0.889
EE3 ← EE 0.913
EE4 ← EE 0.905
FC1 ← FC 0.760
FC2 ← FC 0.910
FC3 ← FC 0.902
PE1 ← PE 0.934
PE2 ← PE 0.936
PE3 ← PE 0.932
SI1 ← SI 0.934
SI2 ← SI 0.916
SI3 ← SI 0.789
Emerging Technologies Acceptance Within the Romanian Educational System: A Case Study Using the UTAUT Model
195
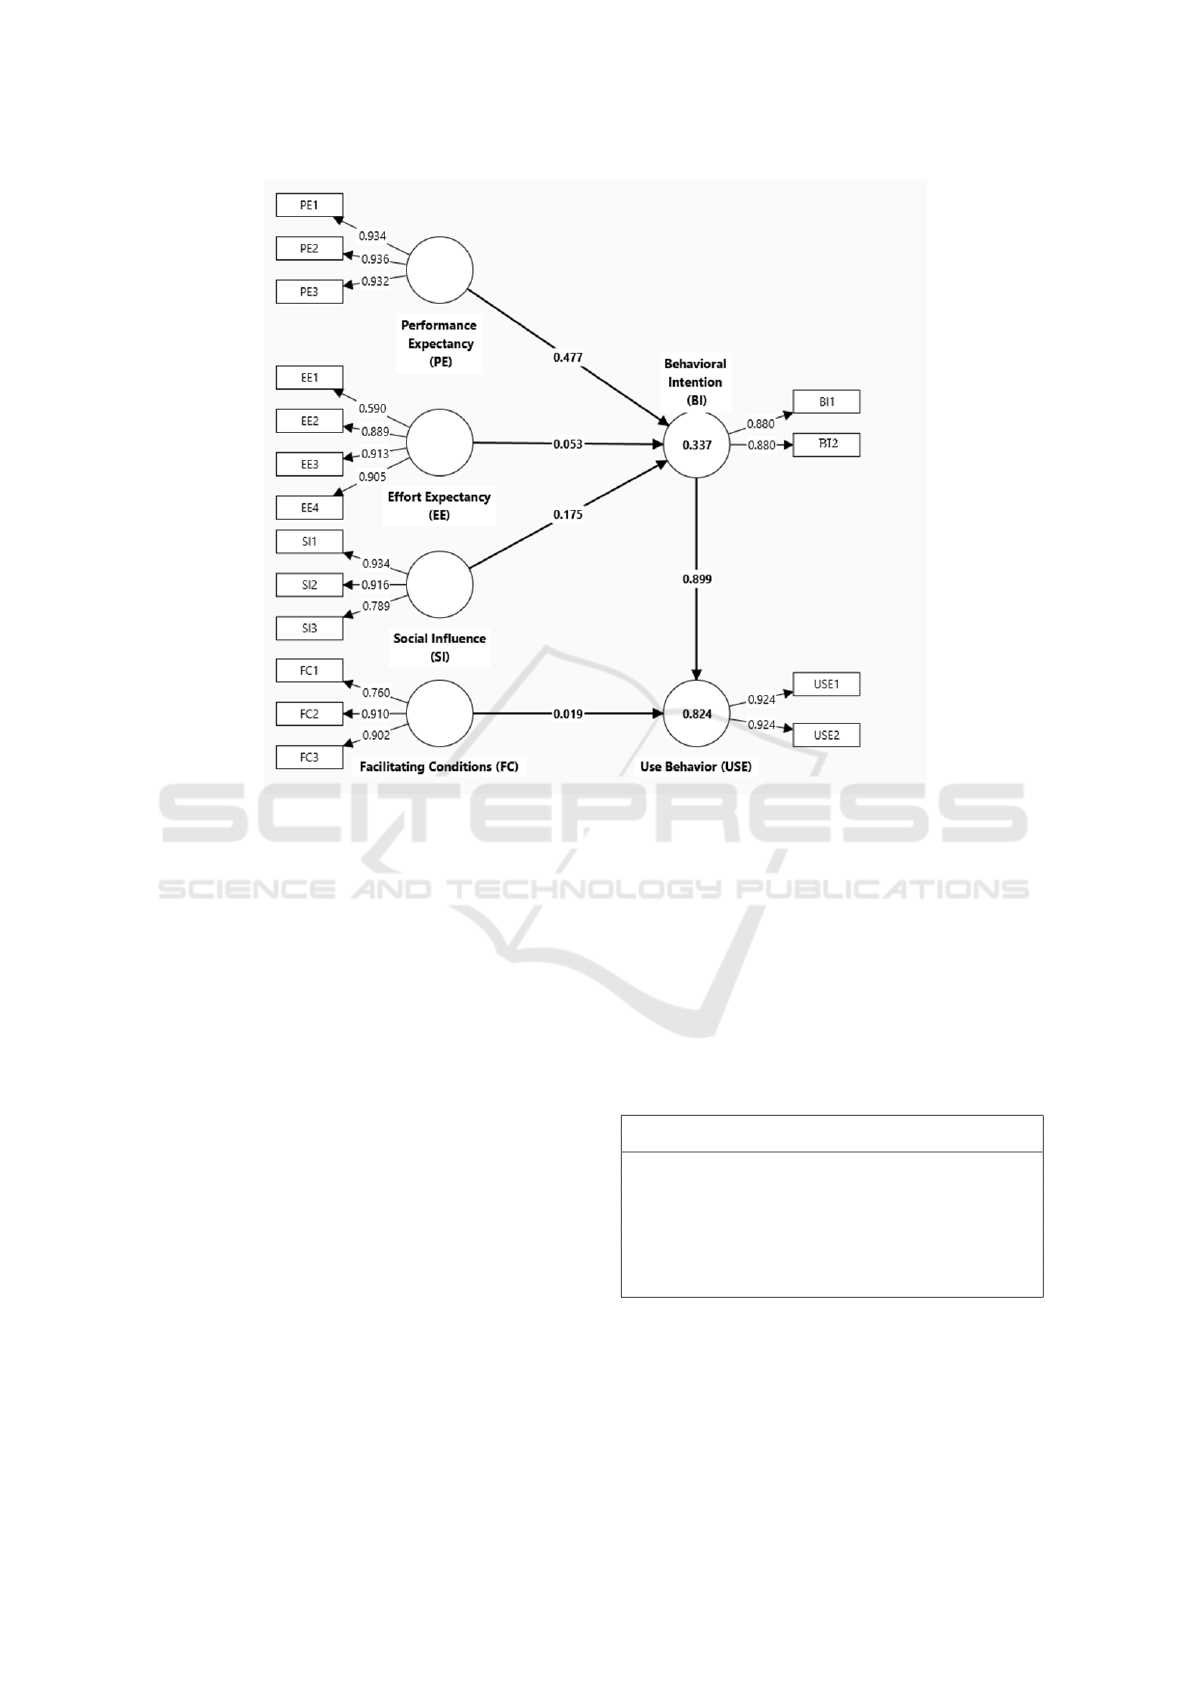
Figure 2: UTAUT model: outer loadings, path coefficients and R
2
.
In the context of UTAUT, the total effects can help
understand the comprehensive influence of each con-
struct on users’ behavioral intentions and use behav-
ior. Table 6 presents key statistics (path coefficients,
standard deviations, t-statistic, and p-values) from our
study that examines how different factors influence
the adoption of AI technologies in education. The re-
sults reveal the following key insights:
• The relationship between Behavioral Intention
and Use Behavior is strong and highly significant
(0.899, p < 0.001), indicating that teachers with
high intentions are likely to use AI technologies.
• Performance Expectancy has a significant positive
effect on both Behavioral Intention (0.477, p <
0.001) and Use Behavior (0.429, p < 0.001). This
shows that the perceived usefulness of AI tools is
crucial for adoption.
• Social Influence moderately affects Behavioral
Intention (0.175, p < 0.05) and Use Behavior
(0.157, p < 0.05), suggesting that social expec-
tations play a role, though to a lesser degree.
• Effort Expectancy and Facilitating Conditions
have weak or non-significant effects, with paths
such as EE → BI (0.053, p = 0.483) and FC →
USE (0.019, p = 0.594) indicating minimal influ-
ence. Teachers’ ease of use or available resources
are less decisive factors in their decisions.
The findings suggest that promoting AI technolo-
gies among educators should prioritize enhancing be-
havioral intentions and emphasizing practical bene-
fits, as these significantly influence usage. While ease
of use and support systems are less critical, the role of
intention and perceived value aligns with the UTAUT
framework, emphasizing behavioral intention as a key
driver.
Table 6: Total effects.
Original Sample Standard t-statistic P-values
sample mean deviation
BI → USE 0.899 0.898 0.020 44.809 0.000
EE → BI 0.053 0.053 0.076 0.702 0.483
EE → USE 0.048 0.047 0.068 0.704 0.481
FC → U SE 0.019 0.018 0.036 0.533 0.594
PE → BI 0.477 0.475 0.081 5.905 0.000
PE → USE 0.429 0.428 0.076 5.638 0.000
SI → BI 0.175 0.174 0.085 2.058 0.040
SI → U SE 0.157 0.156 0.076 2.066 0.039
Our results indicate that teachers’ intentions to use
AI technologies in education are strongly influenced
by their behavioral intentions. Other factors, such as
ease of use and facilitating conditions, have less im-
pact on their decisions. The strong confidence in the
relationship between intention and actual use suggests
CSEDU 2025 - 17th International Conference on Computer Supported Education
196
that promoting AI tools among teachers will likely be
effective, provided they are motivated to engage with
the technology.
Collinearity statistics, specifically the Variance In-
flation Factor (VIF), are used to assess how much
the variance of a regression coefficient is increased
due to collinearity with other predictors in the model.
The Variance Inflation Factor (VIF) helps determine
whether two or more independent variables in a re-
gression model are too closely related to each other.
When VIF values are low, it suggests that there is lit-
tle overlap between the variables, indicating that each
variable provides unique information to the model.
In our research, the VIF values range from 1.143
to 1.349, indicating an acceptable level of indepen-
dence among the variables. A common rule of thumb
is that a VIF value greater than 5 or 10 may indicate
problematic collinearity. Since all the VIF values in
this table are below those thresholds, it suggests that
the constructs in the model, such as Behavioral In-
tention, Use, Effort Expectancy, Facilitating Condi-
tions, Performance Expectancy, and Social Influence,
are not highly collinear. This means each variable
contributes valuable and distinct information to the
model, allowing for more reliable analysis of their re-
lationships and impacts.
Table 7: Collinearity statistics (VIF).
Collinearity statistics (VIF)
BI ← USE 1.304
EE ← BI 1.225
FC ← U SE 1.304
PE ← BI 1.143
SI ← BI 1.349
Analyzing the obtained values presented in Table
7, we can conclude that the relationships between the
model’s constructs are clear, independent, and reli-
ably estimated. This ensures that the model offers
valid insights into the factors that influence users’ ac-
ceptance and use of technology, facilitating informed
decision-making and effective intervention strategies.
In Table 8, we displayed the convergent validity
and the reliability of the constructs and their measur-
ing items.
Table 8: Convergent validity and reliability of constructs
and their measuring items
Cronbach’s Composite Composite Average variance
alpha reliability reliability extracted (AVE)
BI 0.710 0.710 0.873 0.775
EE 0.846 0.880 0.900 0.698
FC 0.820 0.834 0.894 0.739
PE 0.927 0.927 0.954 0.873
SI 0.854 0.866 0.913 0.778
USE 0.829 0.829 0.921 0.854
As shown in Table 8, all constructs exhibit strong
internal consistency and reliability, with acceptable
to excellent values for Cronbach’s alpha and com-
posite reliability. Additionally, good convergent
validity confirms that the items effectively capture
their intended constructs, supporting the measure-
ment model’s validity and reliability.
In Table 9, we present the confidence intervals.
Drawing from the interpretations of all the results
thus far and considering the values of the confidence
intervals, we can determine whether the formulated
hypotheses are supported or not:
H1. With a path coefficient of 0.477 and a 95% con-
fidence interval from 0.303 to 0.618 (excluding
zero), there is a statistically significant link be-
tween Performance Expectancy and Behavioral
Intention. Our findings confirm that believing AI
improves educational performance strongly cor-
relates with the intention to use it.
H2. With a path coefficient of 0.053 and a 95% con-
fidence interval from -0.104 to 0.194 (including
zero), there is no statistically significant link be-
tween Effort Expectancy and Behavioral Inten-
tion. While ease of use might encourage trying
AI, the results show no significant connection,
and the hypothesis is not supported.
H3. The path coefficient for Social Influence and Be-
havioral Intention is 0.175, with a 95% confi-
dence interval from 0.011 to 0.347 (excluding
zero), indicating statistical significance. Results
confirm that encouragement from others posi-
tively influences the intention to use AI, support-
ing this hypothesis.
H4. The path coefficient for Facilitating Conditions
and Use Behavior is 0.019, with a 95% confi-
dence interval from -0.053 to 0.087 (including
zero), indicating no statistical significance. Re-
sults show that resources and support do not sig-
nificantly influence AI use, so this hypothesis is
not supported.
H5. The path coefficient for Behavioral Intention and
Use Behavior is 0.899, with a 95% confidence
interval of 0.856 to 0.936 (excluding zero), indi-
cating a statistically significant relationship. The
strong link shows that intention strongly predicts
actual AI use, supporting this hypothesis.
5 CONCLUSIONS
Using the UTAUT model analyzed through PLS-SEM
in SmartPLS, we can assess the adoption of AI tech-
nologies in education. By evaluating constructs like
Emerging Technologies Acceptance Within the Romanian Educational System: A Case Study Using the UTAUT Model
197

Table 9: Confidence intervals.
HYPOTHESIS Original Sample Bias 2.5% 97.5% Decision
sample mean
H1 0.477 0.475 -0.002 0.303 0.618 SUPPORTED
H2 0.053 0.053 -0.000 -0.104 0.194 NOT SUPPORTED
H3 0.175 0.174 -0.001 0.011 0.347 SUPPORTED
H4 0.019 0.018 -0.001 -0.053 0.087 NOT SUPPORTED
H5 0.899 0.898 -0.000 0.856 0.936 SUPPORTED
Performance Expectancy, Effort Expectancy, Social
Influence, and Behavioral Intention, we gain insights
into the factors impacting the acceptance and utiliza-
tion of AI technologies in educational settings. The
analysis provides a comprehensive understanding of
the attitudes, perceptions, and intentions of educa-
tors and students towards AI integration in education.
By validating hypotheses and interpreting path coeffi-
cients, we can ascertain the significance of these fac-
tors in driving the adoption of AI technologies. Ulti-
mately, this analytical approach enables us to draw
conclusions about the readiness and propensity of
educational stakeholders to embrace AI innovations,
thereby informing strategies for successful implemen-
tation and integration of AI technologies in educa-
tional practices.
In conclusion, the UTAUT model highlights Be-
havioral Intention as a strong predictor of Use Be-
havior, driven mainly by Performance Expectancy
and Social Influence. Effort Expectancy and Facil-
itating Conditions show no significant impact. The
significant indirect effect of Performance Expectancy
on Use Behavior underscores the importance of per-
ceived performance benefits.
Teachers are more likely to adopt AI if they be-
lieve it enhances job performance, such as making
lessons engaging or reducing workload. Clear ben-
efits are essential for AI adoption in education.
Another important finding is that when teachers
express a desire or intention to use AI, they are very
likely to actually use it. This shows that developing a
positive attitude toward AI early on is key because
once teachers decide they want to use it, they will
probably follow through.
Social pressure from colleagues or administrators
has some influence but isn’t as important. While it
can help to have others around them encouraging AI
use, teachers are mostly driven by their own beliefs
about the technology’s benefits.
Finally, having access to resources and support
does not strongly affect teachers’ decision to adopt
AI. While it helps, what really matters is whether
teachers see value in using AI. Schools should focus
more on showing the practical benefits of AI rather
than just providing resources.
REFERENCES
Abbad, M. M. (2021). Using the utaut model to understand
students’ usage of e-learning systems in developing
countries. Education and information technologies,
26(6):7205–7224.
Almaiah, M. A., Alamri, M. M., and Al-Rahmi, W. (2019).
Applying the utaut model to explain the students’ ac-
ceptance of mobile learning system in higher educa-
tion. Ieee Access, 7:174673–174686.
Chiu, T. K. (2023). The impact of generative ai (genai) on
practices, policies and research direction in education:
A case of chatgpt and midjourney. Interactive Learn-
ing Environments, pages 1–17.
Davis, F. D. (1989). Perceived usefulness, perceived ease of
use, and user acceptance of information technology.
MIS quarterly, pages 319–340.
Grani
´
c, A. (2022). Educational technology adoption: A sys-
tematic review. Education and Information Technolo-
gies, 27(7):9725–9744.
Hair, J. and Alamer, A. (2022). Partial least squares struc-
tural equation modeling (pls-sem) in second language
and education research: Guidelines using an applied
example. Research Methods in Applied Linguistics,
1(3):100027.
Marikyan, M. and Papagiannidis, P. (2021). Unified the-
ory of acceptance and use of technology. TheoryHub
book.
Marques, B., Villate, J., and Carvalho, C. V. (2010). Tech-
nology acceptance on higher education: The case of
an engineer’s school. In ICERI2010 Proceedings,
pages 5094–5102. IATED.
Raffaghelli, J. E., Rodr
´
ıguez, M. E., Guerrero-Rold
´
an, A.-
E., and Ba
˜
neres, D. (2022). Applying the utaut model
to explain the students’ acceptance of an early warning
system in higher education. Computers & Education,
182:104468.
Smiderle, R., Rigo, S. J., Marques, L. B., Pec¸anha de Mi-
randa Coelho, J. A., and Jaques, P. A. (2020). The
impact of gamification on students’ learning, engage-
ment and behavior based on their personality traits.
Smart Learning Environments, 7(1):3.
Venkatesh, V., Morris, M. G., Davis, G. B., and Davis, F. D.
(2003). User acceptance of information technology:
Toward a unified view. MIS quarterly, pages 425–478.
Xue, L., Rashid, A. M., and Ouyang, S. (2024). The unified
theory of acceptance and use of technology (utaut) in
higher education: A systematic review. SAGE Open,
14(1):21582440241229570.
CSEDU 2025 - 17th International Conference on Computer Supported Education
198
