
Evaluating Explainable AI for Deep Learning-Based Network Intrusion
Detection System Alert Classification
Rajesh Kalakoti
1 a
, Risto Vaarandi
1 b
, Hayretdin Bahs¸i
1,2 c
and Sven N
˜
omm
1 d
1
Department of Software Science, Tallinn University of Technology, Tallinn, Estonia
2
School of Informatics, Computing, and Cyber Systems, Northern Arizona University, U.S.A.
Keywords:
Network Intrusion Detection System, NIDS Alerts, SOC, Evaluation of Explainability.
Abstract:
A Network Intrusion Detection System (NIDS) monitors networks for cyber attacks and other unwanted activ-
ities. However, NIDS solutions often generate an overwhelming number of alerts daily, making it challenging
for analysts to prioritize high-priority threats. While deep learning models promise to automate the prioriti-
zation of NIDS alerts, the lack of transparency in these models can undermine trust in their decision-making.
This study highlights the critical need for explainable artificial intelligence (XAI) in NIDS alert classification
to improve trust and interpretability. We employed a real-world NIDS alert dataset from Security Opera-
tions Center (SOC) of TalTech (Tallinn University Of Technology) in Estonia, developing a Long Short-Term
Memory (LSTM) model to prioritize alerts. To explain the LSTM model’s alert prioritization decisions, we
implemented and compared four XAI methods: Local Interpretable Model-Agnostic Explanations (LIME),
SHapley Additive exPlanations (SHAP), Integrated Gradients, and DeepLIFT. The quality of these XAI meth-
ods was assessed using a comprehensive framework that evaluated faithfulness, complexity, robustness, and
reliability. Our results demonstrate that DeepLIFT consistently outperformed the other XAI methods, pro-
viding explanations with high faithfulness, low complexity, robust performance, and strong reliability. In
collaboration with SOC analysts, we identified key features essential for effective alert classification. The
strong alignment between these analyst-identified features and those obtained by the XAI methods validates
their effectiveness and enhances the practical applicability of our approach.
1 INTRODUCTION
Many organizations use open-source (e.g., Suricata
and Snort) or commercial (e.g., Cisco NGIPS) NIDS
platforms to identify malicious network traffic (Day
and Burns, 2011). Most widely used NIDS platforms
use human-created signatures to identify malicious
network traffic. However, this often results in many
alerts, with only a tiny fraction deserving closer at-
tention from security analysts (Jyothsna et al., 2011).
In a typical SOC operation, security analysts an-
alyze the alerts based on their impact on the secu-
rity of the organizational assets and categorize them
as high or low priority. At this stage, analysts also
identify the false positives that are benign system ac-
tivities but are flagged as alerts by NIDS. Security
a
https://orcid.org/0000-0001-7390-8034
b
https://orcid.org/0000-0001-7781-5863
c
https://orcid.org/0000-0001-8882-4095
d
https://orcid.org/0000-0001-5571-1692
analysts find it challenging to identify high-priority
alerts (Jyothsna et al., 2011). Machine learning (ML)
Deep Learning (DL) methods constitute a signifi-
cant solution to automatize these prioritization tasks
and, thus, reduce SOC workloads, especially in the
lower-tier levels of security monitoring and incident
handling processes in the related literature, with ap-
proaches divided into supervised, unsupervised, and
semi-automated methods (Vaarandi, 2021; Vaarandi
and M
¨
ases, 2022; Kalakoti et al., 2022). However, the
explainability or interpretability of ML models arises
as a significant concern in alert prioritization despite
their significant contribution.
Explainable Artificial Intelligence (XAI or Ex-
plainable AI) is necessary for experts to verify alert
classifications and for industries to comply with reg-
ulations (Goodman and Flaxman, 2017). In cyberse-
curity, it’s vital to explain flagged network activities
as potential threats. XAI helps meet compliance stan-
dards and improve systems by clarifying NIDS alert
classifications and identifying crucial features for data
Kalakoti, R., Vaarandi, R., Bah¸si, H. and Nõmm, S.
Evaluating Explainable AI for Deep Learning-Based Network Intrusion Detection System Alert Classification.
DOI: 10.5220/0013180700003899
In Proceedings of the 11th International Conference on Information Systems Security and Privacy (ICISSP 2025) - Volume 1, pages 47-58
ISBN: 978-989-758-735-1; ISSN: 2184-4356
Copyright © 2025 by Paper published under CC license (CC BY-NC-ND 4.0)
47

collection. In the event of a security breach, XAI of-
fers valuable insights for forensic analysis, helping to
understand why specific alerts were or were not trig-
gered, which is crucial in reconstructing the timeline
and nature of an attack (Alam and Altiparmak, 2024).
NIDS usually struggles with high false positive rates.
XAI can enable security analysts to understand why
particular benign activities are mistakenly flagged as
threats, enabling more transparent system tuning and
reducing false alarms (Moustafa et al., 2023).
Explainable AI (XAI) methods address the model
opacity problem through various global and local ex-
planation methods (Rawal et al., 2021). Several stud-
ies have studied explainable AI methods in intrusion
detection (Alam and Altiparmak, 2024; Szczepa
´
nski
et al., 2020; Senevirathna et al., 2024; Moustafa et al.,
2023). However, it is crucial to note that these stud-
ies did not comprehensively evaluate Explainable AI
methods under various intrusion datasets and miscel-
laneous sets of Black box nature of AI models. This
lack of comprehensive evaluation significantly affects
the generality of such methods, highlighting the ur-
gent need for further research in this area. Although
XAI-based IDS tools are expected to be an integral
part of network security to help security analysts in
SOCs to enhance the efficiency and precise in net-
work defence and threat mitigation, a key challenge of
deploying XAI-Based model into network intrusion
detection is assessing such tools, testing their quality,
and evaluating the relevant security metrics. These
challenges undermine the trust in using the XAI-IDS
model for real-world deployment in network IDS sys-
tems.
In this paper, we propose a Long Short-Term
Memory (LSTM) model for NIDS alert prioritiza-
tion to improve transparency and Reliability. This
study evaluates various XAI methods to bridge the
gap between the high accuracy of complex ML mod-
els and the need for transparent, explainable decision-
making in the cybersecurity problem domain. Ob-
jectives of the study include creating an explainable
LSTM model for NIDS alert classification, compar-
ing four advanced XAI methods, evaluating their per-
formance using comprehensive metrics, and validat-
ing XAI-generated explanations based on four crite-
ria: Faithfulness, Complexity, Robustness, and Relia-
bility.
Faithfulness estimates how accurately the expla-
nation reflects the model’s behaviour, assuring that
the local explanation represents the model’s decision-
making process. Robustness evaluates the stability of
explanations under small input perturbations, which
is vital for building faith in local explanations. Com-
plexity assesses the simplicity of the explanations, as
more detailed explanations are generally more inter-
pretable and valuable for human understanding. Reli-
ability guarantees that the explanations are consistent
with established knowledge, such as the features iden-
tified by SOC analysts in this case.
We propose that explainable AI methods can pro-
vide explanations for the decision-making processes
of the LSTM model, prioritizing NIDS alerts and ul-
timately boosting the trust and usefulness of these
systems. This research particularly examined a real-
world dataset of NIDS alerts using LSTM, interpret-
ing the output decisions made by these models and
evaluating them through both quantitative and quali-
tative (expert) evaluations. This study emphasizes ar-
tificial intelligence (XAI) in high-risk threat detection
settings. Our research offers a perspective to the exist-
ing literature as the aspect of interpretability has not
been explored in relation to the significance of NIDS
alerts. This research suggests that a well-designed
benchmarking study can identify high-performance
detection models that provide high-quality explana-
tions. Therefore, security experts may not need to
sacrifice detection performance over a model for ex-
plainability in the addressed ML studies.
Our paper is structured as follows: Section 2 re-
views related work on NIDS and XAI in NIDS, Sec-
tion 3 outlines our methodology, Section 4 presents
our results and discussions, and Section 5 provides
our conclusions.
2 RELATED WORK
ML and DL have advanced the analysis of NIDS
alerts. This section reviews key contributions in NIDS
alert processing, focusing on classification, cluster-
ing, and explainable AI methods. It delves into stud-
ies addressing challenges such as alert prioritization,
false positive reduction, and interpretable models in
cybersecurity.
(Kidmose et al., 2020) proposed a three-phase
method for NIDS alert classification (Kidmose et al.,
2020). They used an LSTM and latent semantic anal-
ysis to convert textual alerts into vectors, clustered
the vectors using the DBSCAN algorithm, and clas-
sified incoming alerts based on their similarity to the
core points of the clusters. (Van Ede et al., 2022)
developed a semi-automated method for classifying
NIDS alerts and other security events,which involved
detecting and analyzing event sequences using deep
learning models, clustering with the DBSCAN algo-
rithm, and human analysts labeling the resulting clus-
ters (Van Ede et al., 2022). Labeled database was then
used for semi-automated classification of additional
ICISSP 2025 - 11th International Conference on Information Systems Security and Privacy
48

event sequences, with human analysts manually re-
viewing unclustered events.
In a paper(Mane and Rao, 2021), the authors uti-
lized SHAP, LIME, Contrastive Explanations Method
(CEM), ProtoDash, and Boolean Decision Rules via
Column Generation (BRCG) over the NSL-KDD
dataset (Tavallaee et al., 2009) for intrusion detection
system (IDS). They demonstrated the factors that in-
fluence the prediction of cyber-attacks.
(Ban et al., 2023) proposed a method using
an IWSVM-based classifier to detect critical NIDS
alerts. The classifier assigned higher weights to re-
peated data points and the minority class of critical
alerts. A clustering algorithm grouped alerts repre-
senting the same incident based on attributes such
as IP addresses, service ports, and alert occurrence
time. (Shin et al., 2019) developed an organizational
platform using machine learning to analyze NIDS
alert data with support for binary SVM and one-class
SVM methods (Shin et al., 2019). In a paper (Feng
et al., 2017), authors described another organizational
implementation for processing NIDS alerts and other
security events to identify at-risk users. (Wang et al.,
2019) used a graph-based method to eliminate false
alerts and applied GBDT algorithms for alert classi-
fication. (Ban et al., 2021) used a large NIDS dataset
to evaluate seven supervised machine learning meth-
ods (Ban et al., 2021). They found that Weighted
SVM, SVM, and AB (Adaboost) produced the best
results, while two isolation forest-based unsupervised
algorithms provided lower precision than the evalu-
ated supervised algorithms.
It is important to note that a large body of research
is devoted to replacing NIDS with ML-based sys-
tems (Tsai et al., 2009). However, organizations use
signature-based NIDSs due to the wide availability of
this technology and complex SOC processes evolving
around these systems. Thus, prioritizing NIDS alerts
is a significant real-world challenge in SOCs. Vari-
ous research studies have addressed the explainability
of ML-based NIDS systems. However, to our knowl-
edge, the explainability of the ML models developed
for NIDS alert prioritization has not been studied in
the literature.
(Szczepa
´
nski et al., 2020) introduced the hybrid
Oracle Explainer IDS, which combines artificial neu-
ral networks and decision trees to achieve high ac-
curacy and provide human-understandable explana-
tions for its decisions (Szczepa
´
nski et al., 2020). In
a paper (Senevirathna et al., 2024), authors have de-
veloped an Oracle-based Explainer module that uses
the closest cluster to generate an explanation for the
decision. A study explores how explanations in the
context of 5G security can be targeted and weakened
using scaffolding techniques. The authors suggest
a framework for carrying out the scaffolding attack
within a security setting, which involves selecting fea-
tures and training models by combining explainable
AI methods. (Zolanvari et al., 2021)(Zolanvari et al.,
2021) introduced a model-agnostic XAI framework
called TRUST for numerical applications. It uses fac-
tor analysis to transform input features, mutual infor-
mation to rank features, and a multimodal Gaussian
distribution to generate new samples for each class
label.
Some other studies have explored explainable AI
methods in intrusion detection (Alam and Altiparmak,
2024; Szczepa
´
nski et al., 2020; Kumar and Thing,
2024; Kalakoti et al., 2024a; Kalakoti et al., 2024c;
Kalakoti et al., 2024b; Kalakoti et al., 2023). In con-
trast to studies on machine learning-based Network
Intrusion Detection Systems (NIDSs), our research
emphasizes the significance of making NIDS alerts
understandable through model transparency. Our ap-
proach incorporates eXplainable AI (XAI) techniques
to evaluate their effectiveness in clarifying NIDS alert
classifications. We worked with a real world NIDS
dataset from an environment making our findings
more relevant than those based on old data sets. Our
evaluation criteria cover aspects such as the reliabil-
ity, faithfulness, robustness and complexity of expla-
nations assessing explainability within this domain.
By engaging Security Operations Center (SOC) an-
alysts in verifying our XAI findings we bridge the
gap, between machine learning models and human
knowledge. This progress enhances XAI in the field
of cybersecurity, offering perspectives for developing
transparent and reliable NIDS alert critical prioritiza-
tion systems.
3 METHODOLOGY
3.1 Dataset
Our study makes use of a NIDS alert dataset taken
from a Suricata NIDS system deployed at the Secu-
rity Operations Center (SOC) of Tallinn University
of Technology (Taltech). The dataset was gathered
using the Customized Stream Clustering Algorithm
for Suricata (CSCAS) to analyze alerts from Suricata
NIDS at TalTechs SOC. Data was collected over a
span of 60 days, from January to March 2022 dur-
ing which Suricata generated alerts, for network ac-
tivity involving 45,339 hosts and 4401 TalTech hosts.
The categorized dataset can be accessed at the link;
https://github.com/ristov/nids-alert-data.
Throughout the data collection phase CSCAS op-
Evaluating Explainable AI for Deep Learning-Based Network Intrusion Detection System Alert Classification
49

erated with settings; SessionLength = 300 seconds
(5 minutes) SessionTimeout = 60 seconds (1 minute)
ClusterTimeout = 604,800 seconds (1 week) Cand-
Timeout = 36,000 seconds (10 hours) MaxCandAge =
864,000 seconds (10 days) and α = 0.01. These con-
figurations have been employed for CSCAS in an en-
vironment since 2021 and were determined to be opti-
mal as outlined in (Vaarandi, 2021). NIDS Alerts are
classified as either ”important” or ”irrelevant.” Data
points of network traffic were generated by a cus-
tomized version of SCAS, a stream clustering algo-
rithm, and have labels indicating whether they are re-
garded as inliers or outliers by SCAS. Data points are
labeled by humans to indicate if they represent im-
portant or irrelevant alert groups. Important alerts are
prioritized in the SOC security monitoring processes.
Irrelevant alerts include low-priority threats (e.g., fre-
quent scanning for old vulnerabilities) or false pos-
itives (e.g., alerts related to attempts to resolve bot-
net C&C server DNS names not originating from in-
fected computers but from specific security applica-
tions). The description of the dataset (Vaarandi and
Guerra-Manzanares, 2024) is given below:
• Timestamp – alert group reporting time
• SignatureText – human readable alert text
• SignatureID – numerical signature ID
• SignatureMatchesPerDay – Average matches per
day by the triggering signature (set to 0 if first
match was less than 24 hours ago).
• AlertCount – the number of alerts in the current
alert group
• Proto – numerical protocol ID (e.g., 6 denotes
TCP and 17 UDP)
• ExtIP – anonymized IP address of the external
host (extipN, where N is a number that identifies
the given IP address)
• ExtPort – port at the external host, set to -1 if
alerts involve multiple external ports
• IntIP – Anonymized IP address of the internal
host (intipN), set to -1 if alerts involved multiple
internal IP addresses.
• IntPort – port at the internal host, set to -1 if
alerts involve multiple internal ports.
• Similarity – The overall similarity of this alert
group to others in the same cluster or, if it’s an
outlier, to other outlier alert groups. The value
ranges from 0 to 1, with higher values indicating
a high degree of similarity.
• SCAS – The label assigned by the customized
version of SCAS. Here, 0 denotes an inlier and 1
denotes an outlier.
• AttrSimilarity – similarity for the network IDS
alert attribute Attr (there are 34 attributes in to-
tal). Set to -1 if the attribute Attr is not set for the
given signature, otherwise ranges from 0 to 1.
The field indicates how often the attribute value
has been observed in other alert groups from the
same cluster (or in other outlier alert groups if
the current alert group is an outlier).
We collaborated with Security Operations Center
(SOC) analysts from TalTech, Estonia to estimate the
reliability of the post-hoc explanations generated for
the decisions of the black-box model, which is the
DL model induced for alert classification in this work.
A detailed description of TalTech SOC can be found
in (Vaarandi and M
¨
ases, 2022). Leveraging their ex-
pertise in managing Network Intrusion Detection Sys-
tem (NIDS) alerts, the SOC team at TalTech identified
the five features for determining alert significance as
outlined in Table 1. These features act as benchmark-
ing reference features in our research to evaluate how
well our XAI algorithms perform.
Table 1: Key Features Identified by Taltech SOC Analyst
for Determining NIDS Alert Significance.
SignatureMatchesPerDay
Similarity
SCAS
SignatureID
SignatureIDSimilarity
For our work, the dataset excluded ’Signature-
Text’ and ’Timestamp’ features as external IP ad-
dresses (”ExtIP” feature) and internal IP addresses
(”IntIP” feature) prior, to model training.
3.2 Long Short-Term Memory for NIDS
Alerts
In this study, we proposed long-term memory
(LSTM) to classify whether a given NIDS alert group
needs immediate attention (Important class label) or
can be assessed as less critical (Irrelevant class label).
LSTM is a neural network designed to address the
long-term dependence problem in traditional recur-
rent neural networks. It introduces forget, input, and
output gates to control the flow of information and
maintain long-term memory. Figure 1 shows struc-
ture of the hidden layer of the LSTM network. The
forget gate adapts to the context, discarding unneces-
sary information. It uses a sigmoid function to pro-
duce a value between 0 and 1, then multiplied by the
previous cell state. A value of 0 means complete for-
getting, while 1 means fully retained.
f
t
= σ(W
f
· [h
t−1
, x
t
] + b
f
) (1)
The input gate enhances the necessary informa-
tion for the new cell state, and its output is a sigmoid
ICISSP 2025 - 11th International Conference on Information Systems Security and Privacy
50

Figure 1: Hidden Layer Architecture of LSTM Network.
function with a range of 0 to 1, which is multiplied by
the current cell state.
i
t
= σ(W
i
· [h
t−1
, x
t
] + b
i
) (2)
˜
C
t
= tanh(W
c
· [h
t−1
, x
t
] + b
c
) (3)
Then the old and new state information can be
combined to construct the final new cell state.
C
t
= f
t
×C
t−1
+ i
t
×
˜
C
t
(4)
The output is determined by the output gate,
which uses a sigmoid function to select information to
be output along with the final cell state and the Tanh
function.
O
t
= σ(W
o
· [h
t−1
, x
t
] + b
o
) (5)
h
t
= O
t
× tanh(C
t
) (6)
For training LSTM model, We selected 10,000
data points for each class label (’irrelevant’ and ’im-
portant’), resulting in a total of 20,000 samples. The
The dataset was divided into training and testing sets
at an 80 20-split ratio. We applied the data normaliza-
tion technique to the dataset to convert the values to a
standard scale. We used Min-Max normalization, one
of several available techniques, to transform and nor-
malize the input features to scale them within a range
of 0 to 1, as shown in Equation 7.
x
′
=
x − x
min
x
max
− x
min
(7)
where x
min
is the smallest value of the feature, x
max
is the largest value of the feature, and x is the ac-
tual value of the feature. The normalized feature, x
′
,
ranges between 0 and 1.
We used RandomSearch hyperparameter tuning
with Ray Tune library
1
to train LSTM model. We
evaluated the performance of LSTM model for NIDS
alerts classification using a confusion matrix. In
NIDS alerts classification, True Positives (TP) are the
1
https://docs.ray.io/en/latest/tune/index.html
number of important alerts correctly classified as im-
portant, True Negatives (TN) are the number of irrele-
vant alerts correctly classified as irrelevant, False Pos-
itives (FP) are the number of irrelevant alerts incor-
rectly classified as important. False Negatives (FN)
are the number of important alerts incorrectly classi-
fied as irrelevant. we used the following evaluation
metrics
Accuracy =
T P + T N
T P + T N + FP + FN
(8)
Precision =
T P
T P + FP
(9)
Recall =
T P
T P + FN
(10)
F1-Score = 2 ×
Precision × Recall
Precision + Recall
(11)
We used softmax activation function at the output
layer to predict class labels, which provides predic-
tion probabilities for each class and enables us to un-
derstand the model’s confidence and the probability
distribution. It’s also crucial to evaluate XAI tech-
niques based on metrics like faithfulness, monotonic-
ity and max sensitivity as discussed in section 3.4.
3.3 Explainable AI Methods
When explaining the model using Explainable AI,
there are two approaches: model agnostic and model
specific. Explainable AI methods are also categorized
into two types explanations. Local explanations in-
terpret individual predictions and global explanations
that offer an overview of the model’s behaviour. Our
goal is to enhance the explainability of NIDS alerts
detected by LSTM model. We have utilized four pop-
ular XAI feature attribution methods. Will provide a
brief overview of each one. The following outlines
the four methods (LIME, SHAP, Integrated Gradients
(IG) and DeepLIFT) all designed to clarify instances
and shed light on how the model makes decisions, for
specific predictions. Let x ∈ R
d
be the input, where
d is the feature set dimensionality. The black box
model M maps input to output M (x) ∈ Y . Dataset
D = (x
i
, y
i
) contains all input-output pairs. The expla-
nation mapping g for predictor M and point x returns
importance scores g(M , x) = φ
x
∈ R
d
for all features.
Let D : R
d
× R
d
7→ R≥ 0 be a metric in the expla-
nation space and S : R
d
× R
d
7→ R≥ 0 a metric in the
input space. The evaluation criterion µ maps predictor
M , explainer g, and point x to a scalar.
Evaluating Explainable AI for Deep Learning-Based Network Intrusion Detection System Alert Classification
51

3.3.1 SHAP
SHAP (Lundberg and Lee, 2017) uses Shapley val-
ues from game theory to attribute the importance of
each feature to a model’s prediction, providing a uni-
fied measure of feature importance. SHAP based
on Shapley values, is defined as: g(M , x) = φ
0
+
∑
M
j=1
φ
j
where φ
j
is the feature attribution of feature
j. SHAP’s DeepExplainer was used in this study.
3.3.2 LIME
LIME (Ribeiro et al., 2016) (Local Interpretable
Model-agnostic Explanations) constructs a locally in-
terpretable model around a specific prediction. It
works by perturbing the input and fitting a simple
model, like a linear model, to explain the behaviour of
the black box model in the vicinity of the prediction of
interest. LIME approximates model behavior locally
around (x) by minimizing: argmin
g∈G
L(M , g, π
x
)+ Ω(g)
where g is an interpretable model in the neighborhood
of (x).
3.3.3 Integrated Gradients
Integrated Gradients (IG) (Sundararajan et al., 2017)
attributes the prediction of a deep network to its inputs
by integrating the gradients along a straight-line path
from a baseline input to the actual input. This method
satisfies desirable axioms like completeness and sen-
sitivity, providing a theoretically sound approach
to feature attribution. IG attributes feature impor-
tance by integrating model gradients from a baseline
g(M , x) = IG(x) = (x − ¯x) ×
R
1
α=0
∂M ( ¯x+α·(x− ¯x))
∂x
dα
where ¯x is the baseline input.
3.3.4 DeepLIFT
DeepLIFT (Shrikumar et al., 2017) assigns each in-
put (x) a value C
∆x
i
∆y
representing its deviation from
a reference value, satisfying:
∑
n
i=1
C
∆x
i
∆o
= ∆o where
o = M (x) and ∆o is the difference between model
output and reference value.
3.4 Evaluation of Explainable AI
Methods
The evaluation of Explainable AI methods is cru-
cial to ensure that the explanations they provided
are transparent, also accurate and reliable. We em-
ploy four key metrics to assess the quality of our
explanations for LSTM Model based NIDS alerts:
Reliability, Faithfulness, Robustness and Complex-
ity. These metrics provide a comprehensive evalu-
ation framework that addresses different aspects of
explanation quality. XAI evaluation is categorized
into three groups (Coroama and Groza, 2022): user-
focused evaluation, application-focused evaluation,
and functionality-focused evaluation. The first two
categories are part of human-centered evaluation and
are broken down into subjective and objective mea-
sures.
3.4.1 Reliability
An explanation should be centered around the region
of interest, the ground truth GT. g(M , x) = GT.
’Major’ parts of an explanation should lie inside the
ground truth mask GT(x) for both Relevance Mass
Accuracy and Relevance Rank Accuracy metrics used
in this work, and the Ground truth mask ([0,1]) was
determined by the features SOC Analysts identified
(see Table. 1).Truth-based measures relevance rank
accuracy and relevance mask accuracy are derived
from (Arras et al., 2022).
(a) Relevance Rank Accuracy (RRA) (Arras et al.,
2022): Relevance rank accuracy measures how
much of the high-intensity relevance lies within
the ground truth. We sort the top K values of
g(M , x) in decreasing order X
topK
= {x
1
, ..., x
K
|
g(M , x)
x
1
> ... > g(M , x)
x
K
}.
RRA =
|X
top
k
∩ GT(x)|
|GT(x)|
Here top
k
are features Identified by SOC Ana-
lyst.
(b) Relevance Mass Accuracy (RMA) (Arras et al.,
2022): The relevance mass accuracy is calcu-
lated as the sum of the explanation values within
the ground truth mask divided by the sum of all
values.
RMA =
∑
i
g(M , x)
i
· GT(x
i
)
∑
i
g(M , x)
i
3.4.2 Faithfulness
The explanation algorithm g should replicate the
model’s behavior. g(M , x) ≈ M (x). Faithfulness
quantifies the consistency between the prediction
model M and explanation g. For evaluating the
Faithfulness of explanations, the Faithfulness correla-
tion (Bhatt et al., 2020) and Monotonocity (Luss et al.,
2019) metrics were used.
(a) High Faithfulness Correlation: Faithfulness
measures how well the explanation function g
aligns feature importance scores with the black-
ICISSP 2025 - 11th International Conference on Information Systems Security and Privacy
52

box model M
µ
F
(M , g; x) = corr
B∈
(
|d|
|B|
)
∑
i∈B
g(M , x)
i
, M (x)−M (x
B
)
!
(12)
where x
B
= x
i
|i ∈ B} High Faithfulness correla-
tion metric iteratively substitutes a random sub-
set of given attributions with a baseline value
B. Then, it measures the correlation between the
sum of these attributions and the difference in the
model’s output.
(b) Monotonicity: Let x, x
′
∈ R
d
be two input points
such that x
i
≤ x
′
i
for all i ∈ 1, 2, . . . , d. M and g
are said to be monotonic if the following condi-
tion holds: For any subset S ⊆ 1, 2, . . . , d, the sum
of the attributions of the features in S should be
nonnegative when moving from x to x
′
, that is,
∑
i∈S
g(M , x)i ≤
∑
i∈S
g(M , x
′
)
i
implies
M (x) − M (x
[x
s
= ¯x
s
]
) ≤ M (x
′
) − M (x
′
[x
′
s
= ¯x
s
])
3.4.3 Robustness
Robustness refers to similar inputs should result
in similar explanations. g(M , x) ≈ g(M , x +
ε) for small ε.
(a) Max Sensitivity: Max sensitivity (Bhatt et al.,
2020): is used to ensure that nearby inputs with
similar model output have similar explanations,
it is desirable for the explanation function g to
have a low sensitivity in the region surround-
ing the point of interest x, assuming the differ-
entiability of the predictor function M . Maxi-
mum sensitivity of an explanation function g at
a point of interest x in its neighbourhood is de-
fined as follows: Consider a neighbourhood N
r
of points within a radius r of x, denoted by N
r
=
z ∈ D
x
|p(x, z) ≤ r, M (x) = M (x)(z), where D is
the distance metric, and p is the proximity func-
tion. Given a predictor M (x), a distance metric
D, a proximity function p, a radius r, and a point
x, we define the maximum sensitivity of g at x as
follows:
µ
M
(M (x), g, r; x) = max
z∈N
r
D(g(M (x), x), g(M (x), z))
(13)
3.4.4 Complexity
Explanations using a smaller number of features are
preferred. It is assumed that explanations using a
large number of features are difficult for the user to
understand.min
g(M , x)
0
.
(a) Low Complexity: Low complexity (Bhatt et al.,
2020) metric computes the entropy of each fea-
ture’s fractional contribution to the total attribu-
tion magnitude individually.
µ
C
(M , g; x) = −
d
∑
i=1
P
g
(i)logP
g
(i) (14)
where
P
g
(i) =
|g(M , x)i|
∑
j ∈ |d||g(M , x)
j
|
;P
g
= P
g
(1), ....P
g
(d)
(15)
The experiments were carried out on a computer
running Pop! OS 22.04 LTS x86 64 operating system
with the following hardware configuration: 32 GB of
DDR4-2666R ECC RAM, AMD Ryzen 5 5600G with
Radeon Graphics (12) @ 3.900GHz processor. The
scripts were developed using the Python 3.9 program-
ming language and Pytorch library. For the imple-
mentation of the Integrated Gradients and DeepLIFT
explainers, Captum library was used.
4 RESULTS & DISCUSSIONS
In this section, we present the results of our research,
including an analysis of the LSTM model’s perfor-
mance and explanations of LSTM model using Ex-
plainable AI methods and the quality of evaluation for
these explanations based on four criteria: faithfulness,
complexity, reliability, and robustness.
Figure. 3a shows the confusion matrix, indicating
the model’s strong classification performance for test
data of 4000. It correctly classified 2005 important
alerts and 1980 irrelevant alerts, with only 14 misclas-
sifications of irrelevant alerts as necessary, demon-
strating high accuracy and a low false positive rate.
Figure. 2a shows the training and validation loss over
70 epochs obtained through random search parame-
ter tuning. Initially, both decrease rapidly before sta-
bilizing, indicating convergence without overfitting.
The close alignment of the training and validation loss
curves represents good generalization to unseen data.
Figure. 2b shows the training and validation accu-
racy, which quickly stabilizes above 99.5%, indicat-
ing strong model performance. In Figure. 3b, from the
classification report, the model achieves near-perfect
precision, recall, and F1-score scores for both classes.
In this paper, we utilized 4 different explainable
AI methods (LIME, SHAP, IG, and DeepLift) to ex-
plain the predictions of our LSTM model on the test
data. LIME analyzes how the model assigns prob-
abilities to categories by comparing these probabili-
ties with the actual category of the data point. SHAP
method provides single-data-point explanations for
models, giving insights. In explanations, a particular
Evaluating Explainable AI for Deep Learning-Based Network Intrusion Detection System Alert Classification
53
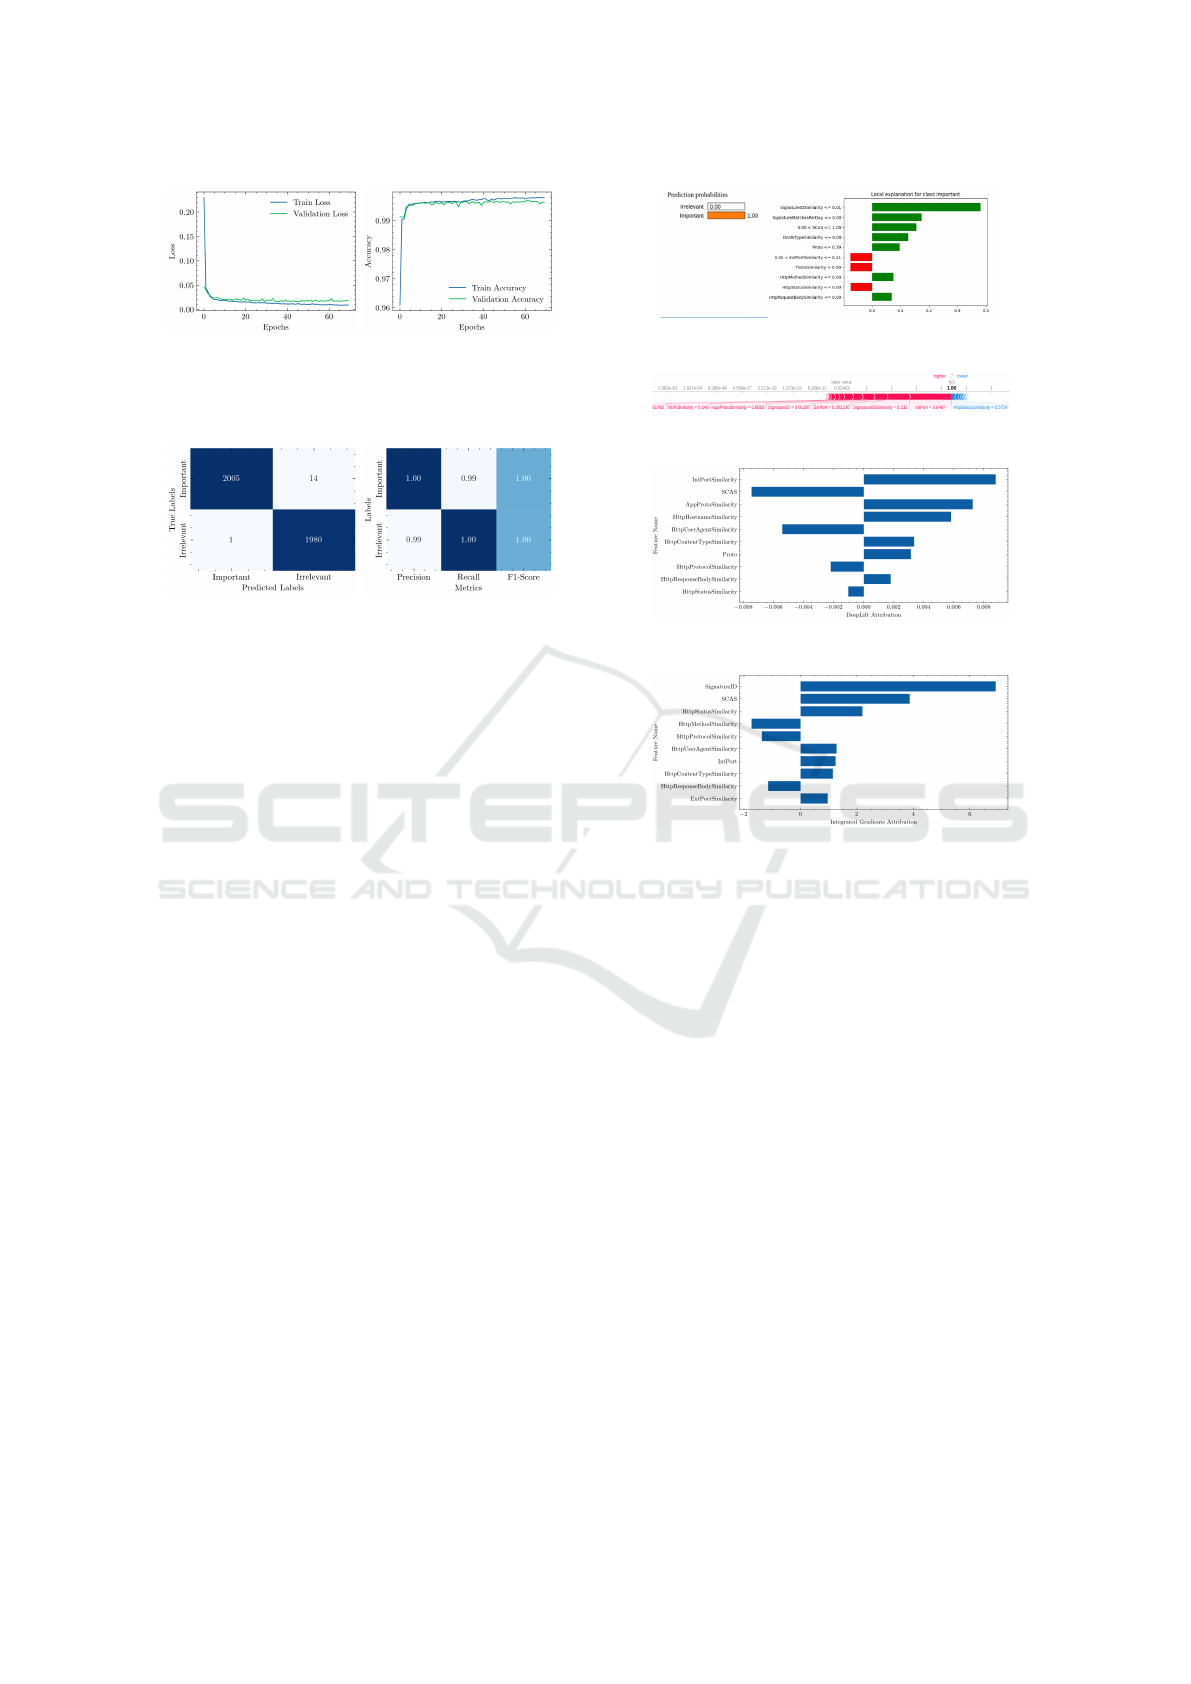
(a) Loss (b) Accuracy.
Figure 2: Loss and Accuracy from Best LSTM Performance
Model.
(a) Confusion Matrix (b) Classification Report
Figure 3: Confusion Matrix and Classification Report.
data point is selected to demonstrate how each feature
influences the model’s prediction.
Fig. 4a shows an local explanation from LIME
method for a NIDS alert labeled as ”Important.”. Left
side presents prediction probabilities with a 100%
probability for the ”Important” class. On the right
side it illustrates the impact of features. For instance,
when the feature ‘SignatureIDSimilarity’ is less than
or equal to 0.01, it positively affects the ”Important”
classification of NIDS alert. Additionally, ‘Signa-
tureMatchesPerDay’ and ‘SCAS’ being less than or
equal to 1.00 also contribute positively. Conversely,
‘ExtPortSimilarity’ and ‘TlsSniSimilarity’ have im-
pacts, suggesting that some NIDS alerts may not be
relevant. SHAP employs Shapley values to showcase
how features influence model predictions in Fig. 4b of
force plot, red bar signifies the positive impact while
blue bar indicates the negative impact on the model
output. Each bar demonstrates whether the features
bring the predicted value closer to or farther from
the base value of 0.02463. The plot’s base value is
the average of all prediction values. Each strip in
the plot displays the impact of the features on mov-
ing the predicted value closer to or farther from the
base value. Final prediction is deemed an ”important
class label”, with a value of 1.00 for this NIDS alert.
Features, like ’IntPort’ (Internal Port) ’SignatureID-
Similarity’. ExtPort’ (External Port) along with ’Sig-
natureID’ play a role in indicating the importance of
NIDS alert. However, the feature ’HttpStatusSimilar-
ity’ might suggest that this alert could be a less critical
feature to its impact.
DeepLift is a technique used to attribute the out-
(a) LIME explanations for important NIDS alerts
using an LSTM model
(b) SHAP explanations for an important NIDS
alert data point using an LSTM model
(c) DeepLIFT feature importance for an important
NIDS alert data point using an LSTM model
(d) Integrated Gradients feature importance for an
important NIDS alert data point using an LSTM
model
Figure 4: Explanations for an important NIDS alert data
point using an LSTM model.
put of LSTM model to its input features by compar-
ing neuron activation to a reference activation and
assigning contribution scores based on the variance.
Fig. 4c illustrates the significance of features using the
DeepLift explainer for the 10 features of a NIDS alert
data point labeled as ”important.” The negative attri-
bution of ’SCAS’ suggests its influence on classifying
as ”Important” in NIDS alerts. Additionally ’Http-
MethodSimilarity’ and ’IntIP’ show negative attribu-
tions while HttpContentTypeSimilarity has a slight
positive impact countering the ”Important” classifica-
tion. IG attribute a LSTM model’s prediction its input
features by integrating gradients of the model’s out-
put with respect to the input along from a baseline to
the input. This explanation technique works best for
models that use linear activation functions. Fig. 4d
showcases feature importance using IG explainer for
a data point in the ”Important” NIDS alert class la-
bel among the 10 features. Features such, as ’Sig-
natureID’ ’SCAS,’ and ’HttpStatusSimilarity’ display
ICISSP 2025 - 11th International Conference on Information Systems Security and Privacy
54

Table 2: Evaluation Results of Explainable AI Methods: Mean (µ) and Standard Deviation (σ) Values.
Explanation Criterion Faithfulness Robustness Complexity Reliability
Explainer/Metric
High
Faithfulnes
Monotonicity Max Sensitvity Low Complexity
Relevance Mass
Accuracy
Relevancy Rank
Accuracy
µ ± σ µ µ ± σ µ ± σ µ ± σ µ ± σ
Lime 0.4209 ± 0.1835 59.55% 0.3617 ± 0.1152 3.0318 ± 0.0703 0.6234 ± 9.7008 0.5250 ± 0.1041
Shap 0.3959 ± 0.2928 64.45% 0.0245 ± 0.0862 2.4677 ± 0.2074 0.6527 ± 3.8334 0.4743 ± 0.1418
IG 0.1761 ± 0.3815 73.70% 0.1774 ± 0.2505 2.1745 ± 0.4134 0.5939 ± 0.6840 0.3410 ± 0.1545
Deep Lift 0.7559 ± 0.2681 78.35% 0.0008 ± 0.0004 2.2635 ± 0.3299 0.7812 ± 25.2805 0.6754 ± 0.0897
(a) High Faithfulness (b) Max Sensitivity (c) Low Complexity (d) Relevancy Rank Accuracy
Figure 5: Quality of Explainable AI evaluation metrics distribution.
attributions.
Our analysis comparing the features identified by
the TalTech SOC analyst closely aligned with those
derived by explainers used in our LSTM model to
classify ”important” NIDS alerts. The 5 features rec-
ognized by SOC experts in Table 1 proved signifi-
cant across explainers, although their order of feature
importance varied. For instance, ’SignatureIDSimi-
larity’ and ’SignatureID’, highlighted by SOC ana-
lysts, impacted the SHAP explainer for NIDS alerts.
The presence of ”SCAS” was notable in LIME, IG,
and DeepLift, confirming its significance. The im-
portance of ’SignatureMatchesPerDay’ varied among
explainers within LIME. Notably upon reviewing the
10 features highlighted by each explainer, we noticed
an overlap with the features identified by SOC an-
alysts particularly emphasizing ’SignatureID’, ’Sig-
natureIDSimilarity’, ’SCAS’ and ’SignatureMatches-
PerDay’. We assessed the quality explanation of XAI
methods, for LSTM model based alerts using metrics
based on four criteria: faithfulness, robustness, com-
plexity and reliability.
We evaluated the quality of explanations ob-
tained by XAI methods for Long Short-Term Mem-
ory (LSTM) network-based NIDS alert classification
across 2000 data points using metrics based on four
criteria: Faithfulness, robustness, complexity, and re-
liability. Table 5 shows the results of the quality of ex-
planation for XAI methods. LSTM model prediction
probabilities were computed using the Softmax acti-
vation function. To evaluate the Faithfulness of expla-
nations, we employed high faithfulness correlations
and monotonicity. High Faithfulness of XAI methods
was evaluated by studying the correlation between at-
tribute importance assigned by the XAI method and
their impact on the model’s probabilities. A high
faithfulness correlation value suggests that the expla-
nations effectively capture the model’s behaviour and
can be regarded as faithful. Table. 2 shows the evalua-
tion results of xai methods. Mean (µ) and standard de-
viation (σ) values were calculated for the test data of
XAI computed metrics for 2000 test data points. Deep
Lift achieved the highest Faithfulness mean and stan-
dard deviation correlation values of 0.7559 ± 0.2681
for test data points. We also analyzed the monotonic-
ity of the explanation to understand how individual
features affect model probability by adding each at-
tribute to enhance its importance and observing its in-
fluence on the model’s probability. By assessing the
monotonicity of the explainer, we can measure how
the explanations change monotonically with respect
to the input features. Deep LIFT achieved high mono-
tonicity with 78% (µ).
To measure complexity, we calculate the entropy
of feature attribution in the explanations. Com-
plexity measures the conciseness of explanations de-
rived by the explainer. Among xai methods assessed
by low complexity metric, Integrated Gradients (IG)
achieved lower complexity ( 2.174 ± 0.413) closely
followed by DeepLift ( 2.264 ± 0.330.)
The sensitivity metric assesses the consistency of
the explainers’ output, ensuring that similar inputs in
the feature space of model outputs have similar ex-
planations when sensitivity is low. For this metric, we
used the Euclidean distance with a radius value of 0.1
to find the nearest neighbour points related to the pre-
diction label of an explanation which helps to identify
data points in the feature space with similar expla-
Evaluating Explainable AI for Deep Learning-Based Network Intrusion Detection System Alert Classification
55

Table 3: Statistical Comparison of Explainers Across Multiple Metrics (p-values).
Metric Explainer Shap IG Deep Lift
Faithfulness
LIME L (3.34e-41) L (1.03e-134) D (5.61e-185)
SHAP - S (6.22e-91) D (1.03e-169)
IG - D (1.30e-230)
Max Sensitivity
LIME S (0.00e+00) I (1.64e-221) D (0.00e+00)
SHAP - S (1.38e-185) D (3.54e-126)
IG - D (3.29e-126)
Low Complexity
LIME S (0.00e+00) I (0.00e+00) D (0.00e+00)
SHAP - I (5.45e-146) D (1.26e-88)
IG - I (1.07e-42)
RMA
LIME S (5.12e-25) L (1.97e-80) D (6.22e-83)
SHAP - S (4.67e-155) D (6.47e-91)
IG - D (2.82e-54)
RRA
LIME L (7.61e-39) L (3.07e-210) D (0.00e+00)
SHAP - S (5.52e-155) D (3.97e-253)
IG - D (0.00e+00)
D (Deep Lift), L (LIME), S (SHAP), and I (Integrated Gradients)
indicate the better performing explainer in each pairwise comparison.
p > 0.05 — No significant evidence against H
0
; H
0
is not rejected
0.01 < p ≤ 0.05 — Significant evidence against H
0
; H
1
is accepted at 95% confidence level
0.001 < p ≤ 0.01 — Strong evidence against H
0
; H
1
is accepted at 99% confidence level
p ≤ 0.001 — Very strong evidence against H
0
; H
1
is accepted at 99.9% confidence level.
nations for the predicted label. Deep LIFT achieved
Lower sensitivity with max sensitivity metric (0.0008
± 0.0004).
Two metrics, Relevance Mass Accuracy and Rel-
evance Rank Accuracy, were used to evaluate the reli-
ability of explanations. These metrics validated the
explanations by comparing them to a ground truth
mask based on features identified through collabora-
tion with an SoC analyst. For both Relevance Mass
Accuracy (0.781 ± 25.281) and Relevancy Rank Ac-
curacy (0.6754 ± 0.089) metrics, Deep lift explana-
tions were reliable. Figure. 5 illustrates the distribu-
tion of XAI metric results for 2000 data points, high-
lighting that DeepLIFT’s explanations demonstrate
high faithfulness, lower sensitivity, lower complex-
ity, and more relevance rank accuracy. Faithfulness
correlation values for DeepLIFT indicate a strong
skew towards higher levels, showing a high degree
of consistency through monotonicity. Moreover, the
entropy values of feature importance scores for IG
and DeepLIFT are more evenly spread towards the
lower end than other explainers. The sensitivity val-
ues for the DeepLIFT explainer are also more evenly
spread to lower values in maximum sensitivity met-
rics. Additionally, using Relevance Rank Accuracy,
DeepLIFT consistently achieves a high relevance rank
accuracy with less variation, centred around 0.8.
Following established practices in the statistical
analysis of XAI methods evaluation (Jesus et al.,
2021), we employed the Wilcoxon signed-ranks
test (Woolson, 2005) to evaluate the statistical signif-
icance of differences (Dem
ˇ
sar, 2006) in XAI metric
scores between pairs of explainers (i.e., explainer
A
,
explainer
B
) for NIDS alert classification. The null hy-
pothesis (H
0
) is that the explainable AI metric scores
of the explainers are equivalent, i.e., there is no signif-
icant difference between the explainers (XAI Metric
Score(explainer
A
) = XAI Metric Score(explainer
B
)).
The alternative hypothesis (H
1
) is that they are not
equivalent (XAI Metric Score(explainer
A
) ̸= XAI
Metric Score(explainer
B
)), indicating a significant
difference in their explainer metric scores. XAI met-
rics used in this study are High Faithfulness, Max
Sensitivity, Low Complexity, Relevance Mass Accu-
racy, and Relevancy Rank Accuracy. This test was
conducted separately for each metric to assess the per-
formance differences among the explainers compre-
hensively.
The statistical analysis in Table 3 shows signifi-
cant differences among the explainers for all metrics,
with p-values consistently below 0.05, demonstrating
strong evidence against the null hypothesis. DeepLift
explainer is better regarding faithfulness, max sen-
sitivity, RMA, and RRA when compared pairwise
(p < 0.001 for all comparisons) with other explain-
ers. The relative performance of SHAP, LIME, and
IG varies across metrics can be seen Table 3.
We have also provided a global explanation us-
ICISSP 2025 - 11th International Conference on Information Systems Security and Privacy
56

Figure 6: SHAP global explanation for LSTM model.
ing SHAP values for all the testing data of the LSTM
model. A higher value positively impacts the pre-
diction, while a lower value contributes negatively.
Figure. 6 shows the global explanation of the LSTM
model. The graph illustrates the average impact of
each feature on the model’s output magnitude for
the class labels, ”irrelevant” and ”important” classi-
fications. SignatureIDSimilarity, SignatureMatches-
PerDay, ProtoSimilarity and SCAS are most impact
ful features for important nids alerts. Notably, these
top features align with those identified by human ex-
pert SOC analysts. Lower-ranked features such as
HTTP-related similarities (e.g., HttpHostnameSimi-
larity, HttpUrlSimilarity) and IP-related features (e.g.,
ExtIPSimilarity) have comparatively less impact on
the model’s decisions.
5 CONCLUSIONS AND FUTURE
WORK
This research presents explainable artificial intelli-
gence (XAI) based Network Intrusion Detection Sys-
tems (NIDS) alert classification utilizing a Long
Short-Term Memory (LSTM) model. We have show-
cased how enhancing the explainability and trust-
worthiness of AI-powered cybersecurity systems can
be achieved by clarifying the output predictions of
these LSTM models through four XAI techniques:
LIME, SHAP, Integrated Gradients, and DeepLIFT.
Our thorough assessment of the XAI framework, con-
sidering the aspects of faithfulness, complexity, ro-
bustness, and reliability, has evaluated how well these
XAI methods explain NIDS alerts. The superior per-
formance of DeepLIFT across these evaluation met-
rics underscores its potential as a preferred method
for interpreting NIDS alert classifications. Notably,
the substantial alignment between explanations gen-
erated by XAI techniques and features identified by
SOC analysts validates their effectiveness in captur-
ing domain expertise. This research makes a contri-
bution by bridging the gap between the high accuracy
of opaque machine learning models and the necessity
for transparent decision-making in cybersecurity op-
erations. By proposing a framework to explain black
box model decisions and assess XAI in NIDS appli-
cations, we provided comprehensive benchmarking
results, including evaluation metrics for developing
transparent and interpretable AI systems in crucial se-
curity domains.
REFERENCES
Alam, S. and Altiparmak, Z. (2024). Xai-cf–examining
the role of explainable artificial intelligence in cyber
forensics. arXiv preprint arXiv:2402.02452.
Arras, L., Osman, A., and Samek, W. (2022). Clevr-xai:
A benchmark dataset for the ground truth evaluation
of neural network explanations. Information Fusion,
81:14–40.
Ban, T., Samuel, N., Takahashi, T., and Inoue, D. (2021).
Combat security alert fatigue with ai-assisted tech-
niques. In Proceedings of the 14th Cyber Security Ex-
perimentation and Test Workshop, pages 9–16.
Ban, T., Takahashi, T., Ndichu, S., and Inoue, D. (2023).
Breaking alert fatigue: Ai-assisted siem framework
for effective incident response. Applied Sciences,
13(11):6610.
Bhatt, U., Weller, A., and Moura, J. M. (2020). Evalu-
ating and aggregating feature-based model explana-
tions. arXiv preprint arXiv:2005.00631.
Coroama, L. and Groza, A. (2022). Evaluation metrics
in explainable artificial intelligence (xai). In Inter-
national conference on advanced research in tech-
nologies, information, innovation and sustainability,
pages 401–413. Springer.
Day, D. and Burns, B. (2011). A performance analysis of
snort and suricata network intrusion detection and pre-
vention engines. In Fifth international conference on
digital society, Gosier, Guadeloupe, pages 187–192.
Dem
ˇ
sar, J. (2006). Statistical comparisons of classifiers
over multiple data sets. The Journal of Machine learn-
ing research, 7:1–30.
Feng, C., Wu, S., and Liu, N. (2017). A user-centric ma-
chine learning framework for cyber security opera-
tions center. In 2017 IEEE International Conference
on Intelligence and Security Informatics (ISI), pages
173–175. IEEE.
Goodman, B. and Flaxman, S. (2017). European union reg-
ulations on algorithmic decision-making and a “right
to explanation”. AI magazine, 38(3):50–57.
Jesus, S., Bel
´
em, C., Balayan, V., Bento, J., Saleiro,
P., Bizarro, P., and Gama, J. (2021). How can i
choose an explainer? an application-grounded eval-
uation of post-hoc explanations. In Proceedings of the
Evaluating Explainable AI for Deep Learning-Based Network Intrusion Detection System Alert Classification
57

2021 ACM conference on fairness, accountability, and
transparency, pages 805–815.
Jyothsna, V., Prasad, R., and Prasad, K. M. (2011). A review
of anomaly based intrusion detection systems. Inter-
national Journal of Computer Applications, 28(7):26–
35.
Kalakoti, R., Bahsi, H., and N
˜
omm, S. (2024a). Improving
iot security with explainable ai: Quantitative evalua-
tion of explainability for iot botnet detection. IEEE
Internet of Things Journal.
Kalakoti, R., Bahsi, H., and N
˜
omm, S. (2024b). Explainable
federated learning for botnet detection in iot networks.
In 2024 IEEE International Conference on Cyber Se-
curity and Resilience (CSR), pages 01–08.
Kalakoti, R., N
˜
omm, S., and Bahsi, H. (2022). In-depth
feature selection for the statistical machine learning-
based botnet detection in iot networks. IEEE Access,
10:94518–94535.
Kalakoti, R., N
˜
omm, S., and Bahsi, H. (2023). Improving
transparency and explainability of deep learning based
iot botnet detection using explainable artificial intel-
ligence (xai). In 2023 International Conference on
Machine Learning and Applications (ICMLA), pages
595–601. IEEE.
Kalakoti, R., N
˜
omm, S., and Bahsi, H. (2024c). Enhancing
iot botnet attack detection in socs with an explainable
active learning framework. In 2024 IEEE World AI
IoT Congress (AIIoT), pages 265–272. IEEE.
Kidmose, E., Stevanovic, M., Brandbyge, S., and Peder-
sen, J. M. (2020). Featureless discovery of correlated
and false intrusion alerts. IEEE Access, 8:108748–
108765.
Kumar, A. and Thing, V. L. (2024). Evaluating the explain-
ability of state-of-the-art machine learning-based iot
network intrusion detection systems. arXiv preprint
arXiv:2408.14040.
Lundberg, S. M. and Lee, S.-I. (2017). A unified approach
to interpreting model predictions. Advances in neural
information processing systems, 30.
Luss, R., Chen, P.-Y., Dhurandhar, A., Sattigeri, P., Shan-
mugam, K., and Tu, C.-C. (2019). Generating con-
trastive explanations with monotonic attribute func-
tions. arXiv preprint arXiv:1905.12698, 3.
Mane, S. and Rao, D. (2021). Explaining network intru-
sion detection system using explainable ai framework.
arXiv preprint arXiv:2103.07110.
Moustafa, N., Koroniotis, N., Keshk, M., Zomaya, A. Y.,
and Tari, Z. (2023). Explainable intrusion detection
for cyber defences in the internet of things: Opportu-
nities and solutions. IEEE Communications Surveys
& Tutorials, 25(3):1775–1807.
Rawal, A., McCoy, J., Rawat, D. B., Sadler, B. M., and
Amant, R. S. (2021). Recent advances in trustworthy
explainable artificial intelligence: Status, challenges,
and perspectives. IEEE Transactions on Artificial In-
telligence, 3(6):852–866.
Ribeiro, M. T., Singh, S., and Guestrin, C. (2016). ” why
should i trust you?” explaining the predictions of any
classifier. In Proceedings of the 22nd ACM SIGKDD
international conference on knowledge discovery and
data mining, pages 1135–1144.
Senevirathna, T., Siniarski, B., Liyanage, M., and Wang,
S. (2024). Deceiving post-hoc explainable ai (xai)
methods in network intrusion detection. In 2024 IEEE
21st Consumer Communications & Networking Con-
ference (CCNC), pages 107–112. IEEE.
Shin, I., Choi, Y., Kwon, T., Lee, H., and Song, J. (2019).
Platform design and implementation for flexible data
processing and building ml models of ids alerts. In
2019 14th Asia Joint Conference on Information Se-
curity (AsiaJCIS), pages 64–71. IEEE.
Shrikumar, A., Greenside, P., and Kundaje, A. (2017).
Learning important features through propagating ac-
tivation differences. In International conference on
machine learning, pages 3145–3153. PMLR.
Sundararajan, M., Taly, A., and Yan, Q. (2017). Axiomatic
attribution for deep networks. In International confer-
ence on machine learning, pages 3319–3328. PMLR.
Szczepa
´
nski, M., Chora
´
s, M., Pawlicki, M., and Kozik, R.
(2020). Achieving explainability of intrusion detec-
tion system by hybrid oracle-explainer approach. In
2020 International Joint Conference on neural net-
works (IJCNN), pages 1–8. IEEE.
Tavallaee, M., Bagheri, E., Lu, W., and Ghorbani, A. A.
(2009). A detailed analysis of the kdd cup 99 data
set. In 2009 IEEE symposium on computational intel-
ligence for security and defense applications, pages
1–6. Ieee.
Tsai, C.-F., Hsu, Y.-F., Lin, C.-Y., and Lin, W.-Y. (2009).
Intrusion detection by machine learning: A review. ex-
pert systems with applications, 36(10):11994–12000.
Vaarandi, R. (2021). A stream clustering algorithm for clas-
sifying network ids alerts. In 2021 IEEE International
Conference on Cyber Security and Resilience (CSR),
pages 14–19. IEEE.
Vaarandi, R. and Guerra-Manzanares, A. (2024). Stream
clustering guided supervised learning for classifying
nids alerts. Future Generation Computer Systems,
155:231–244.
Vaarandi, R. and M
¨
ases, S. (2022). How to build a soc on
a budget. In 2022 IEEE International Conference on
Cyber Security and Resilience (CSR), pages 171–177.
IEEE.
Van Ede, T., Aghakhani, H., Spahn, N., Bortolameotti, R.,
Cova, M., Continella, A., van Steen, M., Peter, A.,
Kruegel, C., and Vigna, G. (2022). Deepcase: Semi-
supervised contextual analysis of security events. In
2022 IEEE Symposium on Security and Privacy (SP),
pages 522–539. IEEE.
Wang, T., Zhang, C., Lu, Z., Du, D., and Han, Y. (2019).
Identifying truly suspicious events and false alarms
based on alert graph. In 2019 IEEE International Con-
ference on Big Data (Big Data), pages 5929–5936.
IEEE.
Woolson, R. F. (2005). Wilcoxon signed-rank test. Ency-
clopedia of Biostatistics, 8.
Zolanvari, M., Yang, Z., Khan, K., Jain, R., and Meskin,
N. (2021). Trust xai: Model-agnostic explanations for
ai with a case study on iiot security. IEEE internet of
things journal, 10(4):2967–2978.
ICISSP 2025 - 11th International Conference on Information Systems Security and Privacy
58
