
Public Transport Network Design for Equality of Accessibility via
Message Passing Neural Networks and Reinforcement Learning
Duo Wang
a
, Andrea Araldo
b
and Maximilien Chau
SAMOVAR, Institut Polytechnique de Paris, Palaiseau, France
Keywords:
Transport, Network, Design, Accessibility, Reinforcement Learning, Message Passing Neural Networks.
Abstract:
Graph learning involves embedding relevant information about a graph’s structure into a vector space. How-
ever, graphs often represent objects within a physical or social context, such as a Public Transport (PT) graph,
where nodes represent locations surrounded by opportunities. In these cases, the performance of the graph
depends not only on its structure but also on the physical and social characteristics of the environment. Op-
timizing a graph may require adapting its structure to these contexts. This paper demonstrates that Message
Passing Neural Networks (MPNNs) can effectively embed both graph structure and environmental informa-
tion, enabling the design of PT graphs that meet complex objectives. Specifically, we focus on accessibility,
an indicator of how many opportunities can be reached in a unit of time. We set the objective to design a
“equitable” PT graph with a lower accessibility inequality. We combine MPNN with Reinforcement Learning
(RL) and show the efficacy of our method against metaheuristics in a use case representing in simplified terms
the city of Montreal. Our superior results show the capacity of MPNN and RL to capture the intricate relations
between the PT graph and the environment, which metaheuristics do not achieve.
1 INTRODUCTION
Existing Public Transport (PT) is less and less ade-
quate to satisfy mobility needs of the people, in a con-
text of urban sprawl (Sun et al., 2018). The United
Nations estimate that only “1/2 of the urban popula-
tion has convenient access to PT” (UN, 2020). Build-
ing more and more PT lines to keep pace with ur-
ban sprawl, using traditional planning objectives, has
proved to be ineffective.
PT operators generally design PT lines with the
purpose of maximizing overall efficiency, measured
in terms of generalized cost (which takes into account
travel times and cost for the operators), or number
of kilometers traveled or number of passengers trans-
ported. This has resulted in unequal development of
PT within urban areas. The level of service offered by
PT is often satisfactory in city centers and poor in the
suburbs. In transportation, there is a consensus that it
is not sustainable that people in the suburbs travel by
car, as private cars are the largest polluters, 60.6% of
all transport (EU, 2019). Therefore, suburban popula-
tion depend on their private cars to perform their daily
a
https://orcid.org/0009-0007-8567-4707
b
https://orcid.org/0000-0002-5448-6646
activities (Anable, 2005; Welch et al., 2013). As an
example, the modal share of the car in the city center
of Prague is double that in the city center. The depen-
dence on private cars has negative economic, social
and environmental impacts (Saeidizand et al., 2022,
Section 2.2), which are common to different cities of
the world. For example, 61% of EU road transport
CO
2
comes from cars, jobseekers with no car have
72% less chances of finding a job in Flanders, etc.
Therefore, a sufficient condition to achieve sustain-
ability is to improve PT level of service where it is
currently poor. We propose in this paper to set geo-
graphical equality of PT level of service as the main
design objective. We focus in this paper on PT acces-
sibility metric, which measures the ease (in terms of
time and/or monetary cost) of reaching Points of In-
terest (PoIs) via PT. To improve geographical equal-
ity, we prioritize increasing PT accessibility in the un-
derserved areas.
A trivial strategy to do so would be to place more
stops and lines in underserved areas. However, this
may not be the most efficient way to increase ac-
cessibility there. Indeed, the ability to reach PoIs
might be increased even more by improving PT net-
work close to other nodes, possibly far away, that
may enable convenient changes with other important
Wang, D., Araldo, A. and Chau, M.
Public Transport Network Design for Equality of Accessibility via Message Passing Neural Networks and Reinforcement Learning.
DOI: 10.5220/0013166000003890
In Proceedings of the 17th International Conference on Agents and Artificial Intelligence (ICAART 2025) - Volume 3, pages 619-630
ISBN: 978-989-758-737-5; ISSN: 2184-433X
Copyright © 2025 by Paper published under CC license (CC BY-NC-ND 4.0)
619

lines. In general the PT network extends the inter-
dependencies between locations and PoIs far beyond
those that are in physical proximity. Therefore, to re-
duce the inequality of the distribution of accessibility
it is always required to take the entire PT graph into
consideration, rather than just around the local areas
where we want improvement. This makes our prob-
lem particularly challenging.
Most cities already have an existing PT network,
and the need to build lines from scratch is very lim-
ited. Re-designing the whole PT network is also not
an option as it would lead to major costs to the oper-
ators. For this reason, in this work, we assume a core
PT network (e.g., metro) that does not change, and we
only tackle the design of some bus lines, which comes
at a limited infrastructure cost. By focusing on bus
network design only, we aim to achieve important re-
duction of accessibility inequality with relatively low
expenses for the operator.
The contribution of this paper is a novel approach
to PT network design, in which the non-trivial inter-
dependencies involved into the accessibility metrics
are captured via a Message Passing Neural Network
(MPNN) (Wang et al., 2023; Gilmer et al., 2017;
Maskey et al., 2022) and a Deep Reinforcement
Learning (RL) agent. While MPNN and RL have
been used to solve canonical optimization problems
on graphs, to the best of our knowledge we are the
first to use them for PT network design. To reduce in-
equality, we propose a simple yet effective approach,
consisting in using quantiles of the accessibility met-
rics as objective function.
Numerical results in a scenario inspired by Mon-
treal show that our method effectively reduces acces-
sibility inequality, more effectively than metaheuris-
tics classically used for PT design. This improvement
is due to the capability of the MPNN to capture the
structure of the PT network and its relation with the
PoIs, while metaheuristics do no learn any dependen-
cies and restrict themselves in randomly exploring the
space of designs.
2 RELATED WORK
Transport Network Design Problems (TNDPs), and
in particular Public Transport Network Design Prob-
lems (PTNDPs) can be at a strategic level or an oper-
ational level. At a strategic level, a PT planner aims
to decide the route of the different lines as well as
their frequencies. At an operational level, a PT op-
erator organizes the service in order to match the de-
cisions taken at the strategic level, deciding precise
time tables, as well as crew and vehicle scheduling.
In this paper, we focus on PTNDPs at a strategic
level. Reviews of strategic-level PTNDPs are pro-
vided in (Farahani et al., 2013; Gkiotsalitis, 2022).
The methods generally used to solve PTNDPs can be
divided into two categories: mathematical program-
ming methods (Section 2.1) and search-based heuris-
tics methods (Section 2.2). We use instead graph-
based reinforcement learning (Section 2.3). The latter
has been applied to solve several combinatorial prob-
lems and has also few applications in Transport. How-
ever, it has not been used for PT planning (lines de-
sign), with one exception (Yoo et al., 2023). How-
ever, (Yoo et al., 2023) only designed the bus network
based on some cost function. Their article did not
consider the impact of the structure of pre-existing
metro lines on the design of new bus lines, nor did
it consider optimizing the inequality of accessibility.
Their method is difficult to apply to our problem.
2.1 Mathematical Programming
Methods
TNDPs usually be formulated as non-linear program-
ming models. Solvers are used to solve these mod-
els. To ensure that their models are reasonable, they
usually need to set numerous constraints (Wei et al.,
2021; Quynh and Thuan, 2018). For a realistic sized
problem, it is difficult to find a suitable solution with
this method (Chakroborty, 2003). Therefore, instead
of considering a real city, they turned to represent-
ing it with a regular geometrical pattern, such as the
Continuous Approximation method (Calabro et al.,
2023). This method can indeed crudely describe any
city through some characteristics, but in the end they
cannot be applied to any real city. Because real cities
are much more complex than abstract regular geomet-
rical shapes.
Some works try to achieve the purpose of deal-
ing with large-scale real cities by adding more con-
straints, which often limit the solution space. These
works are (Guti
´
errez-Jarpa et al., 2018), which first
proposed to design metro lines in some predefined
corridors, and these corridors with higher passenger
traffic were chosen by a Greedy generation heuristic
step before any optimization, and (Wei et al., 2019),
conducted a real-world case study by predefining cor-
ridors and solving a bi-objective mixed-integer linear
programming model. However, all these works highly
rely on an expert guidance to help reduce the potential
solution space, in other words, the results vary with
different expert guidance. Expert guidance does not
ensure that the optimal solution is not eliminated.
ICAART 2025 - 17th International Conference on Agents and Artificial Intelligence
620
2.2 Heuristics Methods
The most commonly used search-based heuristic
methods are Simulated Annealing, Tabu Search, and
Genetic Algorithm. Their common method is to ini-
tialize a PT design and then gradually optimize the
PT design by changing it through heuristics. (Schit-
tekat et al., 2013) develops a bi-level metaheuristic
to find the optimal solution of school bus routing
problem. The upper level repeats greedy randomized
adaptive search followed by a variable neighborhood
descent n
max
times and then finds the best solution
to bus stops assignment among these n
max
times of
search, while the lower level finds an exact solution to
a sub-problem of assigning students to stops by solv-
ing a mathematical programming problem. (Owais
and Osman, 2018) uses a Genetic Algorithm to gen-
erate a bus route network from With only the Ori-
gin–Destination matrix and the network structure of
an existing transportation network. In the process of
using GA to evolve route design, the connectivity of
routes is ensured at every stage of the GA. (Kova-
lyov et al., 2020) uses a Particle Swarm Optimiza-
tion method to solve the optimal planning problem
of replacing traditional Public Transport with elec-
tric. (Barcel
´
o et al., 2018) emphasizes the application
of metaheuristic algorithms in problems of managing
city logistics systems. These methods have a com-
mon limitation, that is, during the iterative process,
some basic characteristics of the graph are retained,
such as connectivity, which is not needed in reality.
Therefore, they often can only find local optimal so-
lutions.
Considering all of the above, we need to design a
generic algorithm which requires fewer constraints. It
does not require expert experience, which is the lim-
itation of Mathematical programming method, and it
also can no longer retain some unreasonable charac-
teristics of graph, which is the limitation of Search-
based heuristics method. Therefore, we chose the RL-
based method.
Closer to our work, the work in (Yoo et al., 2023)
solved TNDP by directly using RL, and did not ex-
tract the information of PT graph. The work (Darwish
et al., 2020) used Transformer architecture to pro-
duce the nodes and the graph embeddings, and then
solved TNDP via RL. But to make their method fea-
sible, they assumed that the network is a connected
graph, which is not needed in our paper. The work
(Wei et al., 2020) presented a RL-based method to
solve the city metro network expansion problem. Our
main difference lies in the different methods used to
extract the information on PT graph. They used two
1-dimensional convolutional neural networks to cal-
culate the embeddings for the stations. However, the
graph structure is complex, we believe only applying
1-dimensional convolutional neural network is insuf-
ficient. In this sense, we proposed to use Message
Passing Neural Network (MPNN) to extract the infor-
mation on PT graph.
2.3 Graph-Based Reinforcement
Learning Applications
Some works using Graph-based RL to solve other
problems are as follows: The work (Barrett et al.,
2020) already coupled it successfully to a DQN on
traditional combinatorial problem, such as max-cut
problem. The work (Duan et al., 2020) first extracted
the information of graphs, based on the recurrent neu-
ral networks (RNN), and then combined it with RL to
solve the Vehicle Routing Problem. The work (Yoon
et al., 2021) improved the transferability of the so-
lution to traffic signal control problem by combin-
ing Reinforcement learning and MPNN. The work
(K
¨
oksal Ahmed et al., 2022) proposed an algorithm
for the vehicle fleet scheduling problem, by integrat-
ing a reinforcement learning approach with a genetic
algorithm. The reinforcement learning is used to de-
cide parameters of genetic algorithm.
3 MODEL
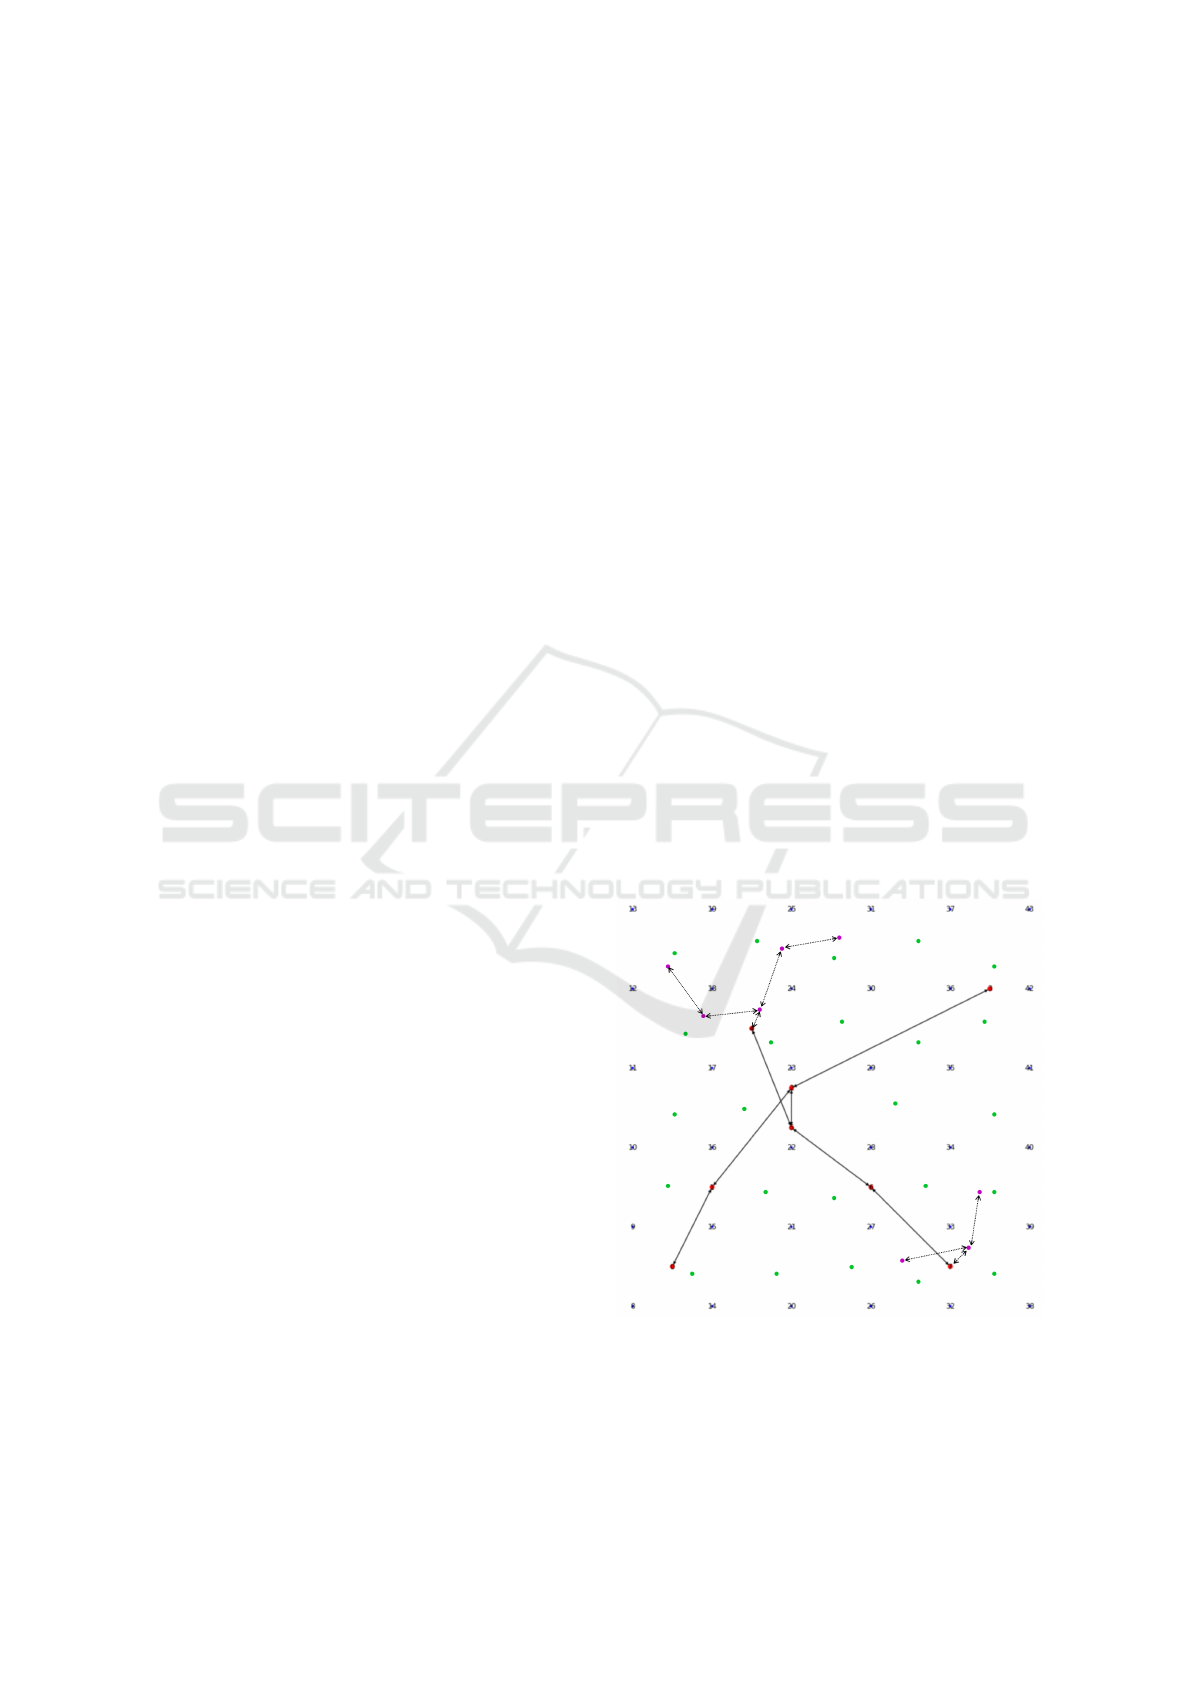
Figure 1: Model of Public Transit: PT graph G has 2 metro
lines (red points represent metro stations) and 2 bus lines
(purple points represent bus stops), in addition, the blue
points are the centroids, and the green points are the points
of interest.
Public Transport Network Design for Equality of Accessibility via Message Passing Neural Networks and Reinforcement Learning
621

3.1 Model of Territory and of Public
Transport
We partition the study area with a regular tessella-
tion (here we adopt square tiles, but any regular shape
can be used), as in Figure 1. The center of each
tile is called centroid (blue points in Figure 1). The
study area also contains Points of Interest (PoIs) often
called ”opportunities” in the literature about accessi-
bility. PoIs can be shops, jobs, schools, restaurants,
etc. PoIs are depicted as green points in Figure 1.
As illustrated in Figure 1, our model of PT is com-
posed of:
1. Metro lines and metro stations (red points).
2. Bus lines and bus stops (purple points).
Changing metro lines is very costly and time con-
suming. On the other hand, redesigning bus lines re-
quires much less infrastructure cost and can be done
in shorter time. In this paper, we only focus on re-
designing bus lines and keep metro lines unchanged.
We model PT as a graph G= (V,E,L), where V is
the set of nodes, composed of centroids and PT stops
V = C
S
B
S
B, E is the set of edges, and L is the set
of lines. Any PT line l (metro line or bus line) is a
sequence of PT stops, linked by edges e ∈ E. Each
edge has a weight, which represents the time used by
a vehicle to go from a PT stop to another. A PT line l
also has a headway t
l
, which is the time between two
vehicle departures in the same direction. Since we
only optimize bus lines, headway t
l
of any metro line
remains unchanged. For metro lines, headway t
l
can
be obtained from real data. Instead, since we build
bus lines, we need to calculate ourselves headway t
l
for any bus line l. Once we decide the sequence of
bus stops composing l, we can get the total length of
the line d
l
, to go from the first to the last stop. We
assume number N
l
of buses deployed on line l is fixed
in advance. In this case, the cost is always the same
since the total fleet size (= kN
l
) is fixed. Denoting
with s
b
the bus speed, headway t
l
is:
t
l
=
d
l
s
b
· N
l
. (1)
In reality, the headway could also be a bit higher, due
to the time spent by the bus at the terminal before
starting the next run.
As in Figure 1, we include in G the set of cen-
troids C and the set of points of interest P. We also
include edges (in the two directions) between any cen-
troid and all PT stops, between any point of interest
and all PT stops, and between any centroid and any
point of interest. Note that V is defined as the set of
nodes, C is a subset of V.
Figure 2: Accessibility example: the location on the left en-
joys high accessibility as, departing from it, one can reach
many PoIs in little time. On the right, instead, accessibility
is poor: few PoIs are reachable and high travel times are
required. The left and right locations are typical of city cen-
ters and suburbs, respectively.
For a trip from centroid c to point of interest poi, a
traveler can choose between different modes of travel.
For example, a traveler could simply walk to poi at
speed s
w
or walk from centroid c to a PT stop (metro
station or bus stop), go via PT to another stop, and
from there walk to the destination poi. If the stops
of two lines are close enough, we will also add the
edge between two stops to indicate that passengers
can transfer by walking. We consider an average wait-
ing time t
l
′
/2 at this station. We assume that travelers
always take the shortest path, i.e., the one that allows
to arrive at destination with the least time.
3.2 Accessibility
Accessibility measures the ease of reaching PoIs
via PT. A simplified depiction is given in Figure 2.
Accessibility depends on both land use (which de-
termines where PoIs are) and the transport system
(which determines the time to reach each PoI). There
are several ways of mathematically defining accessi-
bility. We define the accessibility of centroid c as:
acc(c) =
∑
poi∈P
max
0,1 −
T
c,poi
T
max
, (2)
where T
c,poi
is the shortest travel time from cen-
troid c to point of interest poi and T
max
is a prede-
fined threshold for travel time (e.g., 30 mins). Intu-
itively, acc(c) measures the number of PoIs that can
be reached by individuals departing from centroid c,
within time T
max
. Such PoIs are weighted by the time
to reach them, so that the closer a PoI, the more it con-
tributes to accessibility. Our definition is a combina-
tion of two classic definitions of accessibility, namely
the isochrone and gravity-based (Miller, 2020). The
purely isochrone definition of accessibility has the is-
sue of counting all PoIs the same, despite the dif-
ference in travel time to reach time. On the other
hand, the purely gravity based definition of accessibil-
ity, factors in all PoIs, even those that would require
ICAART 2025 - 17th International Conference on Agents and Artificial Intelligence
622

a prohibitive travel time. By combining the two as-
pects, we solve the aforementioned limitations. Note
that accessibility is agnostic to demand: it does not
describe where people currently go but it measures
where they potentically go (Miller, 2020). When
modifying the PT structure, we modify this “potential
of mobility” and thus we also impact where people
will go. For this reason, mixing current demand with
the definition of accessibility would be misleading, as
current demand is implicitly invalidated by PT design
actions.
We define the global accessibility of graph G as
acc(G) =
∑
c∈C
acc(c). (3)
Classic efficiency-based optimization of PT would
aim to maximize acc(G). Instead, our aim is to re-
duce the inequality in the geographical distribution of
accessibility, and thus we choose to consider the ac-
cessibility of the centroids that suffer from the worst
accessibility, as we aim to concentrate improvement
in such zones.
One could be tempted to apply max-min optimiza-
tion, trying to maximize the lowest accessibility in the
territory. However, when we tried that, we obtained
poor results. Indeed, we were ending up improving
areas that were remote and often uninhabited. Of-
ten, the improvement was enjoyed by too few loca-
tions. We therefore propose to maximize some bot-
tom quantile of the accessibility distribution. To the
best of our knowledge, this simple yet effective idea
has not been explored so far. We define the following
accessibility metric, related to the qth quantile:
acc
q
(G) =
∑
c∈C
q
acc(c), (4)
where C
q
defines the set containing the q% of cen-
troids with the least accessibility. Note that acc(G) =
acc
100
(G).
3.3 Problem Definition
Let us consider a PT graph G and a set B of n
b
can-
didate bus stops. Set B is contained in set V of nodes
of G. Set B = V \ C \ B is the set of non candidate
stops, i.e., the ones that will not be used to create the
new lines.
In broad terms, we consider the problem of the PT
operator to design k bus lines {l
1
,. ..,l
k
} (where num-
ber k is fixed a-priori), passing by these n
b
bus stops,
in order to reduce inequality of accessibility. Any stop
in B may be already part of pre-existing lines or not.
The problem at hand may emerge in case a PT op-
erator wishes to build additional bus lines, passing by
stops B. Another case is when a PT operator wishes to
redesign current bus lines, while reusing current bus
stops.
In quantitative terms, we wish to find graph G
∗
,
which is as G but also contains additional lines
l
1
,. ..,l
k
, such that acc
q
(G) is maximized. Specially,
if we define:
x
i, j
=
(
1, if bus stop j in line l
i
.
0, if bus stop j not in line l
i
.
(5)
We aim to solve the following optimization
max
σ(l
1
),σ(l
2
),...,σ(l
k
)
acc
q
(G), (6)
subject to the following constraint:
k
∑
i=1
x
i, j
= 1, ∀ j = 1,2...,n
b
. (7)
n
b
∑
j=1
x
i, j
≥ 2, ∀i = 1,2...,k. (8)
According to the values of x
i, j
, we can define each
line:
l
i
= {b
i
1
,. ..,b
i
n
i
},∀i = 1,2...,k. (9)
Calculating accessibility needs to find shortest path
in current PT graph, which makes impossible to give
specific formulation of accessibility. Therefore, this
problem belongs to the integer programming of a
black-box function. Constraint 7 ensures that each
candidate stop is assigned to a line. With this con-
straint, we are forbidding a node to be part of multiple
lines. However, this limitation can be easily removed
by “duplicating” the same real stop into multiple can-
ditate stops in our model. Constraint 8 means that
each line has at least two bus stops. In addition to de-
termining which stops each line contains based on the
value of x
i, j
and Constraint 9, the permutation func-
tion σ(l
i
) (in Formulation 6) is also needed to deter-
mine the order of the stops in each line l
i
.
Note that maximizing the accessibility of the bot-
tom quantiles means, indeed, to improve the accessi-
bility of the poorest locations. Observe that, selecting
only the location with the worst accessibility as the
objective function generally returned, in our prelimi-
nary experiments, not reasonable results, as it concen-
trates all the optimization effort to just few, possibly
very remote, locations, where improving accessibil-
ity is anyways hopeless. Our idea of maximizing the
bottom quantiles avoid this kind of biased results.
Public Transport Network Design for Equality of Accessibility via Message Passing Neural Networks and Reinforcement Learning
623

4 RESOLUTION METHOD
BASED ON GRAPH
REINFORCEMENT LEARNING
We decompose our problem (§3.3) as a bi-level opti-
mization: in the upper level, we partition the candi-
date bus stops in k subsets. In the lower level, each
subset will be transformed in a line, deciding the or-
der of the stops.
4.1 Markov Decision Process
Formulation
Let us denote by G the initial graph, i.e., the one when
no new bus lines have yet been added. We model the
upper level problem as the following Markov Deci-
sion Problem (MDP):
• States. A state is a partition S = (l
1
,. ..,l
k
) of can-
didate stops, where l
i
= {b
i
1
,. ..,b
i
n
i
} is the set of
bus stops assigned to line l
i
.
1
Each bus stop is as-
signed to a single line. Given any state S, we build
the line corresponding set l
i
of stops, i = 1,.. ., k.
To transform set l
i
in a line we need to decide the
order in which the stops in l
i
will be visited. Such
an order is calculated via a heuristic (Section 4.4).
Given sate S = (l
1
,. ..,l
k
) and having defined the
lines corresponding to l
i
,i = 1,. .. ,k, we add to
graph G the edges corresponding to those lines
and obtain a new graph G(S).
• Actions. At each step, our optimization agent
shifts a bus stop b
i
from its current line l
o
to a
target line l
t
. The action is defined by a tuple
a = (b
i
,l
t
). The state changes from S to S
′
: state S
′
is equal to S, except for line l
o
which becomes l
o
=
l
o
\ {b
i
}, and for l
t
, which becomes l
t
= l
t
S
{b
i
}.
The action of changing a bus stop to its own line
is not admitted. Observe that ours is a Determin-
istic MDP (Dekel and Hazan, 2013), i.e., arrival
state S
′
can be deterministically calculated from
departing state S and action a.
• Rewards. The instantaneous reward collected
when applying action a = (b
i
,l
t
) on state S, is
r(S,a) = acc
q
G(S
′
)
− acc
q
(G(S)), (10)
where parameter q must be chosen in advance.
• Policy: During training, our agent follows an ε-
greedy policy. At test time, actions are chosen
greedily with respect to the Q-values but our agent
keeps exploring with a random action every time
it finds a local optima.
1
For simplicity of notation, we use the same symbol l
i
to denote a line and also the set of stops assigned to it.
The sizes of the state space and the action space
are k · n
b
, considering a matrix with k lines and n
b
bus
stops can represent any state and action.
4.2 High-Level View of the
Optimization Approach
Due to the high size of the action and state spaces,
enumerating all the states and actions and learning
a Q-function that takes directly those states and ac-
tions as input is hopeless. Therefore, as common in
graph-related optimization tasks, we resort to a Mes-
sage Passing Neural Network (MPNN) (Wang et al.,
2023; Gilmer et al., 2017; Hameed and Schwung,
2023; Maskey et al., 2022). Via a MPNN, we embed
each node in a low dimension Euclidean space. Such
representation captures the “role” of that node within
the graph, based on the direct or indirect connections
with the other nodes. The process of node embedding
is thus able to capture the structure of a graph, so that
the RL agent can take decisions that take such struc-
ture into account.
A MPNN takes as input PT graph G(S) of current
state S, then it outputs the Q value for each action.
Next, the Greedy Policy performs an action accord-
ing to the Q values. At last, the reward, which is the
change of accessibility metric, helps to update param-
eters of MPNN. The following section will introduce
MPNN in more detail. Every time we shift a bus stop
from a bus line to another line, a reasonable method of
deleting and inserting bus stops in a line is presented
in Section 4.4.
4.3 Message Passing Neural Network
Let us associate to each candidate stop b a feature vec-
tor x
b
. Let us denote with X the matrix of the feature
vectors of all stops and with M
adj
the adjacency ma-
trix, where element (i, j) is 1 if there is a line in which
bus stop b
i
comes right before b
j
, and 0 otherwise.
A MPNN calculates a vector µ
b
, called embed-
ding, for each candidate bus stop b. Embedding µ
b
is a function of feature vector x
b
, of feature matrix X ,
and of adjacency matrix M
adj
.
In the following, all vectors like Θ
j
denote param-
eters that learned during training. The embedding of
bus stop b is initialized as
µ
0
b
= f (x
b
,Θ
1
) ∈ R
n
. (11)
The vector of edge embeddings, one per each edge, is
initialized as
w
0
= g(M
adj
,X,Θ
2
) ∈ R
m
. (12)
ICAART 2025 - 17th International Conference on Agents and Artificial Intelligence
624

Let us denote with N (b) the neighbor bus stops of
bus stop b. Note that since the bus lines change from
a state S to another, N (b) may also changes for bus
stop b.
The information is then shared to each of the
nodes’ neighbors through T rounds of messages. The
message passed to candidate stop b at round t + 1 is:
m
t+1
b
= M(µ
t
b
,{µ
t
u
}
u∈N (b)
,{w
t
ub
}
u∈N (b)}
,Θ
t
3
) ∈ R
n
′
,
(13)
where w
t
ub
is the embedding of edge between bus
stop u and bus stop b after t times iterations.
Embedding u
t+1
b
of candidate stop b by message:
µ
t+1
b
= U(µ
t
b
,m
t+1
b
,Θ
t
4
) ∈ R
n
, (14)
M and U are respectively message and update func-
tions at round t. After T rounds of message passing, a
prediction is produced by some Readout function, R.
In our case, the prediction is the set of Q-values corre-
sponding to the actions of the changing bus stops and
their target line:
{Q(S,a)}
a∈A
= R({µ
T
b
}
b∈B
,Θ
5
), (15)
where A is the set of actions, and B is the set of bus
stops. Note that µ
T
b
is calculated via Formula 13 and
Formula 14, thus varys for different state S. Mes-
sage function M, Update function U, and Readout
function R, as well as the embedding functions f
and g, are all neural network layers with learnable
weights {Θ
1
,Θ
2
,{Θ
t
3
}
t
,{Θ
t
4
}
t
,Θ
5
}. Every time our
agent takes an action and gets a reward r. The One-
Step Q-learning loss is:
Loss(S,a) = (γ · max
a
′
Q(S
′
,a
′
) + r − Q(S
′
,a))
2
,
(16)
where γ is a Discount factor. We update learnable
weights via Stochastic Gradient Descent of loss func-
tion 16. (Khalil et al., 2017) also used the same loss
to deal with the combination problem on the graph.
From (Blakely et al., 2021), the total time complexity
of the forward step and the backward step of MPNN is
O(T · (|V| + |E|)) for sparse matrix of PT graph with
embedding vector dimension unchanged. Combined
with action space is k · n
b
in Section 4.1, the time cost
of each step is linearly related to the sum of the num-
ber of nodes and edges in the graph G.
4.4 Sorting Algorithm
Recall that state S is a partition (l
1
,. ..,l
k
) of set B
of candidates nodes. State S just establishes to which
line each candidate node belongs. However, to trans-
form any set l
i
into a line, a certain ordering of its
stops must be established.
In this section, we will introduce the method of
determining the order of bus stops. This optimal
method should also maximize our accessibility objec-
tive function. However, since it is a Traveler Sales-
man Problem, defining such a function seems utterly
complex or with a very high computational cost. Con-
sidering that order must be determined every time the
RL agent selects a new bus stop subset, we decided to
use the shortest path algorithm as a proxy for the max-
imum accessibility path algorithm. We understand
that this approach is suboptimal as we optimize dis-
tances, but accessibility is a measure completed over
the whole graph. Nevertheless, using this algorithm
optimizes the headway of our bus lines, and thus ren-
ders a good enough accessibility with low computa-
tional costs.
4.5 Reinforcement Learning Equality
Algorithm
Given the number of bus lines k and the PT network
G, we propose a Reinforcement Learning Equality al-
gorithm (Algorithm 1) to plan k bus lines efficiently,
in order to optimize the accessibility objective func-
tion acc
q
(·) (q = 20,50,100.). Our base idea is to
get a better state-action function Q by updating the
MPNN network. Note that only when our objec-
tive function value is better than before, we will up-
date our MPNN network. We still explore different
actions (and thus different graph configurations) for
each step, also the ones that decrease the score with
respect to the last graph obtained. We just remove
from exploration those graphs that are worse than the
initial one. If acc
q
(G) has not changed in the past cer-
tain iterations (e.g., 5 iterations), the episode will be
ended. Algorithm 1 terminates when a certain time
threshold (e.g., 1h) is exceeded. In fact, the initial
graph G of our algorithm can be different for each
episode. Therefore, it has the ability to learn among
different PT networks.
5 EVALUATION
5.1 Considered Scenario
To showcase our agent, we consider a simplified ver-
sion of Montreal. Note that we do not aim to set up
a realistic mobility scenario with all the needed de-
tails for transport planning. This would indeed re-
quire years of effort, by specialized transport consul-
tant companies, and it is out of our scope. Here, our
intention is to show that the proposed approach is ef-
fective from a methodological and algorithmic point
Public Transport Network Design for Equality of Accessibility via Message Passing Neural Networks and Reinforcement Learning
625
Data: Number of lines k, initial graphs G,
quantile q
Result: The best accessibility acc
q
best
while Running time threshold is exceeded do
Initialization: Randomly partition the
bus stops between the lines to obtain
initial state S;
Sort the lines (§4.4), and update G;
Set acc
q
best
= acc
q
(G);
while acc
q
(G) has not changed in the
past 5 iterations do
Predict Q = MPNN(G,S) (15);
Update the state with action
a = argmax
a
Q(S,a);
Sort each line l
i
(§4.4);
Calculate headway t
l
i
via (1) for
each l
i
;
Update graph G with the new bus
lines and headway ;
Compute acc
q
(G) (see (4)) ;
if acc
q
best
> acc
q
(G) then
Set acc
q
best
= acc
q
(G);
Compute loss via (16);
Update learnable weights
{Θ
1
,Θ
2
,{Θ
t
3
}
t
,{Θ
t
4
}
t
,Θ
5
} of
MPNN by Gradient Descent;
else
Continue;
end
end
end
Algorithm 1: Online Reinforcement Learning Equality al-
gorithm.
Figure 3: Accessibility of Montreal Metro network.
of view. For this reason, any cost-benefit analysis of
our resulting PT network in Montreal, and any de-
tailed environmental assesment is out of scope for this
algorithmic focused paper. Observed that one could
replace accessibility with cost or km traveles or any
other transport related metric. However, we chose to
focus on the most difficult metric among those used in
common PT design problem, as to optimize accessi-
bility quantiles requires the model to be able to deeply
capture the inter-relation between the graph and its
surrounding environment, as well as spatial inequali-
ties. This is the focus and the interest of this paper.
From the General Transit Feed Specification
(GTFS) data of Montreal ((STM, 2023)), we take the
station locations, the sequence of stations of all lines.
We assume the PT operators wishes to keep the metro
(subway) network as it is, but wishes to build bus lines
in order to reduce the inequality of the geographi-
cal distribution of accessibility. Therefore, set B of
candidate stops consists of all bus stops, while set B
of non-canidate stops are the metro stops. Figure 3
shows the accessibility distribution of accessibility re-
sulting from initial PT graph G of Montreal, which
we assume consists of only the current lines. These
assumptions may correspond to the case in which the
PT operator wishes to completely redesign bus lines
(so that we can remove all bus lines from our initial
graph G). The metro network is composed of 4 lines
of different sizes. It covers mostly the center of Mon-
treal, which delimits our environment boundaries. In
our case, bus stop locations can change over the year.
We wanted to check that our method conveys good re-
sults, no matter the set of stops. This is the reason that
our results are shown for 100 different instances of the
problem, each with a different set of stops. The real
locations of bus stops in Montreal can be easily added
to the training set as an instance. To establish prelim-
inary results, we first limit the number of bus stops to
an arbitrary low number of 72. We generate the bus
stops as follows. We tessellate the territory with a reg-
ular grid. Note that this tessellation is not necessarily
the same as the one described in Section 3.1. Within
each cell of such a grid a bus stop is created with a
random location within the cell. By generating bus
stop locations in this way, we ensure uniformity of
the bus stops on a larger scale. Consequently, all ar-
eas of the territory have access to the public transport
network to all regions. We extract points of interest
from Open Street Map (OpenStreetMap contributors,
2017) in combination with the Overpass API and as-
sign to the centroids the point of interest number in
their area. For the points of interest, we select some
of the main amenities in a city (schools, hospitals,
police stations, libraries, cinemas, banks, restaurants,
and bars). Some of these amenities present a distri-
bution which is relatively uniform over the map (e.g.,
schools) while some others have higher densities in
popular streets (e.g., restaurants). Scenario parame-
ters are in Table 1.
ICAART 2025 - 17th International Conference on Agents and Artificial Intelligence
626

Figure 4: Accessibility ratio (
acc
a
(RL)
acc
b
(random)
, a,b = 20,50 or 100) via our Reinforcement Learning Equality algorithm (Algo-
rithm 1) against the random search algorithm. x-axis shows different metrics of the Random search algorithm, and the labels
show the different metrics used by RL methods.
Table 1: Scenario parameters.
Parameter Value
Number of bus stops n
bs
72
Number of lines k 3
Maximum accessibility time T
max
30 minutes
Walking speed s
w
(Ali et al., 2018) 4.5 km/h
Bus speed s
b
(Ishaq and Cats, 2020) 28km/h
Fleet size per line N
l
10
Distance between adjacent centroids 1km
Discount factor γ 0.95
5.2 Baselines
We compare the performance of our algorithm to two
baselines. To compare the algorithms, we define a
maximum running time of 1-hour for each method
and check which is the best bus lines deployment
found. Specially, 1 hour is the training time for our
algorithm, our testing time is too short and can be
ignored. For Baselines, they keep looking for better
graphs within one hour. After one hour, we simply
stop searching and output the current optimal graph
of Baselines.
5.2.1 Random Search Algorithm
Random states of the form S = (l
1
,. ..,l
k
) are gen-
erated, each corresponding to a random partition of
set B of candidate stops. At every generated state S =
(l
1
,. ..,l
k
), each set l
i
is sorted as in Section 4.4
to generate the corresponding lines. Then the cor-
responding graph G
rnd
is constructed, and accessi-
bility acc
q
(G
rnd
) is computed. This process is re-
peated until the running time threshold is exceeded.
The largest value of acc
q
(G
rnd
) found at that point
is then returned. This random search algorithm has
the advantage over our algorithm to visit very diverse
states and no time for computing node embeddings,
rewards, etc. The number of states visited by this al-
gorithm is much larger than the one visited by our
approach, within the same running time threshold.
5.2.2 Genetic Algorithm
The second baseline is a genetic algorithm (Algo-
rithm 2). It is a popular metaheuristic to solve combi-
natorial problems, and PT design problems in partic-
ular (Farahani et al., 2013). In transit network design,
state-of-the-art algorithms are generally metaheuris-
tic. There are many flavors of GA for transit net-
work design. Our GA algorithm is an effort to repro-
duce those. However, due to difficult reproducibility
of such methods, we cannot claim our GA algorithm
is exactly the same as the one in the state of the art.
We are sure that we did our best to improve our GA
algorithm, in the effort to have it represent the state
of the art. We adopt acc
q
(G) as the fitness function.
Next, the design of the evolutionary functions must
be done carefully so that the new generations inherit
good genes from their parents. Therefore, the most
important function that must be modified for that case
is the crossover function. More popular approaches,
like Order Crossover 1 (OX1) preserve relative order
of the states and thus their structure, are used in sim-
ilar problems like TSP (Kora and Yadlapalli, 2017)
and VRP (Prins, 2004). Children can benefit from ad-
vantageous orderings of the parent nodes, as from our
experience, close nodes (sorted by the SORT func-
tion) are often good to increase accessibility.
5.3 Results
For the first comparison, we train our Reinforcement
Learning Equality agent and test it on the same bus
stop distribution. The random search baseline run
with different accessibility metric. In Figure 4, the
different colors correspond to different accessibility
metrics adopted as reward of our RL algorithm. Fig-
Public Transport Network Design for Equality of Accessibility via Message Passing Neural Networks and Reinforcement Learning
627
Input: Size n
pop
of the population, number
of lines n
lines
, number of parents n
par
per
generation, timeout t
limit
of the benchmark,
probability P
mut
of an attribute to mutate ;
Result: The best accessibility over all
generations acc
best
.
Initialization: Initialize
pop
0
= (I
1
,. ..,I
n
pop
) at generation 0 as
individuals with random partitions of the
bus stops between the lines. Sort the lines of
each individual. Compute acc
best
0
;
while Running time threshold is exceeded do
Select n
par
best parents =
Tournament(pop,acc
20
) ;
while pop
i
is filled with n
pop
children. do
p
1
, p
2
= Sample(parents,2) ;
c = OX(p
1
, p
2
) ;
c = Mutate(c,P
mut
) ;
Sort the lines of each child
c = SORT (c) ;
pop
i
.Append(c) ;
end
Compute acc
best
i
= max(acc
q
(pop)) ;
end
Algorithm 2: Genetic algorithm.
ure 4 shows that our approach outperforms the ran-
dom baseline by 10%-15% when trained and tested
on the same accessibility metric (e.g., the agent op-
timizes acc
20
with its reward function and is tested
on the same metric). Our algorithm also improves
the other different accessibility metrics than the one
it has been trained by an average ratio of 5% over the
baseline. Only the agent trained on acc
20
performs
worse than the random baseline. Because when we
optimize PT with equality (acc
20
) as the optimization
goal, we may lose some efficiency (acc
100
). Planning
bus lines need to make a trade-off between equality
and efficiency. It should be noted that the balance be-
tween equality and efficiency is a “political” choice,
which the transport planner should choose, and it is
not possible to define the “best” value of the quantile.
A practical option for the transport planner could be
to obtain different networks, with different quantiles,
and then compare them a posteriori to check which
one is the most adapted to the scenario at hand. In any
case, our method is agnostic to the “political” choice
of q%.
Our agent is also able to apply to different bus stop
distributions. We assume that each bus stop remains
in the same grid cell, but its position is changed for
different distributions. Now we select acc
20
as our
accessibility metric for training and testing on a set of
100 PT graphs with different bus stop distributions.
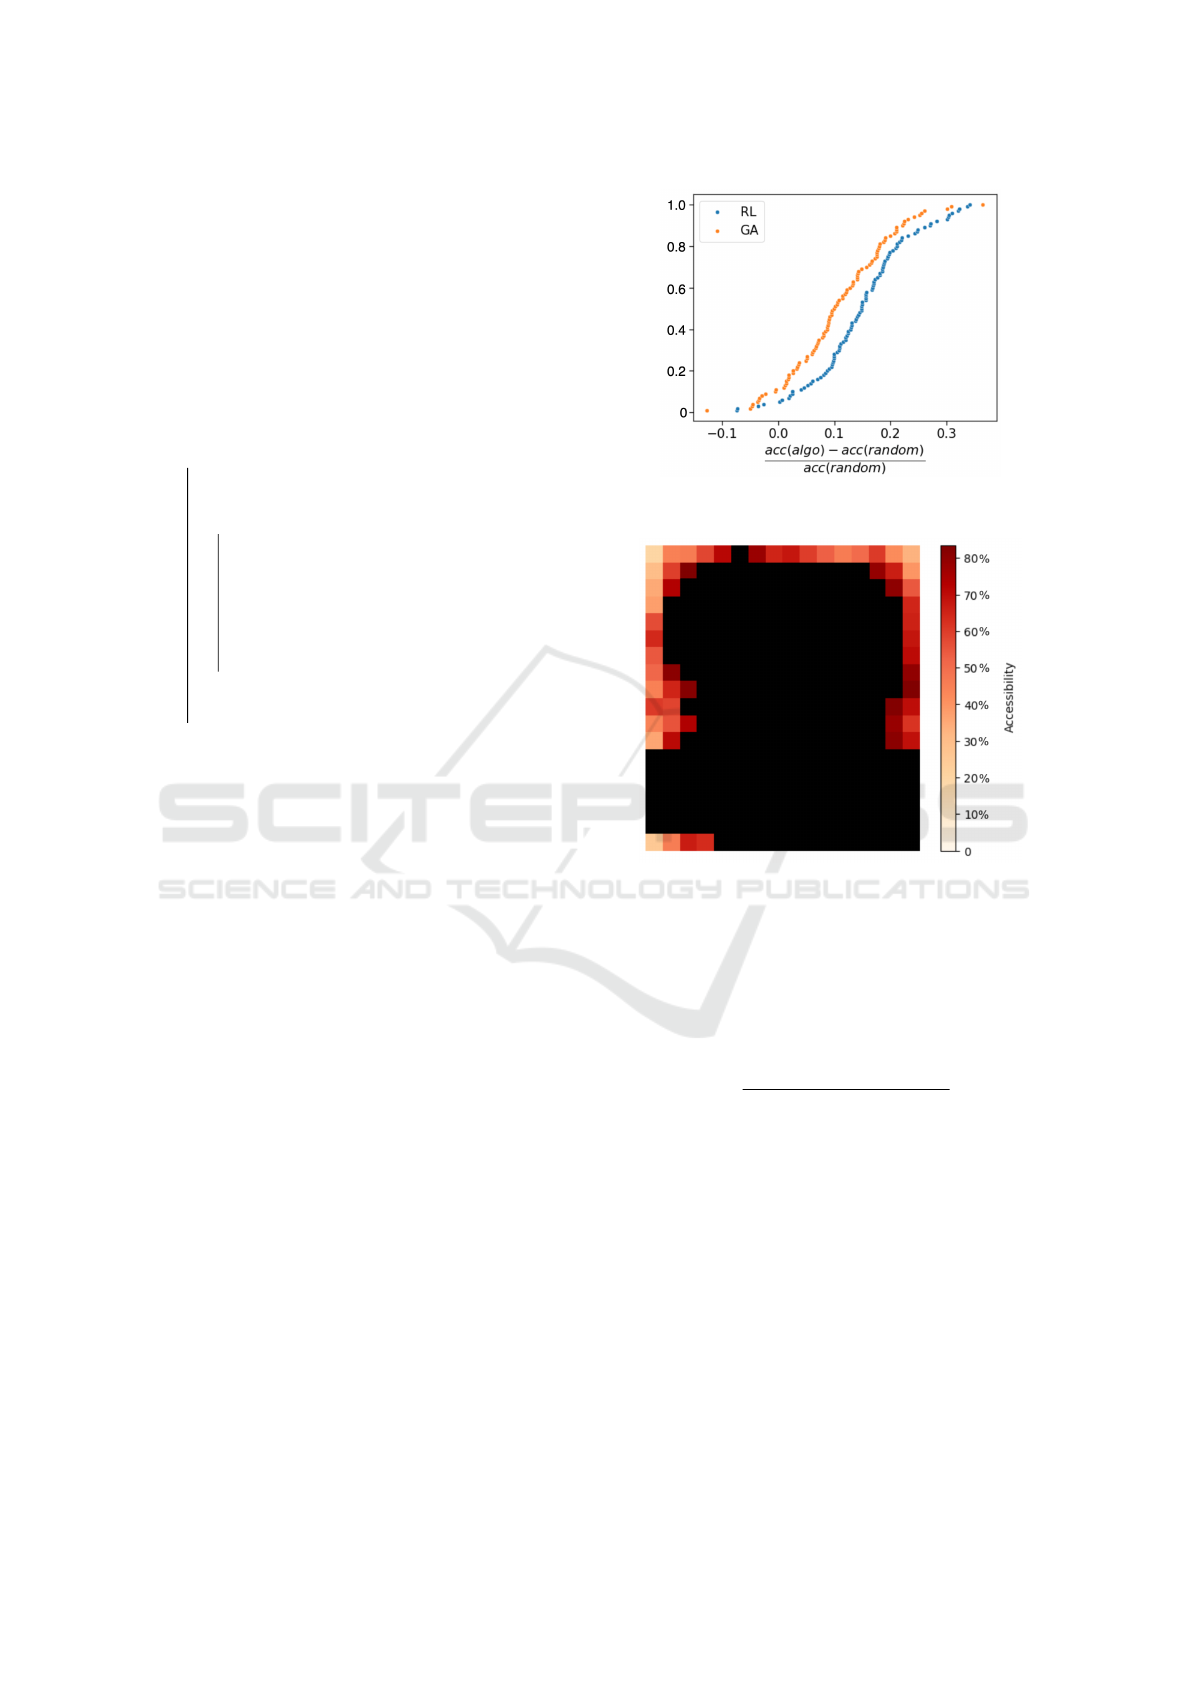
Figure 5: CDF of acc
20
improvements of different algo-
rithms comparing with random baseline.
Figure 6: Heatmap of percentage improvement of accessi-
bility (%) via Reinforcement Learning Equality algorithm
against the random baseline on underserved areas (The
darker red areas indicate that our approach improves more
obviously than the random baseline in these areas. Black
areas with the best 80% accessibility are not considered).
In Fig. 5, we plot the value of CDF (y-axis) of acc
20
improvements value
R =
acc(algo) − acc(random)
acc(random)
, (17)
where acc(random) is the optimized acc
20
value by
the random search, and acc(algo) is the optimized
acc
20
value by Algorithm 1 or GA. The higher the
value of R (x-axis), the better the Algorithm 1 or the
GA than the random baseline. We observe in both
cases that R follow a normal distribution. Using this
data, we conduct a t-test with the null hypothesis (H
0
)
that mean(R) = 0. We run the t-test and get a T-
statistic value of 17. From the p-value p = 3 ∗ 10
−31
,
we can reject H
0
with confidence more than 99.9%.
Thus, we confirm that our approach work better than
random baseline on graphs with different bus stop
distributions. Similarly, the Genetic Algorithm per-
forms better than the random baseline. Using a sim-
ICAART 2025 - 17th International Conference on Agents and Artificial Intelligence
628

ilar procedure to compare our Reinforcement Learn-
ing Equality algorithm and the Genetic algorithm, we
show that our approach performs better on different
test graphs with confidence > 99.9% (the T-statistic
value is 8).
We next test the performance of our algorithm
on the actual geography of Montreal. Considering
acc
20
as the objective function, so our algorithm fo-
cuses more on optimizing those areas with the 20%
worst accessibility. We also calculate the value of im-
provements compared to Random Baseline (acc
20
RL
−
acc
20
Random
) for each centroid with the lowest accessi-
bility in the initial graph. Figure 6 shows that our ap-
proach preform better than random baseline in these
areas, the improvement in most of these areas ex-
ceeded 40%.
6 CONCLUSION
In this paper, we proposed an approach that combined
Message Passing Neural Networks (MPNN) and Re-
inforcement Learning (RL) to optimize bus line de-
sign. The objective is to reduce the inequality in
the distribution of accessibility provided via Public
Transport (PT). Our results showed that MPNN and
RL are more effective than commonly used meta-
heuristics, as they can capture the PT graph structure
and learn the dependencies between lines and the dis-
tribution of Points of Interest, where meta-heursitcs
restrict themselves to a random exploration of the so-
lution space.
In future work, we will test how our method gener-
alizes to different metro networks, realistically mod-
eled via open data, and how it scales when the prob-
lem involves much more bus stops than considered
here. In fact, different transit modes can be repre-
sented by different graphs. We can connect these
graphs to each other to form a multilayer graph. Then,
our method can be applied with modifications on the
multilayer graph. Of course, for metro networks, once
the network infrastructure is put in place, it cannot
be easily modified, as with bus lines. Results from
the algorithm would thus require a thorough “politi-
cal evaluation” of the results of the algorithm before
implementation. For example, We can set different
weights so that the algorithm prefers to modify bus
lines rather than metro lines. Moreover, we expect
even better results when allowing the same bus stop
to be part of multiple bus lines (which is not the case
in this work).
The main takeaway of this paper is that combin-
ing MPNN and RL is promising to solve PT network
design, at a strategic planning phase.
ACKNOWLEDGEMENTS
This work has been supported by the French ANR re-
search project MuTAS (ANR-21-CE22-0025-01) and
by Hi!Paris - Paris Artificial Intelligence for Society.
REFERENCES
Ali, M. F. M., Abustan, M. S., Talib, S. H. A., Abustan, I.,
Abd Rahman, N., and Gotoh, H. (2018). A case study
on the walking speed of pedestrian at the bus terminal
area. In E3S Web of Conferences, volume 34, page
01023. EDP Sciences.
Anable, J. (2005). ‘complacent car addicts’ or ‘aspir-
ing environmentalists’? identifying travel behaviour
segments using attitude theory. Transport policy,
12(1):65–78.
Barcel
´
o, J., Grzybowska, H., and Orozco-Leyva, A. (2018).
City logistics.
Barrett, T., Clements, W., Foerster, J., and Lvovsky, A.
(2020). Exploratory combinatorial optimization with
reinforcement learning. In Proceedings of the AAAI
conference on artificial intelligence, volume 34, pages
3243–3250.
Blakely, D., Lanchantin, J., and Qi, Y. (2021). Time and
space complexity of graph convolutional networks.
Accessed on: Dec, 31:2021.
Calabro, G., Araldo, A., Oh, S., Seshadri, R., Inturri,
G., and Ben-Akiva, M. (2023). Adaptive transit de-
sign: Optimizing fixed and demand responsive multi-
modal transportation via continuous approximation.
Transportation Research Part A: Policy and Practice,
171:103643.
Chakroborty, P. (2003). Genetic algorithms for optimal ur-
ban transit network design. Computer-Aided Civil and
Infrastructure Engineering, 18(3):184–200.
Darwish, A., Khalil, M., and Badawi, K. (2020). Optimis-
ing public bus transit networks using deep reinforce-
ment learning. In 2020 IEEE 23rd International Con-
ference on Intelligent Transportation Systems (ITSC),
pages 1–7. IEEE.
Dekel, O. and Hazan, E. (2013). Better rates for any adver-
sarial deterministic mdp. In International Conference
on Machine Learning, pages 675–683. PMLR.
Duan, L., Zhan, Y., Hu, H., Gong, Y., Wei, J., Zhang, X.,
and Xu, Y. (2020). Efficiently solving the practical
vehicle routing problem: A novel joint learning ap-
proach. In Proceedings of the 26th ACM SIGKDD
international conference on knowledge discovery &
data mining, pages 3054–3063.
EU, E. P. (2019). CO
2
emissions from cars: facts and fig-
ures (infographics). https://www.europarl.europa.eu/
topics/en/article/20190313STO31218.
Farahani, R. Z., Miandoabchi, E., Szeto, W. Y., and Rashidi,
H. (2013). A review of urban transportation network
design problems. European journal of operational re-
search, 229(2):281–302.
Public Transport Network Design for Equality of Accessibility via Message Passing Neural Networks and Reinforcement Learning
629

Gilmer, J., Schoenholz, S. S., Riley, P. F., Vinyals, O., and
Dahl, G. E. (2017). Neural message passing for quan-
tum chemistry. In International conference on ma-
chine learning, pages 1263–1272. PMLR.
Gkiotsalitis, K. (2022). Public transport optimization.
Springer.
Guti
´
errez-Jarpa, G., Laporte, G., and Marianov, V. (2018).
Corridor-based metro network design with travel flow
capture. Computers & Operations Research, 89:58–
67.
Hameed, M. S. A. and Schwung, A. (2023). Graph neu-
ral networks-based scheduler for production planning
problems using reinforcement learning. Journal of
Manufacturing Systems, 69:91–102.
Ishaq, R. and Cats, O. (2020). Designing bus rapid transit
systems: Lessons on service reliability and operations.
Case Studies on Transport Policy, 8(3):946–953.
Khalil, E., Dai, H., Zhang, Y., Dilkina, B., and Song, L.
(2017). Learning combinatorial optimization algo-
rithms over graphs. Advances in neural information
processing systems, 30.
K
¨
oksal Ahmed, E., Li, Z., Veeravalli, B., and Ren, S.
(2022). Reinforcement learning-enabled genetic algo-
rithm for school bus scheduling. Journal of Intelligent
Transportation Systems, 26(3):269–283.
Kora, P. and Yadlapalli, P. (2017). Crossover operators in
genetic algorithms: A review. International Journal
of Computer Applications, 162(10).
Kovalyov, M. Y., Rozin, B. M., and Guschinsky, N. (2020).
Mathematical model and random search algorithm for
the optimal planning problem of replacing traditional
public transport with electric. Automation and Remote
Control, 81:803–818.
Maskey, S., Levie, R., Lee, Y., and Kutyniok, G. (2022).
Generalization analysis of message passing neural
networks on large random graphs. Advances in neural
information processing systems, 35:4805–4817.
Miller, E. J. (2020). Measuring accessibility: Methods and
issues. International Transport Forum Discussion Pa-
per.
OpenStreetMap contributors (2017). Planet dump re-
trieved from https://planet.osm.org . https://www.
openstreetmap.org.
Owais, M. and Osman, M. K. (2018). Complete hierarchical
multi-objective genetic algorithm for transit network
design problem. Expert Systems with Applications,
114:143–154.
Prins, C. (2004). A simple and effective evolutionary algo-
rithm for the vehicle routing problem. Computers &
operations research, 31(12):1985–2002.
Quynh, T. D. and Thuan, N. Q. (2018). On optimization
problems in urban transport. Open Problems in Opti-
mization and Data Analysis, pages 151–170.
Saeidizand et al. (2022). Revisiting car dependency: A
worldwide analysis of car travel in global metropoli-
tan areas. Cities.
Schittekat, P., Kinable, J., S
¨
orensen, K., Sevaux, M.,
Spieksma, F., and Springael, J. (2013). A metaheuris-
tic for the school bus routing problem with bus stop
selection. European Journal of Operational Research,
229(2):518–528.
STM (2023). GTFS data (bus schedules and m
´
etro fre-
quency) in Montr
´
eal. https://www.stm.info/en/about/
developers.
Sun, Y., Schonfeld, P., and Guo, Q. (2018). Optimal ex-
tension of rail transit lines. International Journal of
Sustainable Transportation, 12(10):753–769.
UN (2020). Make cities and human settlements inclusive,
safe, resilient and sustainable.
Wang, Z., Di, S., and Chen, L. (2023). A message pass-
ing neural network space for better capturing data-
dependent receptive fields. In Proceedings of the 29th
ACM SIGKDD Conference on Knowledge Discovery
and Data Mining, pages 2489–2501.
Wei, M., Liu, T., and Sun, B. (2021). Optimal routing
design of feeder transit with stop selection using ag-
gregated cell phone data and open source gis tool.
IEEE Transactions on Intelligent Transportation Sys-
tems, 22(4):2452–2463.
Wei, Y., Jin, J. G., Yang, J., and Lu, L. (2019). Strate-
gic network expansion of urban rapid transit systems:
A bi-objective programming model. Computer-Aided
Civil and Infrastructure Engineering, 34(5):431–443.
Wei, Y., Mao, M., Zhao, X., Zou, J., and An, P. (2020). City
metro network expansion with reinforcement learn-
ing. In Proceedings of the 26th ACM SIGKDD Inter-
national Conference on Knowledge Discovery & Data
Mining, pages 2646–2656.
Welch, T. F. et al. (2013). A measure of equity for public
transit connectivity. Journal of Transport Geography.
Yoo, S., Lee, J. B., and Han, H. (2023). A reinforcement
learning approach for bus network design and fre-
quency setting optimisation. Public Transport, pages
1–32.
Yoon, J., Ahn, K., Park, J., and Yeo, H. (2021). Transferable
traffic signal control: Reinforcement learning with
graph centric state representation. Transportation Re-
search Part C: Emerging Technologies, 130:103321.
ICAART 2025 - 17th International Conference on Agents and Artificial Intelligence
630
