
Early Dental Caries and Demineralization Measurements
by Using Portable OCT Scanner
Serioh Okaneya
1,2 a
and Tatsuo Shiina
2b
1
Phoenix-Dent Co., Ltd., 2649-3, Kameicho, Sano-shi, Tochigi, 327-0024, Japan
2
Graduate School of Science and Engineering, Chiba University, 1-33 Yayoi-cho,
Inage-ku, Chiba-shi, Chiba, 263-8522, Japan
Keywords: Optical Coherence Tomography, OCT, Time-Domain, Portable, Dental, Caries, Clinical Applications.
Abstract: There is an increasing need in dental research and clinical practice for accurate measurements of teeth.
Currently, methods such as x-rays and quantitative light-induced fluorescence (QLF) are used, but there are
problems such as the effects of radiation and limitations in resolution. Optical Coherence Tomography (OCT)
used in this study uses near-infrared light, which has no effect on the human body and provides very high
resolution in the range of tens of micrometers. OCT allows for non-invasive imaging, making it safer for
repeated use and ideal for monitoring caries progression over time. In this study, we developed a portable
OCT scanner specialized for dental use and measured and evaluated early caries and demineralization.
1 INTRODUCTION
In dental research and clinical practice, there is an
increasing need for precise measurements of the teeth,
such as the progression of early caries, caries between
adjacent teeth, and cracks on the tooth surface
(Colston, 1998; De Melo, 2005; Shimada, 2010; Imai,
2012; Leão Filho, 2013). Currently, methods such as
X-ray and quantitative visible light induced
fluorescence (QLF) are used, but there are problems
such as radiation effects and limited resolution
(Shiina, 2003; Shimada, 2020). In recent years, the
application of Optical Coherence Tomography
(OCT), already commercialized in the field of
ophthalmology, to dentistry has attracted attention,
and research on OCT for dentistry was initiated by
Sumi and colleagues around 2010 (Shimada, 2010;
Park, 2018). Non-destructive tomographic imaging of
bonded restorations (Makishi, 2011) and non-
destructive tomographic imaging using optical
coherence tomography (OCT) OCT was
commercialized as a medical device for dental use in
Japan in 2020. However, due to limitations in probe
size, product size and even price, it is currently used
more for research purposes than for actual clinical
practice.
a
https://orcid.org/0009-0009-2099-0906
b
https://orcid.org/0000-0001-9292-4523
OCT uses the low-coherence light interference of
an SLD as a light source. Cross-sectional images of
the target can be obtained in a non-erosive and non-
destructive manner, and the depth resolution, which
is determined by the coherence length of the light
source, is about a few tens of microns, which is higher
than that of X-ray or ultrasound measurements.
Currently, high-speed and high-dynamic-range
OCTs such as Fourier-domain OCT (FD-OCT) and
spectral-domain OCT (SD-OCT) are in practical use,
mainly in the medical field, but they are expensive,
large, and have complex systems (Colston Jr, 1998).
The TD-OCT (Time-Domain OCT) used in this study
can be designed independently in terms of the
wavelength of the light source used, measurement
range and resolution, and it can be configured at low
cost. TD-OCT is slower scanning speed than other
medical OCTs, but it allows a longer measurement
depth and does not require complex and extensive
computational processing, as the time information
can be directly converted into depth information.
In this study, a portable OCT scanner specially
designed with a tiny optical probe for dental uses and
its demonstration experiment has been performed to
scan, measure, and evaluate caries on extracted teeth.
In addition, the teeth were immersed in vinegar to
Okaneya, S. and Shiina, T.
Early Dental Caries and Demineralization Measurements by Using Portable OCT Scanner.
DOI: 10.5220/0013151700003902
In Proceedings of the 13th International Conference on Photonics, Optics and Laser Technology (PHOTOPTICS 2025), pages 95-101
ISBN: 978-989-758-736-8; ISSN: 2184-4364
Copyright © 2025 by Paper published under CC license (CC BY-NC-ND 4.0)
95
reproduce the initial caries state and to measure and
evaluate the level of enamel demineralization on the
tooth surfaces (Tsai, 2019).
2 DEVICE CONFIGURATION
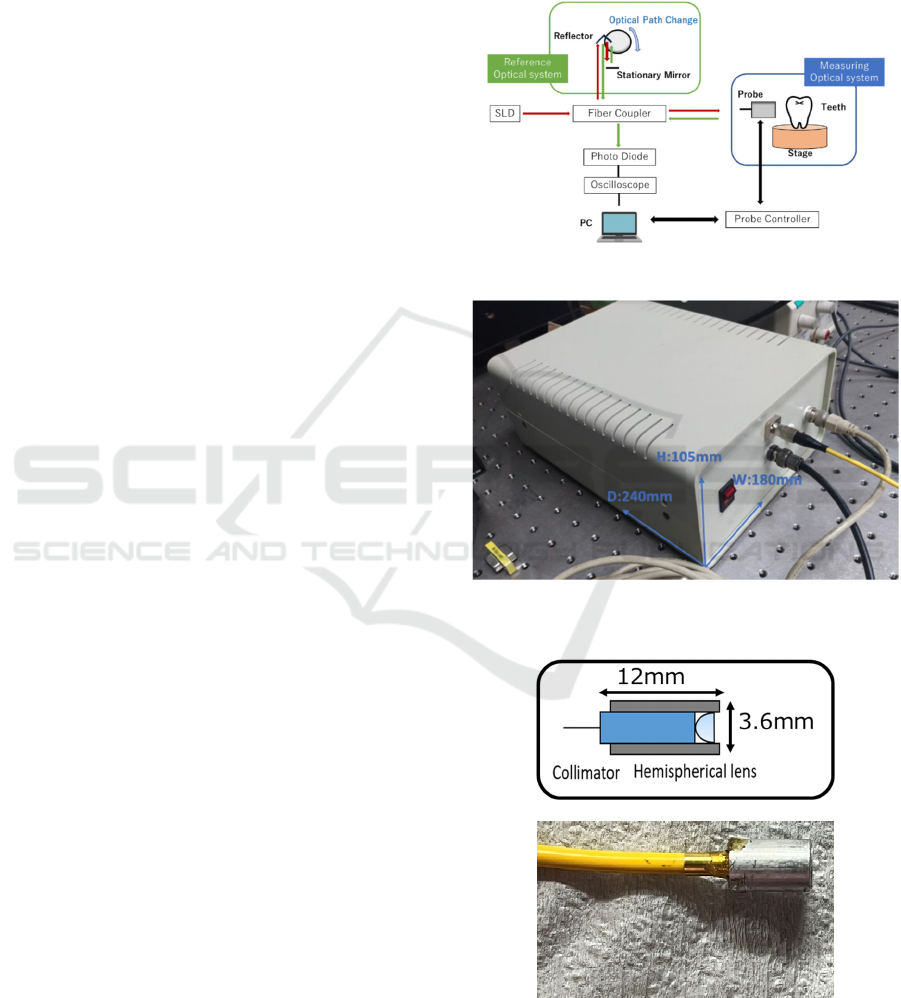
The optical configuration of the portable OCT
scanner developed in this study is shown in Fig.1. The
low-coherence light emitted from the SLD( 𝜆
1.3𝜇𝑚, Δ𝜆 53𝑛𝑚, 𝐴𝑛𝑟𝑖𝑡𝑠𝑢 𝐶𝑜. , 𝐿𝑡𝑑.) light source
is split into two beams by a fiber coupler and directed
towards the reference mirror and the measurement
target, respectively. The reference optical system of
this device utilizes a variable optical path mechanism.
By fixing the reference mirror and rotating the
reflector, the reflected light is returned to the fiber
coupler with a time delay. Meanwhile, the light
directed towards the measurement target passes
inside the target. The light is scattered (backscattered)
back in the original direction by each layer within the
measurement target. The light returning from these
two optical paths interferes and is received by the
Photo Diode (PD). In the receiving circuit, the
interference light is converted into an electrical signal
with the adequate filtering and magnification, and the
waveform can be observed on an oscilloscope.
OCT technology has been widely successful in
ophthalmology for detecting and diagnosing eye
conditions. The non-invasive nature of OCT,
combined with its high resolution, makes it a
promising tool for dental applications. In comparison
to X-rays, OCT eliminates the risk of radiation
exposure, making it safer for repeated use. To
uniformly measure the enamel, which is a random
medium, a mechanism for moving the probe and a
algorithm for processing the oscilloscope signals on a
PC are integrated. This allows continuous observation
the interference waveform and obtaining average
optical properties.
The appearance of the device is shown in Fig.2. It
is small, with dimensions of 180mm in width, 240mm
in length, and 105mm in height, and weighs
approximately 3kg. It operates with a DC power
supply, with a rotation reflector for varying the
optical path length and an SLD light source output of
2mW[max], making it low in power consumption and
be portable. The OCT probe is shown in Fig.3. The
numerical aperture (N.A) of the lens used is 0.11,
resulting in a lateral resolution of 9.87 μm. The
measurement of the distance from the probe and the
signal strength indicated that the focal length is
0.8mm.
The probe, intended for intraoral use, is enough
small with a diameter of 3.6mm and a length of 12mm,
consisting of a single hemispherical lens. This allows
for easy handling within the oral cavity, from the
anterior teeth to the molars, and both buccal and
lingual sides.
Figure 1: System configuration of TD-OCT.
Figure 2: Device appearance of a portable OCT.
(a)
(b)
Figure 3: Probe for dental OCT/ (a) Schematic diagram (b)
Photograph.
PHOTOPTICS 2025 - 13th International Conference on Photonics, Optics and Laser Technology
96
3 EXPERIMENTAL
PROCEDURES
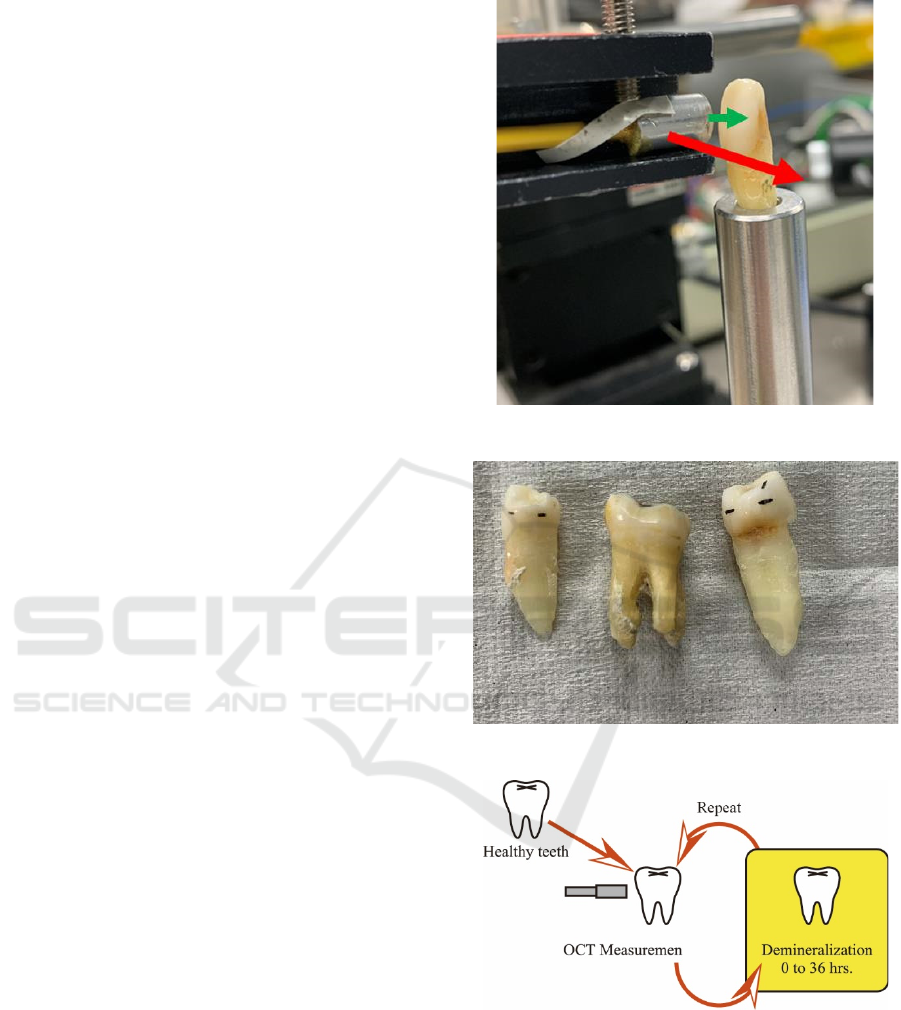
The setup for the tooth measurements in this study is
shown in Fig.4. First, the extracted tooth is mounted
in a hole on the stage so that the emitted light,
indicated by the green arrow, is perpendicular to the
tooth surface. Next, the probe is scanned horizontally
along the tooth in the direction of the red arrow. The
measurement interval is set to 1 scan (1 line in depth
direction) per 0.20 mm. To capture the fine surface
irregularities when measuring the tooth shape,
scanning is performed at 1 scan per 0.10mm.
However, in order to measure the optical properties
within the enamel quickly and uniformly, a wider
interval was used. Since the width of the teeth used in
the experiment is about 6 to 8 mm, a single
measurement can collect about 30 to 40 lines, which
is sufficient for the study.
Figure 5 shows photographs of some of the human
teeth used for OCT measurements for caries checks
and demineralization processing. Extracted human
teeth with no visible damage or caries were selected,
including a total of 17 teeth from both anterior and
posterior regions. The black lines on the surface of the
teeth were used as reference marks for measurement.
The probe was positioned perpendicular to the tooth
surface at these marked positions and the distance
between the probe and the tooth surface was adjusted
for focus. Measurements were taken only on the
enamel side surfaces because the occlusal surfaces
were unsuitable due to their irregularities.
Figure 6 illustrates the workflow of the
demineralization experiment. First, healthy teeth
were measured with an OCT scanner. After they were
immersed in a demineralization solution, they were
measured again with OCT, and this process was
repeated until the demineralization time reached 36
hours. After each demineralization treatment, the
teeth were thoroughly rinsed with water and the
surfaces were dried to ensure that no water droplets
were present during the measurement. That care was
taken not to rub the surface during drying. Fresh
demineralization solution was used each time after
the teeth were removed. The same positions were
measured using reference marks as shown in Fig.5.
4 EVALUATION METHOD
In the field of dentistry, there have been reports that
suggest demineralization potentially infiltrate
internally using SS-OCT (Damodaran, 2016). During
Figure: 4 Optical probe scanning process.
Figure 5: Some of the measurement samples of human teeth.
Figure 6: Demineralization Experiment Workflow.
the analysis, it is helpful to consider binarizing the
signals using a threshold. In healthy teeth, the OCT
signal is initially visible only at the surface, but
gradually, it expands under the demineralization. This
phenomenon, which is known as superficial
demineralization, refers to the early stages of caries
progression, where demineralization can be observed
spreading in the enamel's surface layer
Early Dental Caries and Demineralization Measurements by Using Portable OCT Scanner
97
(approximately 0.1 to 0.5 mm). It has been suggested
that dental OCT offer a means of detecting early
caries that are difficult to confirm visually. However,
it should be noted that these results have not yet been
subjected to a quantitative evaluation, as they are
based solely on comparisons of OCT images.
In this study, we enhance the quality of the raw
data by performing a series of processing steps,
including focal position correction, distance-squared
correction, normalization at the peak position, and
natural logarithm processing. We then applied
binarization using a threshold to the processed data.
As demineralization progresses in the enamel surface
layer, it would seem that the signal expands internally
within the enamel. This will etch the surface and
cause demineralisation but will not cause weakening
of the outer enamel and subsequent sub-surface
mineral loss. It is helpful to define this range as the
demineralization range, and to calculate the average
depth. Following normalization, a threshold is set,
and areas with values exceeding this threshold are
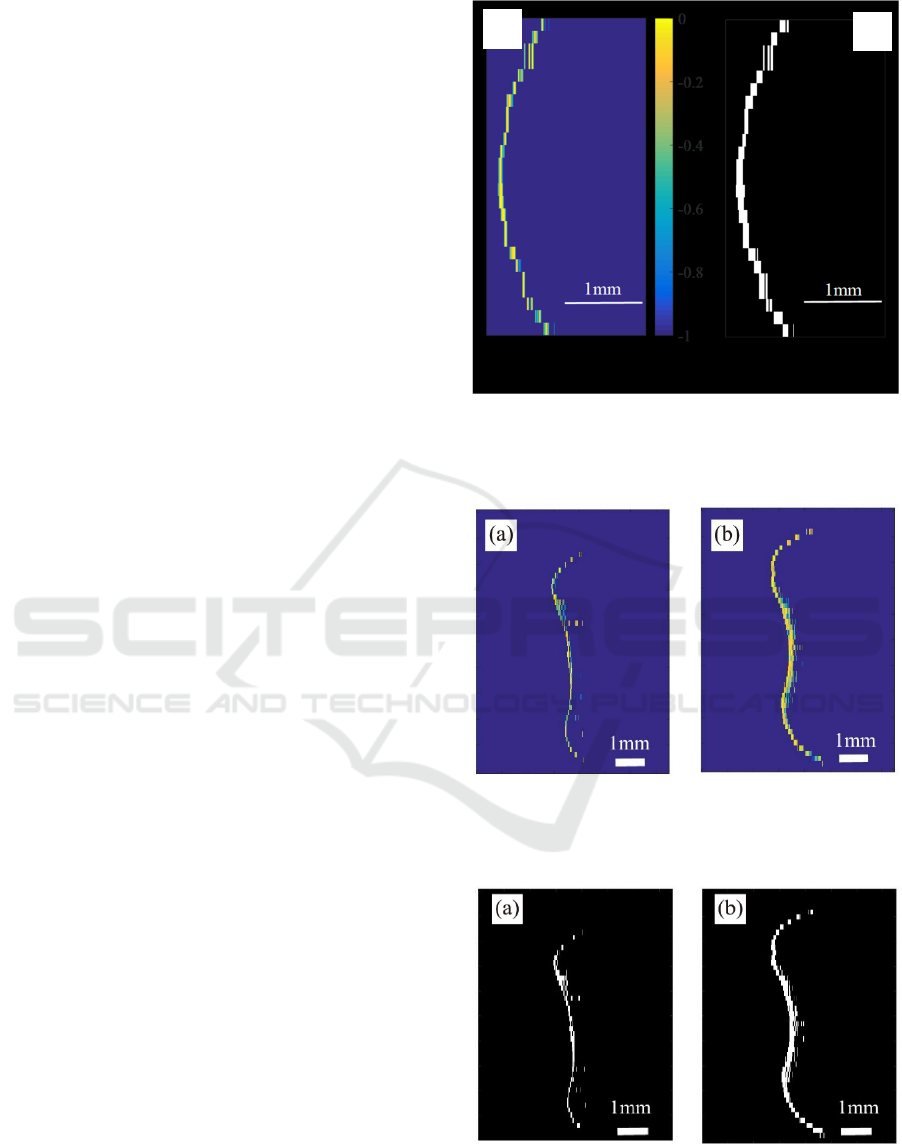
displayed in white. Figure 7 illustrates the alterations
in OCT images prior to and following binarization.
The threshold setting was informed by the published
paper (Damodaran, 2016). The average
demineralization depth is calculated by dividing the
area of the white region by the horizontal length
(corresponding to the vertical axis in Fig.7).
Figure 8 illustrates a typical B-scan result from the
demineralization experiment. It seems that the
demineralization depth will expand due to the
treatment, which could potentially increase the range
where interference signals appear. This illustrates
how acid gradually erodes the surface, gradually
progressing deeper into the enamel. It would seem
that the eroded enamel generates a great many fine
cavities, which become increasingly porous and thus
increase backscattering. For the sake of clarity, we
would like to present the demineralization range
shown in Fig.8 in a different format. This is done by
using a threshold to create a binarized image, which
we will show in Fig.9. It is proposed that the areas
with color changes in the binarized data be considered
as the demineralization depth.
5 MEASUREMENTS OF EARLY
CARIES
Figure 10(a) and (b) illustrate the anterior tooth
samples utilized for OCT measurement. That the
dotted lines in the figures indicate the B-scan
measurement position, with measurements taken
(a) OCT Image immediately after logarithmic
processing (b) Binarized OCT image
Figure 7: Changes in OCT images due to binarization.
(a) Before demineralization
(b) After demineralization
Figure 8: Changes in B-scan due to demineralization.
(a) Before demineralization
(b) After demineralization
Figure 9: Binarized B-scan image using threshold.
(a)
(b)
PHOTOPTICS 2025 - 13th International Conference on Photonics, Optics and Laser Technology
98
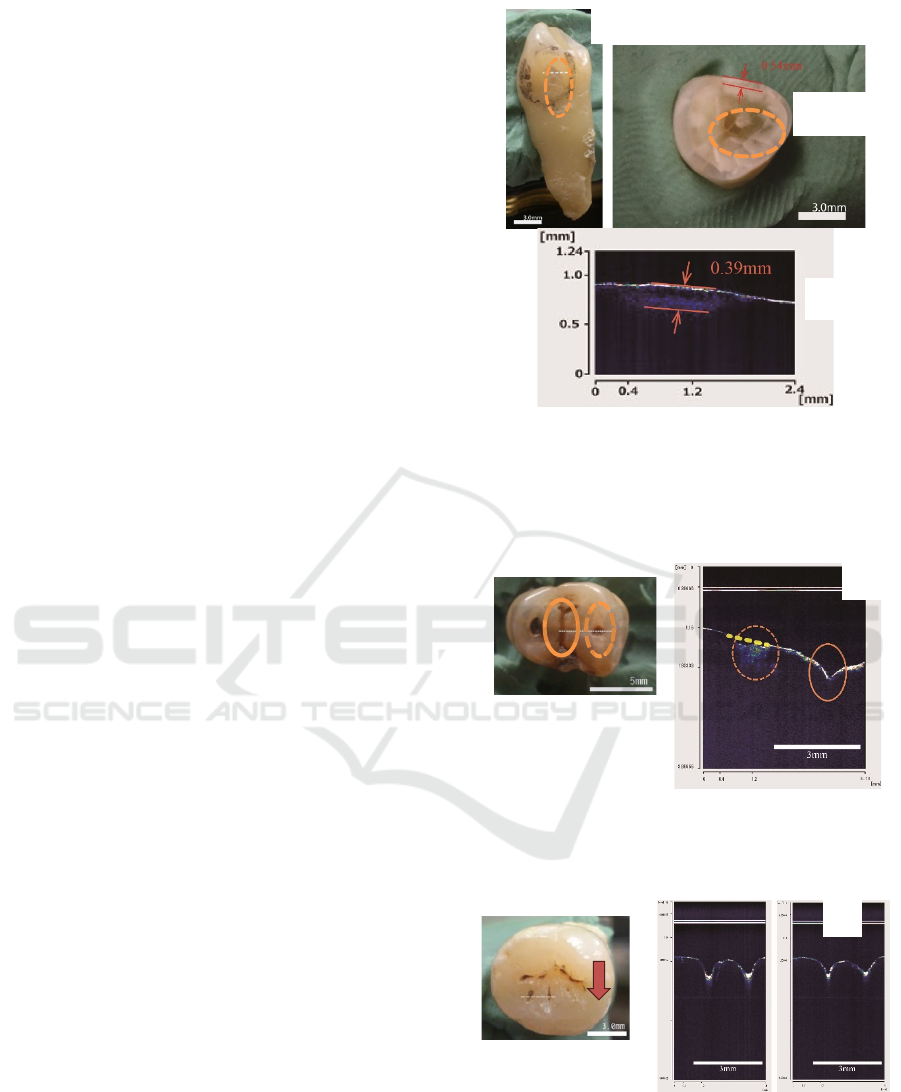
from right to left in the photograph. The
measurements were taken in a horizontal direction on
the surface. It will be observed that within the dotted
circles in Fig.10(a) and (b), these areas appear to be
more opaque than other parts. This is an indication of
early caries (CO). The results of the measurements
across these areas affected by caries are presented in
Fig.10(c). In regions where no caries is observed at
either end, no signals are detected below the surface.
In contrast, in the areas with caries, signals are
detectable up to approximately 0.39 mm below the
surface. Measuring the thickness of the white opaque
area within the dotted circle in Fig.10(b) gives a value
of 0.54 mm. Considering the displacement between
the section location shown in Fig.10(c) and the
measurement location, the results are satisfactory.
Figure 11(a) and 12(a) illustrate the molar
samples utilized for OCT measurements. With regard
to molar sample B, it was deemed appropriate to take
measurements from the occlusal surface. For
convenience, the dotted line in each figure indicates
the measurement positions, with B-scan
measurements taken from right to left across the page.
Figure 11(b) is the measurement results for the
molar sample B. It would seem that early caries (C1)
will be present in the region indicated by the dotted
circle, and staining is visible in the region indicated
by the solid circle. In the carious area, it seems that
signals from demineralized regions within the tooth is
detected in addition to the surface signals. It is helpful
to consider the yellow dotted line as a representation
of the predicted surface shape in a healthy state. It
would appear that the progression of enamel
demineralization will result in a collapse of the
surface shape.
For molar sample C, measurements were taken at
intervals of 0.2mm in the direction indicated by the
arrows in each figure, with the aim of observing
changes in signals at different measurement positions.
Fig.12(b) presents the measurement results, with the
dotted line results on the left and the results from a
0.2mm shift in the arrow direction on the right.
It is observed that the dotted and solid circle
regions in Fig.12(a) appear to correspond to the
carious area and the staining, respectively. Figure
12(b) presents the measurement results for sample C,
which appear to indicate the presence of early caries
(C1) in the dashed circle region. It can be seen from
the OCT cross-sectional image that there is a clear
progression of internal demineralization, which
allows for a quantitative assessment of the depth of
progression.
(a) Surface lateral measurement position (b) Cross-
sectional view of measurement position (c)
Measurement results
Figure 10: Anterior tooth sample A.
(a) Photograph (b) Measurement results
Figure 11: Molar sample B.
(a) Photograph (b) Measurement results
Figure 12: Molar sample C.
(c)
(b)
(b)
(b)
0.54m
m
(a)
(a)
(a)
Early Dental Caries and Demineralization Measurements by Using Portable OCT Scanner
99
6 MEASUREMENT OF TOOTH
DEMINERALIZATION
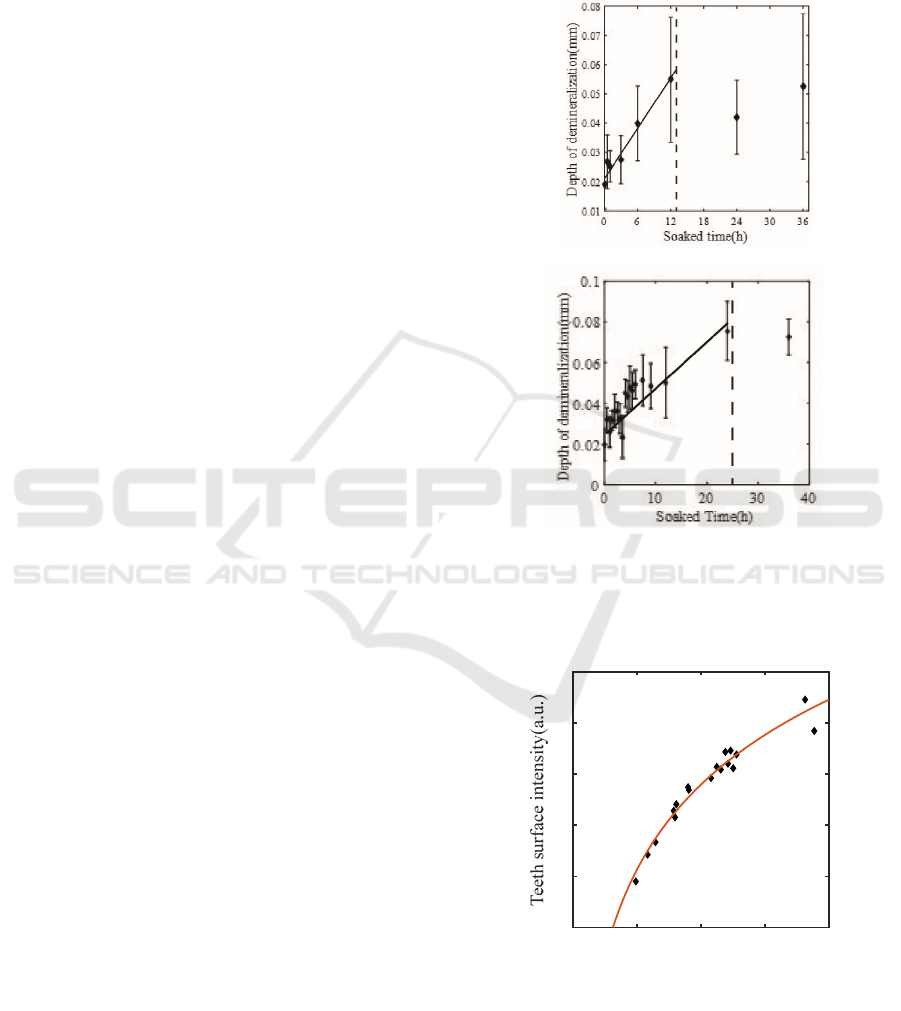
Figure 13 offers insight into the impact of utilizing
undiluted demineralization solution and a 10-fold
diluted solution on the depth of demineralization. The
horizontal axis represents the immersion time in the
demineralization solution, and the vertical axis
represents the demineralization depth. With regard to
the results obtained with the undiluted solution (pH
2.7), it seems that the demineralization depth will
increase in a linear fashion until approximately 12
hours, after which it appears to plateau at a depth of
approximately 0.06 to 0.08 mm. This is in line with
what the B-scan images appear to show, which seems
to indicate that the demineralization process reaches
a certain point where it plateaus in the depth direction.
With regard to the 10-fold diluted solution, it seems
that the increase continues until around 20 hours, after
which it appears to plateau at approximately 0.08mm.
It seems reasonable to suggest that the longer time
taken to reach the plateau is due to the decreased
acidity of the diluted solution.
Similarly, it appears that the surface signal
intensity will increase gradually until around 12 hours,
after which it also seems to reach a plateau. This leads
us to the possibility that demineralization is occurring
not only internally but also on the surface, with the
surface structure potentially changing over time.
Furthermore, this observation is of great importance
as it highlights the necessity of monitoring both
internal and surface changes during demineralization
processes to gain a comprehensive understanding of
the extent and progression of caries.
Figure 14 presents a graph with the
demineralization depth on the horizontal axis and the
surface signal intensity on the vertical axis. It
illustrates the results obtained when using the 10-fold
diluted solution. The change is logarithmic rather
than linear. This result suggests the possibility that
there are differences in the pace of erosion within the
tooth and the degree of surface erosion. It is the case
that the slower increase in surface signal intensity
compared to internal erosion is due to differing acid
resistance between the internal and surface enamel.
Given the observed difference in acid resistance
between the enamel surface and internal, these
findings are to be expected. It seems plausible to
suggest that the enamel surface will be more acid-
resistant than the internal enamel, which could
explain these results. Additionally, figure 14 suggests
that the surface signal intensity will saturate earlier,
indicating that the demineralization solution will first
infiltrate the surface before progressing inward. It
seems that the initial saturation suggests that surface
erosion occurs relatively quickly, followed by a more
gradual internal demineralization process. This could
be an indication of the layered nature of enamel
degradation.
(a) When using undiluted solution (pH2.7)
(b) When using 10-fold diluted solution
Figure 13: Relationship between demineralization time and
demineralization depth.
(When Using 10-Fold Diluted Solution)
Figure 14: Relationship between demineralization depth
and surface signal intensity.
Depth of demineralization(mm)
0 0.02 0.04 0.06 0.08
10
20
30
40
50
6
0
(
a
)
(
b
)
PHOTOPTICS 2025 - 13th International Conference on Photonics, Optics and Laser Technology
100

7 CONCLUSIONS
In this study, we have developed a cost-effective and
portable TD-OCT scanner that could potentially offer
a more efficient alternative to existing dental OCTs.
For the measurement of early caries, we used
human teeth after tooth extraction and evaluated the
measured signal in the early caries area. In the
measurement of anterior teeth, the depth of the
clouded area was measured to be approximately 0.39
mm by OCT, and generally good results were
confirmed in comparison with the actual cut surface
measurement of 0.53 mm. Although numerical
comparisons were not made for the molar area due to
the severe surface irregularities, clear differences in
measurement signals were observed between the
caries-affected and non-caries-affected areas.
We also aimed to gain a deeper understanding of
the effects of demineralization on teeth. To assess the
effects of demineralization, we immersed extracted
human teeth in commercially available vinegar and
evaluated changes in demineralization depth, surface
signal intensity, and attenuation coefficient as
demineralization progressed. We observed that the
demineralization depth, surface signal intensity, and
attenuation coefficient increased at rates of 2.6 μm/h,
2.7/h, and 0.18 mm⁻¹/h, respectively. After
approximately 36 hours, these values appeared to
stabilize. The analysis methods were based on
previously published methods, and the obtained values
were similar to those measured using microscopes.
In order to gain a better understanding of the effects
of drying, we conducted an analysis of the OCT signals
for both non-demineralized and demineralized teeth
after drying. In order to dry the samples, silica gel was
used, and the samples were placed in a container with
less than 10% humidity for 30 minutes. While non-
demineralized teeth showed minimal effects from
drying, demineralized teeth exhibited increased
demineralization depth (approximately 1.20 times),
increased surface signal intensity (approximately 1.33
times), and decreased attenuation coefficient
(approximately 0.63 times). It seems that these changes
in signals will be attributed to the formation of fine
voids in the HA crystals, which are the main
component of enamel, due to demineralization. This
could allow moisture to enter and exit.
From these results, we were able to gain insight
into the changes in OCT signals within teeth caused
by early dental caries, demineralization and drying
using TD-OCT. Further work could include
developing devices for use in clinical settings and
devising methods to measure and evaluate in real time
within the oral cavity.
REFERENCES
Shiina, T., Moritani, Y., Ito, M., & Okamura, Y. (2003).
Long-optical-path scanning mechanism for optical
coherence tomography. Applied optics, 42(19), 3795-
3799.
Shimada, Y., Sadr, A., Burrow, M. F., Tagami, J., Ozawa,
N., & Sumi, Y. (2010). Validation of swept-source
optical coherence tomography (SS-OCT) for the
diagnosis of occlusal caries. Journal of dentistry, 38(8),
655-665.
De Melo, L. S. A., de Araujo, R. E., Freitas, A. Z., Zezell,
D., Vieira Jr, N. D., Girkin, J., ... & Gomes, A. S. L.
(2005). Evaluation of enamel dental restoration
interface<? xpp qa?> by optical coherence tomography.
Journal of biomedical optics, 10(6), 064027-064027.
Makishi, P., Shimada, Y., Sadr, A., Tagami, J., & Sumi, Y.
(2011). Non-destructive 3D imaging of composite
restorations using optical coherence tomography:
marginal adaptation of self-etch adhesives. Journal of
Dentistry, 39(4), 316-325.
Imai, K., Shimada, Y., Sadr, A., Sumi, Y., & Tagami, J.
(2012). Noninvasive cross-sectional visualization of
enamel cracks by optical coherence tomography in vitro.
Journal of endodontics, 38(9), 1269-1274.
Leão Filho, J. C. B., Braz, A. K. S., de Souza, T. R., de
Araujo, R. E., Pithon, M. M., & Tanaka, O. M. (2013).
Optical coherence tomography for debonding
evaluation: an in-vitro qualitative study. American
Journal of Orthodontics and Dentofacial Orthopedics,
143(1), 61-68.
Damodaran, V., Rao, S. R., & Vasa, N. J. (2016). Optical
coherence tomography based imaging of dental
demineralisation and cavity restoration in 840 nm and
1310 nm wavelength regions. Optics and Lasers in
Engineering, 83, 59-65.
Park, K. J., Schneider, H., Ziebolz, D., Krause, F., & Haak,
R. (2018). Optical coherence tomography to evaluate
variance in the extent of carious lesions in depth. Lasers
in medical science, 33, 1573-1579.
Tsai, M. T., Wang, Y. L., Yeh, T. W., Lee, H. C., Chen, W.
J., Ke, J. L., & Lee, Y. J. (2019). Early detection of
enamel demineralization by optical coherence
tomography. Scientific reports, 9(1), 17154.
Shimada, Y., Burrow, M. F., Araki, K., Zhou, Y., Hosaka,
K., Sadr, A., ... & Tagami, J. (2020). 3D imaging of
proximal caries in posterior teeth using optical
coherence tomography. Scientific reports, 10(1), 15754.
Colston Jr, B. W., Everett, M. J., Da Silva, L. B., Otis, L.
L., Stroeve, P., & Nathel, H. (1998). Imaging of hard-
and soft-tissue structure in the oral cavity by optical
coherence tomography. Applied optics, 37(16), 3582-
3585.
Colston, B. W., Sathyam, U. S., DaSilva, L. B., Everett, M.
J., Stroeve, P., & Otis, L. L. (1998). Dental oct. Optics
express, 3(6), 230-238.
Early Dental Caries and Demineralization Measurements by Using Portable OCT Scanner
101
