
Machine Learning-Driven Monitoring for Early Detection and
Management of Prediabetes
Wesam A. Ali
1 a
and Adeem Ali Anwar
2 b
1
Department of Chemistry, Khalifa University, P.O. Box 127788, Abu Dhabi, U.A.E.
2
School of Computing, Macquarie University, 2109, NSW, Australia
Keywords:
Prediabetes, Progression Rate, Machine Learning, Diabetes, Prediction.
Abstract:
Prediabetes is a critical metabolic condition that acts as the precursor for type 2 diabetes (T2D). Early de-
tection and management of prediabetes can prevent the onset of diabetes and associated complications. For
individuals with prediabetes, having a reliable way to estimate their risk of developing T2D is crucial, as it
helps them to keep their glycemic levels on track and may even enable them to regress to normoglycemia.
Building on this, we propose a methodology to predict the progression rate of prediabetes. In this study, we
enhanced the preexisting dataset by incorporating risk progression and risk probability using logistic regres-
sion. Moreover, we predicted the progression rate of prediabetes using machine learning-based approaches
and performed comparative analysis using logistic regression, random forest, decision tree, gradient boosting,
neural networks, and support vector machines. Utilizing key health indicators such as age, body mass index
(BMI), gender, and comorbidities as characteristic factors of prediabetes progression. The results demonstrate
that logistic regression outperforms other models with an accuracy of 99.93%, a precision of 99.92%, and an
AUC-ROC of 1.0000, making it the most suitable model for predicting prediabetes risk. The proposed system
offers a promising solution for real-time prediabetes monitoring.
1 INTRODUCTION
Diabetes mellitus (DM) is a metabolic disorder that
is induced by insufficient insulin production by the
pancreas to decompose the blood glucose (Chauhan
et al., 2023). Resulting in severe damage to multiple
organs and the development of associated health com-
plications such as cardiovascular disease, blindness,
and neuropathy (JhaJay et al., 2016; Klein and Klein,
1995; Mohamed et al., 2016). According to the recent
statistics of the World Health Organization (WHO),
diabetes is the seventh cause of death worldwide (Or-
ganization, 2023). In this work, the term ’diabetes’
specifically refers to type 2 diabetes (T2D), unless
otherwise specified. Aside from genetic factors, di-
abetes typically does not develop suddenly (Katsarou
et al., 2017), as it generally progresses from a pre-
liminary stage called prediabetes (intermediate hyper-
glycemia). Prediabetes is a reversible condition where
glucose levels are high but not reaching the diabetic
threshold (Echouffo-Tcheugui and Selvin, 2021). It
occurs due to an inactive lifestyle, unhealthy dietary
a
https://orcid.org/0000-0003-0569-8615
b
https://orcid.org/0000-0002-6474-3810
intake, and obesity. If prediabetes is detected and
monitored at the right time, it can be reversed to
normoglycemia with the implementation of necessary
lifestyle changes and appropriate treatment (Bansal,
2015). Despite this, the current glucose monitoring
technologies are concentrated on diabetes manage-
ment rather than prediabetes, shifting attention to the
condition after it has developed instead of address-
ing it at the earlier, more treatable stage (Zhang et al.,
2021; Bruen et al., 2017; Liu et al., 2022; Liu et al.,
2024).
The application of machine learning (ML) tech-
niques for diabetes management and prediction has
received a lot of attention, particularly when it comes
to determining prediabetes progression. Research has
demonstrated that ML models with a variety of health
markers including age, body mass index (BMI), blood
glucose levels, and HbA1c values, may accurately
predict the onset of diabetes. To illustrate the po-
tential of machine learning (ML) in early diagno-
sis and preventive efforts, Cahn et al. (Cahn et al.,
2020) constructed and validated a machine learning
model to predict the progression from prediabetes to
diabetes. Perveen et al. (Perveen et al., 2019) em-
256
Ali, W. A. and Anwar, A. A.
Machine Learning-Driven Monitoring for Early Detection and Management of Prediabetes.
DOI: 10.5220/0013118800003890
In Proceedings of the 17th International Conference on Agents and Artificial Intelligence (ICAART 2025) - Volume 3, pages 256-263
ISBN: 978-989-758-737-5; ISSN: 2184-433X
Copyright © 2025 by Paper published under CC license (CC BY-NC-ND 4.0)

ployed machine learning approaches for predictive
modeling, demonstrating that machine learning may
increase prediction precision by analyzing a range of
features. The basis for the current study’s focus on
the progression of prediabetes has been established by
this research, which demonstrates the benefits of uti-
lizing ML techniques to predict diabetes risk. Several
classifiers, such as random forests, neural networks,
and support vector machines have not received much
attention in the literature. These classifiers along with
others are used to predict the progression of predi-
abetes using an enhanced dataset that includes risk
probability and progression rate. This is despite the
advancements in the field. This study aims to fill
that gap by analyzing the effectiveness of multiple
machine learning models for early detection and risk
management of prediabetes.
In this study, the prediction of the prediabetes pro-
gression rate is achieved using a machine learning-
based approach that leverages patient-specific health
indicators and comparative analysis of machine learn-
ing algorithms including logistic regression, random
forest, neural networks, support vector machines, de-
cision trees, and gradient boosting has been done. The
dataset (Mustafa, 2021) we used contains gender, age,
hypertension, heart disease, HbA1c, BMI, glucose
levels, and diabetes, which was enhanced by adding
risk progression and risk probability (Anwar, 2024).
To the best of our knowledge, no study has specifi-
cally targeted these key features using these machine
learning algorithms on the considered dataset and pre-
dicted prediabetes progression rate. It is often as-
sumed that glucose monitors designed for diabetes
can be used for prediabetes as well, but this is an in-
accurate assumption since these monitors need to be
specifically optimized to address the distinct require-
ments of each condition. This assumption arises from
the overlap between prediabetes and diabetes in terms
of insulin resistance (Haffner, 2003) glucose dysreg-
ulation (Lee et al., 2024), and risk factors (Budiastu-
tik et al., 2022). Regarding the latter, the risk factors
can differ statistically between prediabetes and dia-
betes. For instance, the BMI in diabetics aged 20 to
65 tends to have a higher average compared to those
with prediabetes (Menke et al., 2021). Furthermore,
both conditions differ in the metabolites present, as
demonstrated by Long et al. (Long et al., 2020), who
showed variations in the concentration of metabolites
like alanine, glutamate, and palmitic acid between the
two conditions. Additionally, they result in differ-
ent glycemic thresholds as stated by WHO (Organi-
zation, 2023) and the American Diabetes Association
(ADA) (Association, 2010). Building on this, it is
crucial to propose an optimized model specific to pre-
diabetes standards. Most importantly, the optimiza-
tion must consider key risk factors such as BMI, age,
and gender, which help differentiate individuals and
accurately address prediabetes.
This paper applies state-of-the-art machine learn-
ing approaches to predict the progression rate of pre-
diabetes by incorporating key metrics such as glucose
levels, age, BMI, gender, and comorbidities. The con-
tributions of this work are as follows:
1. Enhanced pre-existing dataset by incorporating
key fields such as risk progression and probabil-
ity using logistic regression.
2. Conducted a comparative analysis of multiple ma-
chine learning models to evaluate their perfor-
mance in predicting prediabetes progression rate.
The remainder of this paper is organized as fol-
lows: section 2 describes the prediabetes progression
risk model. Section 3 provides a detailed description
of the used dataset. Section 4 demonstrates the exper-
imental setup, results, and analysis. Finally, section 5
concludes the paper and discusses the future work.
2 PREDIABETES PROGRESSION
RISK PREDICTION
In this study, the prediction of the prediabetes pro-
gression rate is achieved using a machine learning-
based approach that leverages patient-specific health
indicators and a comparative analysis of models has
been done. The objective is to forecast how the risk
of diabetes may evolve over time and hence super-
vised classification models are used using both cur-
rent health metrics and the presence of diabetes. The
prediction models estimate the likelihood of predia-
betes progression based on these factors. Moreover,
we enhanced the pre-existing dataset (Mustafa, 2021)
by incorporating key fields (i.e., risk progression and
probability) using logistic regression (Anwar, 2024).
2.1 Data Preparation
The dataset (Mustafa, 2021) we used contains gender,
age, hypertension, heart disease, BMI, glucose, and
diabetes and it is enhanced by adding risk progres-
sion and risk probability (Anwar, 2024). These fea-
tures are selected because they influence the progres-
sion of prediabetes, as supported by medical literature
and epidemiological studies (Mansourian et al., 2020;
Bennasar-Veny et al., 2020; Belsky et al., 2023).
Other factors could have contributed to the predia-
betes progression such as the fasting glucose levels or
triglyceride levels. However, recent research shows
Machine Learning-Driven Monitoring for Early Detection and Management of Prediabetes
257

that their impact is relatively insignificant compared
to the selected features (Bennasar-Veny et al., 2020;
Mansourian et al., 2020).
2.2 Modeling Approach
Several models are trained and evaluated to assess the
progression rate including logistic regression, random
forest, neural networks, support vector machines, de-
cision trees, and gradient boosting. The dataset is
split into training (80%) and testing (20%) sets, with
the models being trained to classify patients as either
“high risk” or “low risk” of prediabetes progression.
The target variable for progression is defined by set-
ting a threshold on the risk probability, where patients
with a risk score of 50% or higher are classified as
being at high risk of disease progression.
2.3 Model Evaluation
The performance of each model is assessed using
several standard classification metrics i.e., Accuracy
(Sokolova and Lapalme, 2009), Precision (Sokolova
and Lapalme, 2009), Recall (Sokolova and Lapalme,
2009), F1-Score (Sokolova and Lapalme, 2009), Area
Under the Receiver Operating Characteristic Curve
(AUC-ROC) (Bradley, 1997), Mean Squared Error
(MSE) (Willmott and Matsuura, 2005), R-squared
(R²) (Barrett, 2000) and Confusion Matrix (Sokolova
and Lapalme, 2009). Based on the evaluation met-
rics, the logistic regression classifier is selected as the
final model due to its superior performance across all
evaluation measures (Organization, 2023).
2.4 Prediction of Progression Rate
A logistic regression model is employed to estimate
the progression of prediabetes by utilizing the user
health metrics as inputs. A higher risk probability in-
dicates a more rapid progression, while a lower risk
probability suggests a slower progression or a stable
glycemic level. The process consists of the following
steps:
1. Input Features: The user provides values for
gender, age, BMI, HbA1c level, blood glucose
level, and relevant comorbidities (i.e., hyperten-
sion, heart disease).
2. Risk Calculation: The model processes the in-
puts and calculates the probability of progression
based on patterns learned during training.
3. Output: The model returns a progression proba-
bility, which is interpreted as the likelihood of the
patient’s diabetes risk increasing over time.
This machine learning-based prediction model en-
ables both healthcare providers and patients to gain
insight into the likelihood of prediabetes progression,
allowing for early interventions and personalized care
strategies. The use of health indicators ensures that
predictions are highly tailored to individual patient
profiles, helping to identify those at greater risk for
rapid disease progression. Such insights are vital
for making informed decisions about treatment ad-
justments, lifestyle interventions, and monitoring fre-
quency.
3 DATASET DESCRIPTION
The dataset utilized for this study is taken from Kag-
gle (Mustafa, 2021). This dataset is an extensive com-
pilation of patient medical records created with the
express purpose of aiding in the prediction of the on-
set of diabetes.
The dataset has a number of important features
that are useful for prediction, such as:
• Gender: A binary variable that takes gender vari-
ations in risk into account (0 for females and 1 for
males).
• Age: A continuous variable representing the pa-
tient’s age. It is a known feature for influencing
prediabetes progression.
• Hypertension: A binary variable that indicates if
the patient has hypertension; a common comor-
bidity with diabetes (0 for no, 1 for yes).
• Heart Disease: A binary variable that indicates
whether cardiovascular problems exist and can ac-
celerate the development of prediabetes (0 for no,
1 for yes).
• BMI: A continuous variable that shows the rela-
tionship between height and body weight, which
is crucial for indicating the development and pro-
gression of prediabetes.
• HbA1c Level: A continuous variable that shows
the percentage of glycated hemoglobin during the
preceding two to three months, acting as a gauge
of blood sugar control.
• Blood Glucose Level: A continuous variable that
gauges the bloodstream’s immediate glucose lev-
els.
• Diabetes: A binary variable that indicates if the
patient has received a diabetes diagnosis (0 for no,
1 for yes).
The dataset is characterized by a diverse range
of patient demographics and health conditions, mak-
ICAART 2025 - 17th International Conference on Agents and Artificial Intelligence
258

ing it a robust resource for machine learning appli-
cations in healthcare. Each entry represents a unique
patient profile, allowing for comprehensive analysis
and modeling of diabetes risk factors.
Prior to model training, the dataset undergoes pre-
processing steps, including handling missing values,
feature normalization, and encoding categorical vari-
ables. This ensures the data is clean and suitable for
predictive modeling.
3.1 Risk Progression
In this study, we employed logistic regression
to model the risk progression of diabetes based
on key health factors. The dataset is prepro-
cessed to normalize relevant numerical features
such as age, BMI, HbA1c level, diabetes, and
blood glucose level, while categorical variables like
hypertension, heart disease, and gender are main-
tained in their binary form. After training the lo-
gistic regression model, we extracted the coefficients
and intercept from the trained model to calculate risk
progression and probability for each individual in the
dataset.
The risk progression for an individual is computed
using the following formula:
risk progression = β
0
+ β
1
· age +β
2
· hypertension
+ β
3
· heart disease + β
4
· BMI
+ β
5
· HbA1c level
+ β
6
· blood glucose level
+ β
7
· gender
(1)
where β
0
represents the model intercept and
β
1
, β
2
, . . . , β
7
represent the coefficients corresponding
to each feature. The coefficients reflect the contribu-
tion of each factor toward the predicted log odds of
developing diabetes.
Once the risk progression (log-odds) is calculated,
we transform it into a probability using the logistic
function:
risk probability =
1
1 + exp(−risk progression)
(2)
This transformation provides the predicted prob-
ability of developing diabetes for each individual.
The probability is then expressed as a percentage
by multiplying the result by 100. After calculating
the risk progression and risk probability, these values
are added as two new columns risk
progression and
risk probability to the original dataset. The updated
dataset is saved as a CSV file for further analysis and
reporting.
Overall, the diabetes prediction dataset serves as a
valuable foundation for developing machine learning
models aimed at predicting diabetes risk, contributing
to the advancement of personalized healthcare solu-
tions.
4 EMPIRICAL STUDIES
In this section, the experimental settings and experi-
mental results are discussed in detail. The code for
all the experiments including the dataset alteration is
publicly available on (Anwar, 2024).
4.1 Experimental Settings
4.1.1 Datasets
The enhanced dataset (Mustafa, 2021; Anwar, 2024)
is used to predict the prediabetes progression rate and
includes key health indicators i.e., gender, age, hy-
pertension, heart disease, BMI, HbA1c level, blood
glucose level, diabetes are taken as input features and
Risk Probability is taken as target. These features are
selected due to their established influence on the pro-
gression of prediabetes as previously discussed.
4.1.2 Parameters Selection
The main parameters used in the creation of the pre-
diabetes risk prediction model are compiled in Table
1. Robust performance in the diabetes risk predic-
tion model is largely dependent on parameter selec-
tion. Different parameters are used by each model
to determine how well it performs; also, feature se-
lection and data partitioning are essential for efficient
training and assessment.
4.1.3 Algorithms for Comparative Studies
The following algorithms are used in this study: (1)
Logistic Regression (Seber and Lee, 2003) a statis-
tical method for binary classification which repre-
sents input features to probabilities using a sigmoid
function; (2) Random Forest (Breiman, 2001) an en-
semble technique that links multiple decision trees to
boost accuracy and decreases overfitting; (3) Decision
Tree Models (Quinlan, 1986) use a flowchart struc-
ture to make predictions based on feature splitting but
may overfit complicated datasets; (4) Gradient Boost-
ing (Friedman, 2001) builds trees in sequence to cor-
rect errors and attains superior accuracy in structured
data; (5) Support Vector Machines (SVM) (Drucker
et al., 1996) find an optimal hyperplane for classifi-
cation and perform well in both linear and non-linear
Machine Learning-Driven Monitoring for Early Detection and Management of Prediabetes
259
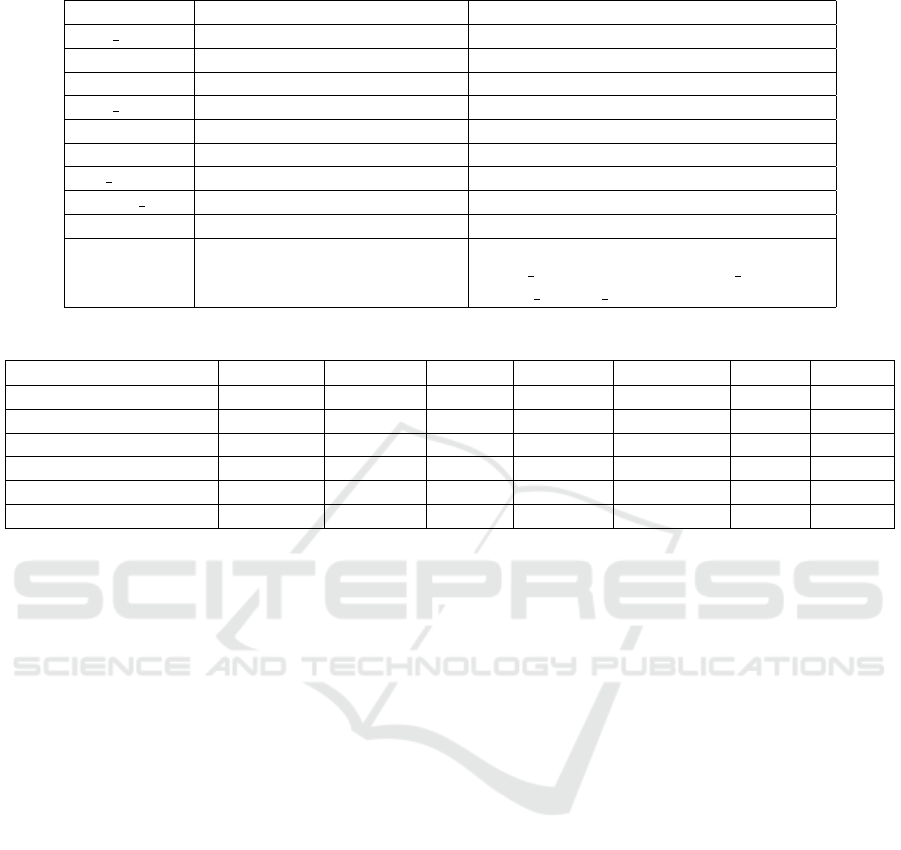
Table 1: Parameters Settings.
Parameter Model/Function Value/Description
max iter Logistic Regression 500 (Maximum iterations for convergence)
probability SVM True (Enables probability estimates)
- Random Forest Default parameters
max iter Neural Network 500 (Maximum iterations for training)
- Decision Tree Default parameters
- Gradient Boosting Default parameters
test size Data Splitting 0.2 (20% data for testing)
random state Data Splitting 42 (Ensures reproducibility)
y Target Variable Transformation apply(lambda x: 1 if x ≥ 50 else 0)
X Feature Selection data[[’gender’, ’age’, ’hypertension,
’heart disease’, ’BMI’, ’HbA1c level’,
’blood glucose level’, ’diabetes’]]
Table 2: Summary of Model Performance.
Model Accuracy Precision Recall F1-Score AUC-ROC MSE R
2
Logistic Regression 99.93% 99.92% 99.01% 99.46% 1.0000 0.0011 0.9808
Random Forest 99.41% 96.03% 94.13% 95.07% 0.9996 0.0043 0.9245
Neural Network (MLP) 99.40% 99.64% 90.41% 94.80% 0.9997 0.0044 0.9223
SVM 97.14% 94.92% 55.67% 70.18% 0.9971 0.0103 0.8179
Decision Tree 99.28% 93.75% 94.29% 94.02% 0.9694 0.0073 0.8723
Gradient Boosting 99.31% 96.45% 92.06% 94.20% 0.9994 0.0049 0.9136
problems; and (6) Neural Networks (NNs) (Rumel-
hart et al., 1986) inspired by the human brain and suc-
ceed at netting complex patterns in data for tasks in-
cluding image recognition and natural language pro-
cessing.
4.1.4 Evaluation Measures
We used the following evaluation metrics to assess the
performance of the machine learning models. Mean
Squared Error (MSE) measures the average squared
difference between actual and predicted values (Will-
mott and Matsuura, 2005). R-squared (R²), which is
also known as the coefficient of determination shows
how well the model explains the variability in the de-
pendent variable (Barrett, 2000). Accuracy is the ratio
of correctly predicted instances to the total instances
(Sokolova and Lapalme, 2009). Precision measures
the ratio of true positive predictions to the total pre-
dicted positives (Sokolova and Lapalme, 2009). The
recall represents the proportion of actual positives that
are correctly predicted by the model (Sokolova and
Lapalme, 2009). F1-Score is the harmonic mean of
precision and recall (Sokolova and Lapalme, 2009).
The Area Under the Curve (AUC) of the Receiver
Operating Characteristic (ROC) curve measures the
model’s ability to distinguish between classes at vari-
ous threshold levels (Bradley, 1997). Confusion Ma-
trix provides detailed insight into the performance of
the classification model by presenting the counts of
true positives, true negatives, false positives, and false
negatives predictions (Sokolova and Lapalme, 2009).
4.2 Experimental Results and
Sensitivity Analysis
The following section describes the experiments, their
discussion, and sensitivity analyses.
4.2.1 Experimental Results
To predict the risk probability of diabetes based on
key health indicators six machine learning models:
Logistic Regression, Random Forest, Neural Net-
works, SVM, Decision Tree, and Gradient Boosting
are used. These models are trained on a dataset con-
taining features such as gender, age, hypertension sta-
tus, heart disease status, BMI, HbA1c level, blood
glucose level, and diabetes status (Mustafa, 2021; An-
war, 2024). The target variable is a binary classifica-
tion of risk probability, where a threshold of 50% is
used to classify instances as high or low risk.
Numerous metrics, such as accuracy, precision,
recall, F1-Score, AUC-ROC, MSE, and R-squared
(R
2
), are used to evaluate each model’s performance.
Table 2 provides the results for each model. Figure 1
shows the confusion matrix for all algorithms.
With an ideal discriminatory power indicated by
AUC-ROC of 1.0000 and an accuracy of 99.93%,
ICAART 2025 - 17th International Conference on Agents and Artificial Intelligence
260

Figure 1: Confusion Matrix for all considered algorithms.
Logistic Regression demonstrated the highest overall
performance. With a 99.92% precision and a 99.01%
recall, the model produced an F1-Score of 99.46%.
Additionally, the model explains 98.08% of the vari-
ance (R
2
= 0.9808) in predicting the risk probability,
and its MSE (0.0011) is the lowest of all the models.
These findings show that Logistic Regression offers
reliable forecasts with low error rates in addition to
correctly classifying the risk level.
Along with its strong performance, the Random
Forest classifier achieved an accuracy of 99.41% and
an AUC-ROC of 0.9996, indicating almost perfect
classification abilities. With a precision of 96.03%
and a recall of 94.13%, the model produced an F1-
Score of 95.07%. Random Forest explained a sig-
nificant amount of the variance in the predictions, as
evidenced by the MSE, which is marginally higher
than Logistic Regression at 0.0043 and the R
2
value
of 0.9245.
With an accuracy of 99.40% and an AUC-ROC
of 0.9997, the Neural Network model performed sim-
ilarly to Random Forest. The model’s F1-Score is
94.80%, with a precision of 99.64% and a somewhat
lower recall of 90.41%. With an MSE of 0.0044 and
a R
2
of 0.9223, the prediction stability is marginally
lower than that of Random Forest. In spite of this,
the Neural Network continued to exhibit good perfor-
mance, particularly in differentiating between the two
risk categories.
Performance-wise, the SVM classifier performed
worse than the other models. It obtained an AUC-
ROC of 0.9971 and an accuracy of 97.14%; however,
its precision and recall are only 94.92% and 55.67%,
respectively. With an F1-Score of 70.18%, this in-
dicated that SVM had trouble with recall, especially
when it came to recognizing high-risk cases. When
compared to the other models, the MSE is higher at
0.0103 and the R
2
is 0.8179, indicating worse predic-
tive power.
With a precision of 93.75%, recall of 94.29%, and
accuracy of 99.28%, the Decision Tree classifier pro-
duced an F1-Score of 94.02%. Although still strong,
the AUC-ROC of 0.9694 is less than that of the lo-
gistic and ensemble models. With an MSE of 0.0073
and a R
2
of 0.8723, the model demonstrated a moder-
ate level of variance explanation and prediction error.
With an accuracy of 99.31% and an AUC-ROC of
0.9994, the Gradient Boosting model performed ad-
mirably by all measures. The model has an F1-Score
of 94.20% based on its precision of 96.45% and recall
of 92.06%. Its MSE of 0.0049 is marginally higher
than that of Random Forest and Logistic Regression,
and its R
2
of 0.9136 indicates that it accounts for a
sizable amount of the variance in the predictions.
In conclusion, based on the model performance
metrics, Logistic Regression emerges as the most
effective model for predicting diabetes risk in this
dataset. It achieves the highest values in criti-
cal metrics, including accuracy (99.93%), precision
(99.64%), recall (99.01%), F1-Score (99.46%), AUC-
ROC (1.0000), and R-squared (0.9808), while also
maintaining the lowest MSE (0.0011), indicating
highly accurate and stable predictions. Therefore, Lo-
gistic Regression not only provides superior perfor-
mance across multiple dimensions but also offers a
balance of accuracy, precision, and low error rates,
making it the most suitable choice for this task. This
ideal performance could result from various factors,
including a well-defined decision boundary, over-
fitting, the inherent separability of the classes in the
dataset, and potentially the absence of noise or over-
lap between classes.
4.2.2 Sensitivity Analysis
In this study, a parametric analysis is conducted to in-
vestigate the effect of varying input features on the
predicted risk probability of diabetes progression. A
dataset with features i.e., age, gender, blood pressure,
heart disease, BMI, HbA1c level, blood glucose level,
and diabetes status is used to train a logistic regres-
sion model. Using a threshold value of 50%, the tar-
get variable, risk probability, is converted into a bi-
nary classification. Values more than or equal to 50%
are labeled as high risk, while values less than 50%
are labeled as low risk. An 80-20 split ratio is used
to divide the data into training and testing sets. To
guarantee convergence, the logistic regression model
is trained using the training set, up to 500 iterations
total. We change the input for each feature through-
out a predetermined range and assess the effect on the
estimated risk probability. Table 3 lists the ranges that
are used for the parametric analysis.
In the parametric analysis, each feature is taken
one by one while keeping all other features constant
at their mean or usual values. The following con-
Machine Learning-Driven Monitoring for Early Detection and Management of Prediabetes
261

Table 3: Feature Ranges for Parametric Analysis.
Feature Range/Values
Age 30 to 80 years
Gender {0 (Female), 1 (Male)}
Hypertension {0 (No), 1 (Yes)}
Heart Disease {0 (No), 1 (Yes)}
BMI 18.5 to 40.0
HbA1c Level 4.5 to 10.0
Blood Glucose Level 70 to 200 mg/dL
Diabetes {0 (No), 1 (Yes)}
stant values are applied to the non-varied features:
The BMI is fixed at 25.0, the gender is set to male,
the HbA1c level and blood glucose level are set to the
mean value from the training data, and it is assumed
that there is no diabetes, heart disease, or hyperten-
sion. This method makes it possible to evaluate how
each individual feature affects the result.
The predicted probability of risk increases dra-
matically with age, particularly for those over 60.
Another factor is gender, with males often being at
higher risk than women. A larger predicted risk is
shown in people with cardiac disease or hypertension,
which is in line with the correlation between these
conditions and metabolic disorders. Increased BMI
readings, especially those over 30, are linked to in-
creased risk and indicate obesity. The predicted risk is
significantly increased by elevated HbA1c levels and
blood glucose levels above 150 mg/dL. Lastly, the fact
that diabetes raises the probability of advancement
significantly emphasizes how well the model captures
this important aspect.
Figure 2: Parametric Analysis for all Key Factors.
As shown in the Figure 2, the parametric anal-
ysis demonstrates that the logistic regression model
captures meaningful relationships between the input
features and the predicted risk probability of diabetes
progression. This analysis provides insights into how
each individual feature contributes to the overall risk
and highlights key factors such as age, BMI, HbA1c
level, and the presence of hypertension, heart disease,
and diabetes in influencing the risk of progression.
5 CONCLUSION AND FUTURE
WORK
This paper presents a comprehensive methodology
for predicting the progression rate of prediabetes us-
ing machine learning models. Moreover, the dataset
has been enhanced by adding key features i.e., risk
progression and probability. With an accuracy of
99.93%, precision of 99.92%, and an AUC-ROC of
1.0000, among the tested models, Logistic Regression
proved to be the most reliable and accurate in pre-
dicting the progression rate of prediabetes. It outper-
formed models like Random Forest, Decision Tree,
Gradient Boosting, Neural Networks, and SVMs.
To lower the risk of developing diabetes, the sug-
gested approach provides a way to implement tailored
healthcare plans and early intervention.
Future efforts will focus on incorporating a sweat-
based wearable device for non-invasive glucose moni-
toring, refining the sensitivity and accuracy of the sen-
sor technology. Furthermore, a more extensive and
varied dataset will be utilized to enhance the model’s
applicability to various demographic groups. The op-
timization of machine learning models to enhance the
trade-off between computing efficiency and accuracy
is another area of study, particularly when applied to
real-time healthcare applications. Finally, to assess
the suggested system’s efficacy in practical situations,
clinical trials will be required.
REFERENCES
Anwar, A. A. (2024). Prediabetes progression. https:
//github.com/adeemali/prediabetesProgression. Ac-
cessed: 2024-09-26.
Association, A. D. (2010). Diagnosis and classifica-
tion of diabetes mellitus. Diabetes care, 33(Supple-
ment 1):S62–S69.
Bansal, N. (2015). Prediabetes diagnosis and treatment: a
review. World journal of diabetes, 6(2):296.
Barrett, G. B. (2000). The coefficient of determination: Un-
derstanding r squared and r squared. The Mathematics
Teacher, 93(3):230–234.
Belsky, N., Tamaroff, J., and Shoemaker, A. H. (2023). Risk
factors for progression to type 2 diabetes in a pedi-
atric prediabetes clinic population. Journal of the En-
docrine Society, 7(11):bvad118.
Bennasar-Veny, M., Fresneda, S., L
´
opez-Gonz
´
alez, A.,
Busquets-Cort
´
es, C., Aguil
´
o, A., and Ya
˜
nez, A. M.
(2020). Lifestyle and progression to type 2 diabetes
in a cohort of workers with prediabetes. Nutrients,
12(5):1538.
Bradley, A. P. (1997). The use of the area under the
roc curve in the evaluation of machine learning algo-
rithms. Pattern recognition, 30(7):1145–1159.
ICAART 2025 - 17th International Conference on Agents and Artificial Intelligence
262

Breiman, L. (2001). Random forests. Machine learning,
45(1):5–32.
Bruen, D., Delaney, C., Florea, L., and Diamond, D. (2017).
Glucose sensing for diabetes monitoring: recent de-
velopments. Sensors, 17(8):1866.
Budiastutik, I., Kartasurya, M. I., Subagio, H. W., and Wid-
janarko, B. (2022). High prevalence of prediabetes
and associated risk factors in urban areas of pontianak,
indonesia: A cross-sectional study. Journal of Obe-
sity, 2022(1):4851044.
Cahn, A., Shoshan, A., Sagiv, T., Yesharim, R., Goshen,
R., Shalev, V., and Raz, I. (2020). Prediction
of progression from pre-diabetes to diabetes: de-
velopment and validation of a machine learning
model. Diabetes/Metabolism Research and Reviews,
36(2):e3252.
Chauhan, A. S., Varre, M. S., Izuora, K., Trabia, M. B., and
Dufek, J. S. (2023). Prediction of diabetes mellitus
progression using supervised machine learning. Sen-
sors, 23(10):4658.
Drucker, H., Burges, C. J., Kaufman, L., Smola, A., and
Vapnik, V. (1996). Support vector regression ma-
chines. Advances in neural information processing
systems, 9.
Echouffo-Tcheugui, J. B. and Selvin, E. (2021). Prediabetes
and what it means: the epidemiological evidence. An-
nual review of public health, 42(1):59–77.
Friedman, J. H. (2001). Greedy function approximation: A
gradient boosting machine. Annals of statistics, pages
1189–1232.
Haffner, S. M. (2003). Insulin resistance, inflammation, and
the prediabetic state. The American journal of cardi-
ology, 92(4):18–26.
JhaJay, C., ChowBryna, S., CooperMark, E., et al. (2016).
Diabetes and kidney disease: role of oxidative stress.
Antioxidants & redox signaling.
Katsarou, A., Gudbj
¨
ornsdottir, S., Rawshani, A., Dabelea,
D., Bonifacio, E., Anderson, B. J., Jacobsen, L. M.,
Schatz, D. A., and Lernmark,
˚
A. (2017). Type 1
diabetes mellitus. Nature reviews Disease primers,
3(1):1–17.
Klein, R. and Klein, B. E. (1995). Vision disorders in dia-
betes. Diabetes in America, 1:293.
Lee, J., Xue, X., Au, E., McIntyre, W. B., Asgariroozbe-
hani, R., Panganiban, K., Tseng, G. C., Papoulias,
M., Smith, E., Monteiro, J., et al. (2024). Glucose
dysregulation in antipsychotic-naive first-episode psy-
chosis: in silico exploration of gene expression signa-
tures. Translational Psychiatry, 14(1):19.
Liu, H., Li, Z., Che, S., Feng, Y., Guan, L., Yang, X., Zhao,
Y., Wang, J., Zvyagin, A. V., Yang, B., et al. (2022).
A smart hydrogel patch with high transparency, ad-
hesiveness and hemostasis for all-round treatment and
glucose monitoring of diabetic foot ulcers. Journal of
Materials Chemistry B, 10(30):5804–5817.
Liu, Y., Yang, L., and Cui, Y. (2024). A wear-
able, rapidly manufacturable, stability-enhancing mi-
croneedle patch for closed-loop diabetes management.
Microsystems & nanoengineering, 10(1):112.
Long, J., Yang, Z., Wang, L., Han, Y., Peng, C., Yan, C.,
and Yan, D. (2020). Metabolite biomarkers of type 2
diabetes mellitus and pre-diabetes: A systematic re-
view and meta-analysis. BMC endocrine disorders,
20:1–17.
Mansourian, M., Yazdani, A., Faghihimani, E., Aminor-
raya, A., Amini, M., and Jafari-Koshki, T. (2020).
Factors associated with progression to pre-diabetes:
a recurrent events analysis. Eating and Weight
Disorders-Studies on Anorexia, Bulimia and Obesity,
25:135–141.
Menke, A., Knowler, W. C., and Cowie, C. C. (2021). Phys-
ical and metabolic characteristics of persons with di-
abetes and prediabetes. Europepmc.
Mohamed, J., Nafizah, A. N., Zariyantey, A., and Budin, S.
(2016). Mechanisms of diabetes-induced liver dam-
age: the role of oxidative stress and inflammation. Sul-
tan qaboos university medical journal, 16(2):e132.
Mustafa, I. (2021). Diabetes prediction dataset.
https://www.kaggle.com/datasets/iammustafatz/
diabetes-prediction-dataset. Accessed: 2024-09-26.
Organization, W. H. (2023). Diabetes. Accessed: 28-Sep-
2024.
Perveen, S., Shahbaz, M., Keshavjee, K., and Guergachi,
A. (2019). Prognostic modeling and prevention of di-
abetes using machine learning technique. Scientific
reports, 9(1):13805.
Quinlan, J. R. (1986). Induction of decision trees. Machine
learning, 1(1):81–106.
Rumelhart, D. E., Hinton, G. E., and Williams, R. J. (1986).
Learning representations by back-propagating errors.
Nature, 323(6088):533–536.
Seber, G. A. F. and Lee, A. J. (2003). Linear Regression
Analysis. John Wiley & Sons.
Sokolova, M. and Lapalme, G. (2009). A systematic analy-
sis of performance measures for classification tasks.
Information Processing & Management, 45(4):427–
437.
Willmott, C. J. and Matsuura, K. (2005). Advantages of the
mean absolute error (mae) over the root mean square
error (rmse) in assessing average model performance.
Climate research, 30(1):79–82.
Zhang, J., Xu, J., Lim, J., Nolan, J. K., Lee, H., and
Lee, C. H. (2021). Wearable glucose monitor-
ing and implantable drug delivery systems for dia-
betes management. Advanced Healthcare Materials,
10(17):2100194.
Machine Learning-Driven Monitoring for Early Detection and Management of Prediabetes
263
