
A U-Net-Based Temperature Bias Correction Method for the
REMO2015 Regional Climate Model in CORDEX-EA
Shibin Zheng
1
, Chenwei Shen
2
and Bin Li
2
1
School of Computer and Artificial Intelligence, Zhengzhou University, Zhengzhou, China
2
Dawning Information Industry Company Limited, Beijing, China
Keywords: Bias Correction, CORDEX East Asia, Deep Learning, U-Net.
Abstract: Regional climate models suffer from insufficient resolution and deficiencies in their dynamic processes,
leading to systematic biases in surface air temperature simulations that require correction. In this research, a
deep learning bias correction model, CE-MS-Unet, is proposed. This model incorporates multi-scale residual
blocks and calendar month data to improve surface air temperature simulations of the REMO2015 regional
climate model during the second phase of the Coordinated Regional Downscaling Experiment East Asia
(CORDEX-EA-II) over mainland China. Experimental results indicate that, compared to Linear Scaling,
Quantile Delta Mapping, and the deep learning model CU-net, CE-MS-Unet performs better in correcting
climate averages and seasonal cycles, resulting in corrected data with greater overall agreement and improved
spatial correlation. It effectively reduces biases and provides more accurate climate predictions. This study
offers new insights and methods to improve the bias correction of temperature in regional climate models.
1 INTRODUCTION
In the field of climatology, Global Climate Models
(GCMs), which couple global atmospheric, oceanic,
and terrestrial systems, are widely used for studying
long-term climate change and future climate
projections. However, the relatively low grid
resolution of GCMs limits their capacity to accurately
capture climate changes on a regional scale. The
application of dynamically downscaled Regional
Climate Models (RCMs) driven by GCMs within a
region can provide higher-resolution local
information, thereby enhancing the accuracy of
detailed climate impact assessments (Giorgi et al.,
1999). The Coordinated Regional Climate
Downscaling Experiment (CORDEX), launched by
the World Climate Research Programme (WCRP),
provides high-resolution regional climate projections
for land areas inhabited by most of the global
population using multiple RCMs (Gutowski et al.,
2016). This study focuses on CORDEX-East Asia
(CORDEX-EA), the East Asian branch of the
CORDEX program. Previous studies indicates that
the RCMs used in the CORDEX-EA-II experiments
can effectively simulate and project surface air
temperature and precipitation (Yu et al., 2020).
However, due to the inherent limitations in
dynamical processes and physical parameterization
within RCMs, as well as biases inherited from their
driving GCMs, the simulated outputs still have
considerable systematic biases. Statistical bias
correction methods are commonly used to reduce
biases and improve the accuracy of future climate
projections. These methods establish a statistical
relationship between simulated and observed data to
minimize their distributional differences. Two widely
used techniques are Linear Scaling (LS) and Quantile
Delta Mapping (QDM). LS adjusts the mean or
standard deviation of data through a simple linear
transformation and efficiently corrects seasonal
temperature variations (Chen et al., 2022). However,
it assumes the correction factor remains valid under
future climate conditions, which can lead to
inaccuracies as the climate changes. QDM, an
advanced version of Quantile Mapping (QM),
corrects both the distribution and trends of simulated
data by mapping quantile changes while retaining the
model's predicted climate change signals. (Tong et
al., 2021). Nevertheless, QDM is less effective at
managing spatial correlations and intermittency.
In recent years, deep learning models have been
increasingly utilized in meteorology, resulting in the
development of numerous artificial neural network-
based bias correction methods (de Burgh-Day et al.,
Zheng, S., Shen, C. and Li, B.
A U-Net-Based Temperature Bias Correction Method for the REMO2015 Regional Climate Model in CORDEX-EA.
DOI: 10.5220/0013104200003905
In Proceedings of the 14th International Conference on Pattern Recognition Applications and Methods (ICPRAM 2025), pages 563-570
ISBN: 978-989-758-730-6; ISSN: 2184-4313
Copyright © 2025 by Paper published under CC license (CC BY-NC-ND 4.0)
563

2023). Originating from computer vision, these
models treat meteorological bias correction as a
regression task for fitting image features, using raw
data as input predictors for training. Several bias
correction methods based on Generative Adversarial
Networks (GANs) have been proposed. GANs can be
trained on unpaired image data to learn the bias
distribution of GCMs and generate corrected images,
making them naturally effective for adjusting GCM
outputs without corresponding observational data and
capturing spatial precipitation patterns (Pan et al.,
2021; Hess et al., 2023). Additionally, convolutional
neural network(CNN)-based methods that are widely
used in short-term weather forecasting have shown
their potential in climate model bias correction and
downscaling (Sha et al., 2020). CNN-based models
extract multi-scale spatial features through
convolutional and pooling layers, use multi-channel
input data to capture complex nonlinear relationships
between different variables, thereby potentially
improving the bias correction performance of GCMs
or RCMs (Kesavavarthini et al., 2023; Wang and Tian,
2022). Recently, the U-net, a CNN derivative
originally developed for medical image segmentation,
has also been applied to meteorological bias
correction (Molina et al., 2023). With its encoder-
decoder structure, U-net can effectively extract
features and restores spatial information. Compared
to traditional CNNs, it captures multi-scale spatial
details while producing outputs that match the
original image size.
Although previous work on bias correction for
RCMs in the CORDEX-EA experiments has
primarily employed traditional statistical methods, no
studies have explored deep learning-based correction
approaches (Chen et al., 2022; Tong et al., 2021). To
improve surface air temperature simulations of
regional climate models in the CORDEX-EA-II
experiments over mainland China, this study
implements a deep learning bias correction model
based on U-net. The choice to forgo a GAN-based
approach was driven by two main reasons: first, the
large data requirements of GANs are challenging to
meet given that the CORDEX-EA experiment's
simulations span only up to 35 years; and second, the
instability and convergence challenges inherent in the
GAN's architecture complicates its application and
training (Yu et al., 2024). This research introduces a
new CE-MS-Unet model that incorporates multi-
scale residual blocks and one-hot encoding of
calendar month data. When applied to surface air
temperature bias correction in the REMO2015
regional climate model, this model achieves better
overall agreement and more accurate temperature
cycle correction compared to traditional methods and
the CU-net model. Consequently, it can support more
reliable long-term regional surface air temperature
predictions.
The paper is organized as follows: Section 2
details the study area and data preprocessing steps.
Section 3 describes the implemented bias correction
methods, including two statistical and two deep
learning approaches. Section 4 covers the
experimental setup and analyzes the results, while
Section 5 concludes with a summary.
2 STUDY AREA AND DATA
As shown in Figure 1, this study focuses on a region
from the CORDEX-EA-II experiment that primarily
covers mainland China, extending from 18°N to 55°N
and from 75°E to 135°E. To further evaluate the
performance of various bias correction methods at a
smaller spatial scale, five subregions within the study
area were selected.
Figure 1: Topography of the study area and its five
subregions: Southern China (SC), Northern China (NC),
Northeastern China (NE), Northwestern China (NW), and
the Tibetan Plateau (TP).
The bias correction uses RCM output data from
REMO2015, developed by the Climate Service
Center Germany (GERICS). TAS, TASMAX and
TASMIN were selected from the historical simulation
data of CORDEX-EA-II experiment. Additionally,
digital elevation model (DEM) data were included.
These features are related to air temperature within
the climate system, which can improve the accuracy
of the deep learning model in correcting temperature
biases (Zhang et al., 2022). The Asian Precipitation-
Highly-Resolved Observational Data Integration
ICPRAM 2025 - 14th International Conference on Pattern Recognition Applications and Methods
564

Towards the Evaluation of Water Resources
(APHRODITE, abbreviated as APHRO) gridded
dataset(V1101) was used as reference data. Detailed
information about datasets is provided in Table 1.
Table 1: Datasets used in this study.
Datasets Variables used
Temporal
APHRO
DITE
Daily Mean Temperature
(
TAVE
)
1971-
2005
SRTM
Digital Elevation Model
(
DEM
)
1971-
2005
REMO2
015
Output
Near-Surface Air
Temperature (TAS)
1971-
2005
Daily Minimum Near-
Surface Air Temperature
(TASMIN)
Daily Maximum Near-
Surface Air Temperature
(
TASMAX
)
Bilinear interpolation was applied to resample the
meteorological variables from REMO2015 to align
with the 0.25° × 0.25° resolution of the APHRO
dataset. For deep learning methods, data from 1971 to
2000 were used for training and validation, while data
from 2001 to 2005 served as the test set. To enable
the model to learn temperature variation patterns
across different climate states, a strategy similar to
Pan et al. (2021) was employed: from 1971, the first
four years of each five-year period were included in
the training set, with the final year in the validation
set. For each time step T within these datasets,
reference data from the same month within a five-
year window around T were randomly selected as the
target data. All meteorological variables were
standardized using Z-score normalization.
3 METHODS
This study implemented two widely used statistical
methods and two U-net based deep learning methods.
LS and QDM were selected as baseline statistical
methods for the CE-MS-Unet model, while the CU-
net model was used as the baseline for the deep
learning methods.
3.1 Linear Scaling
Linear Scaling aims to minimize the mean bias
between RCM predictions and observational data
over monthly time series (Teutschbein and Seibert,
2012). An additive scaling approach is used to
compute the corrected value of meteorological
variable X at time step i:
X
bc,p
i
= X
sim,p
i
+ μ
m
X
obs,c
i
-
μ
m
X
sim,c
i
(1)
Where μ
m
X
…
i
is the long-term monthly average
temperature for the month corresponding to time step
i. In the subscripts, sim denotes the RCM simulated
value, obs the observed value, bc the bias-corrected
value, p the scenario period, and c the control period.
3.2 Quantile Delta Mapping
Quantile Delta Mapping is a technique used to correct
distributional biases between RCM predictions and
observational data. Unlike the conventional Quantile
Mapping method, QDM not only matches RCM data
with observational data during the control period but
also accounts for changes between the control period
and the scenario period (Tong et al., 2021).
Specifically, for the simulated climate variable X,
the non-exceedance probability ε
i
at time step i
during the scenario period is first calculated:
ε
i
= F
sim,p
X
sim,p
i
(2)
Next, the bias-corrected value X
bc,p
'
(i) is determined
by substituting the non-exceedance probability into
the inverse cumulative distribution function of the
observational data from the control period:
X
b
c,
p
'
(i) = F
obs,c
-1
ε
i
(3
)
The absolute change in quantiles between control
period and scenario period is then calculated as:
∆
i
= F
sim,p
-1
ε
i
- F
sim,c
-1
ε
i
= X
sim,p
i
-
F
sim,c
-1
F
sim,
p
X
sim,
p
i
(4)
At the time step i during scenario period, the final
corrected temperature is obtained by adding the
absolute change amount to the bias-corrected value.
X
b
c,p
i
= X
b
c,p
'
(i) + ∆
i
(5)
3.3 CU-Net
Based on the study by Han et al. (2021), we introduce
the CU-net model to correct the surface air temperatu-
re simulation biases of the REMO2015 regional
climate model. CU-net is a deep learning model
A U-Net-Based Temperature Bias Correction Method for the REMO2015 Regional Climate Model in CORDEX-EA
565
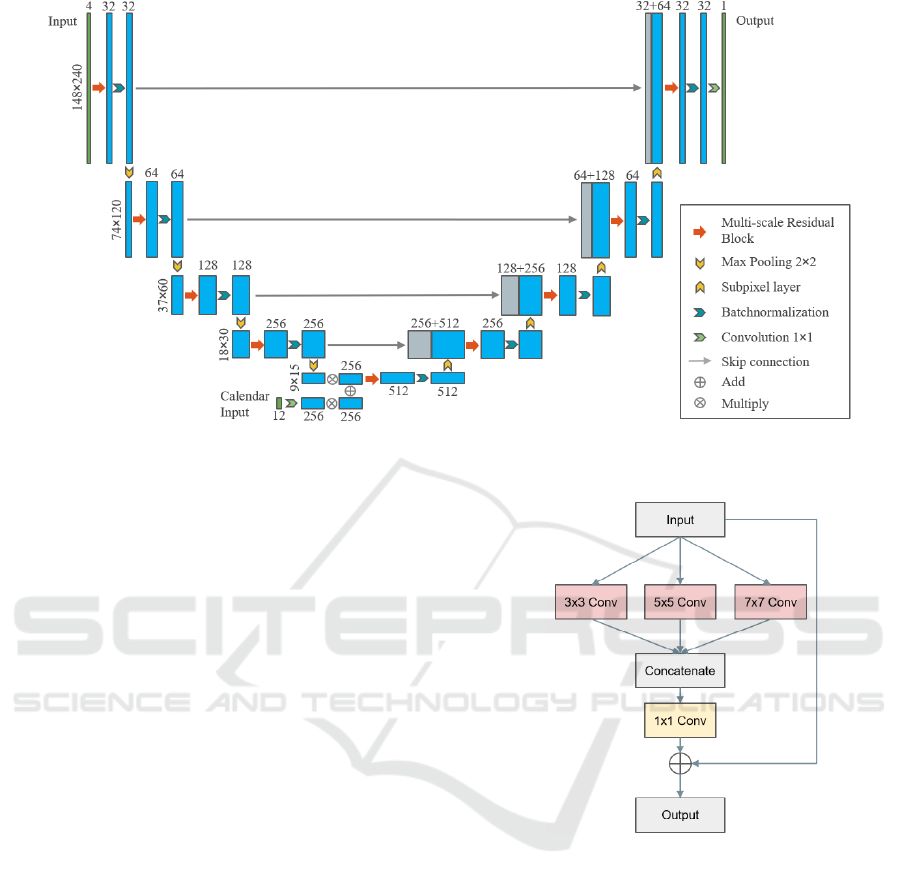
Figure 2: Architecture of the CE-MS-Unet model. The model has two input layers: one for meteorological factors and the
other for calendar month data.
designed for bias correction in meteorology, with an
architecture similar to U-net. When meteorological
data is fed into CU-net, the left half of its U-shaped
structure, consisting of a CNN-based convolutional
encoding module, automatically extracts high-level
features from the data. The right half, which consists
of an upsampling module, performs decoding
operations to progressively restore the compressed
feature maps to their original size. During this
upsampling process, CU-net employs the "copy and
concatenate" operation that merges feature maps from
the encoder and decoder along the channel dimension.
CU-net differs from the original U-net in its use
of sub-pixel convolution in the decoder. When
applied to the expansion of meteorological feature
maps, sub-pixel convolution enhances computational
efficiency and reduces the loss of valuable
information during image reconstruction.
3.4 CE-MS-Unet
Building upon the CU-net architecture, this study
introduces multi-scale residual blocks and one-hot
encoding of calendar month data, leading to a new
model: the Calendar-Embedded Multi-Scale Residual
U-net (CE-MS-Unet). Figure 2 illustrates the
structure of CE-MS-Unet. CE-MS-Unet replaces the
sequential convolutions in each layer with multi-scale
residual blocks and incorporates calendar month data
as additional input at the deepest layer.
Figure 3: Structure of the multi-scale residual block.
Biases in RCM temperature simulations may
result from interactions between climate processes
occurring at different spatial scales, such as local
effects and large-scale weather systems. Therefore,
more effectively capturing meteorological features
across multiple spatial scales can potentially improve
bias correction performance (Faijaroenmongkol et al.,
2023). As shown in Figure 3, the Multi-Scale
Residual Block captures multi-scale information in
the temperature field using parallel convolutional
kernels of different sizes. These multi-scale features
are then fused and passed to the next network layer
through a Residual Connection. The use of feature
fusion and residual connections stabilizes deep
network training, helping prevent overfitting and
reduce noise and uncertainty in temperature data.
ICPRAM 2025 - 14th International Conference on Pattern Recognition Applications and Methods
566

Additionally, the Exponential Linear Unit (ELU)
activation function is used in all convolutional layers.
Temperature shows significant seasonal
variations, with distinct patterns and characteristics
across different months. The use of calendar data in
deep learning models has been successfully applied to
precipitation bias correction (Ling et al., 2022). To
improve the model's ability to capture temperature
bias characteristics across different months and
seasons, calendar month data was used as an
additional input. These data are represented as a 12-
dimensional one-hot encoded vector, where each
dimension corresponds to a month and is then fused
with the feature maps at the model’s deepest layer.
Before fusion, learnable scaling factors are applied to
dynamically adjust the weights of the two data
sources, optimizing their relative influence during the
fusion process. Introducing calendar month data at
the deepest layer is intended to preserve the CU-net
model's original spatial feature extraction capabilities
while integrating temporal information with high-
level abstract features, thereby enhancing the model's
final correction output more effectively.
4 EXPERIMENT AND RESULTS
4.1 Training Setting
During training, the ADAM optimizer was used with
an initial learning rate of 0.001 and a batch size of 16.
The total number of epochs was set to 50. Dynamic
learning rate adjustment were employed: if the
validation loss did not decrease for two consecutive
epochs, the learning rate was halved. After training,
the model weights with the lowest validation loss
were saved. Both models utilized a custom loss
function that considers the Mean Squared Error (MSE)
at each grid point, as well as the MSE of the overall
data mean and standard deviation, defined as follows:
L = MSEy
i
-y
i
'
+ 3 × MSEy
mean
-
y
m
ea
n
'
+ 3 × MSEy
s
t
d
-y
s
t
d
'
(6)
Where y
i
and y
i
'
represent the observed and corrected
values, with the subscripts mean and std denoting
their mean and standard deviation, respectively.
Both deep learning models were implemented
using TensorFlow 2.9 and Python 3.9 and were
trained on four GPU-like accelerators. The
accelerator adopts a GPU-like architecture consisting
of a 16GB HBM2 device memory and many compute
units, with peak FP64 performance of 7.0TFLOPS.
4.2 Statistical Performance Metrics
To evaluate the effectiveness of each bias correction
method, mean absolute error (MAE), root mean
squared error (RMSE), and spatial correlation
coefficient (SCC) were employed. MAE and RMSE
is calculated as:
MAE =
1
n
∑
y
i
-y
i
'
n
i=1
(7)
RMSE =
1
n
∑
y
i
-y
i
'
2
n
i=1
(8)
Where y
i
is the observed values and y
i
'
is the corrected or original
values. The Spatial Correlation Coefficient (SCC) is
used to evaluate the correlation between the spatial
distributions of temperature values before and after
correction:
SCC =
∑
x
i
-x
n
i=1
y
i
-y
∑
x
i
-x
2
n
i=1
∑
y
i
-y
2
n
i=1
(9)
Where x
i
and y
i
represent the values in the observed
and corrected spatial distributions, and x and y are
their respective means.
4.3 Results
4.3.1 Overall Agreement
The overall agreement between the corrected and
observed surface air temperature was evaluated using
MAE and RMSE values calculated for each grid point
across the entire study area and its five subregions.
Detailed results are presented in Table 2. Across the
study area, four corrected results exhibited different
levels of improvement over the original RCM data.
LS showed a slight advantage compared to QDM,
whereas CU-Net and CE-MS-Unet outperformed LS.
CE-MS-Unet performed the best, reducing the MAE
and RMSE values by 0.23 and 0.24 respectively,
compared to CU-Net. The four methods varied in
performance across subregions. Among statistical
methods, QDM outperformed LS in MAE and RMSE
in the NW and TP regions, while LS performed better
in the others. For deep learning methods, CE-MS-
Unet consistently surpassed CU-Net across all
regions. In four of the five subregions (excluding TP),
deep learning methods showed better consistency
than statistical methods, with CE-MS-Unet yielding
A U-Net-Based Temperature Bias Correction Method for the REMO2015 Regional Climate Model in CORDEX-EA
567
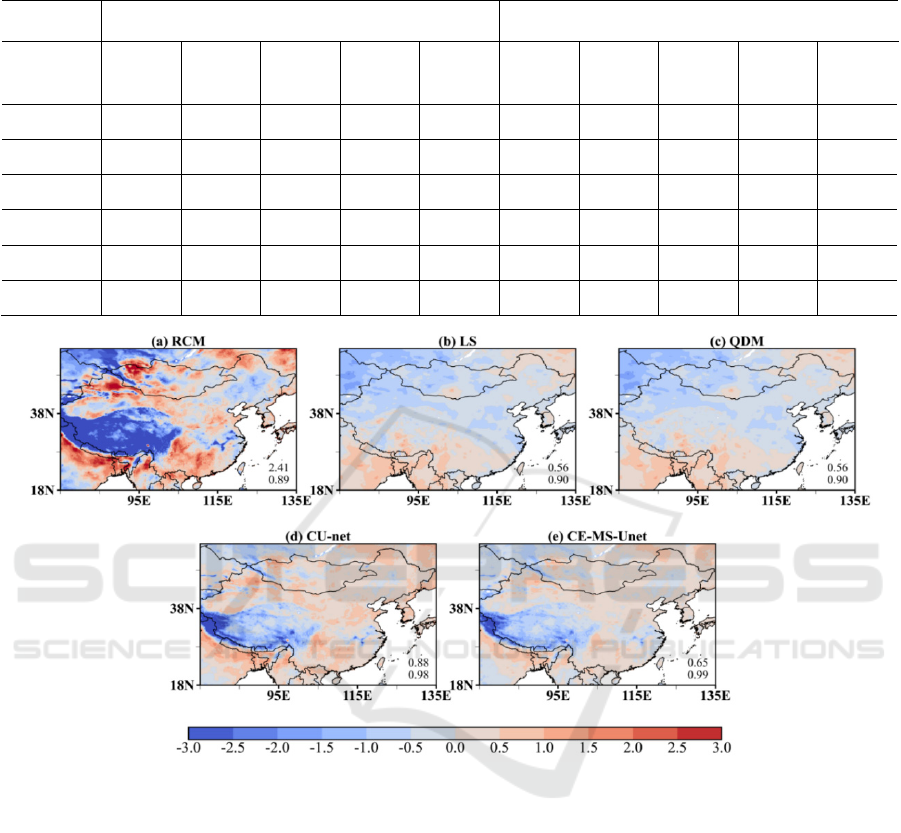
Table 2: MAE and RMSE values for RCM output and four bias-corrected results across the entire study area and its five
subregions, the best-performing values are highlighted in bold.
MAEs RMSEs
Regions RCM LS QDM CU-Net
CE-
MS-
Unet
RCM LS QDM CU-Net
CE-
MS-
Unet
SC 3.24 2.97 3.08 2.18 1.94 4.21 3.89 4.08 2.89 2.58
NC 3.65 3.28 3.38 2.67 2.46 4.70 4.25 4.41 3.42 3.12
NE 3.97 3.69 3.68 3.01 2.66 4.99 4.62 4.69 3.75 3.27
NW 2.94 2.28 2.18 2.07 1.90 3.71 2.93 2.83 2.59 2.37
TP 4.38 2.37 2.09 2.75 2.59 5.63 3.09 2.71 3.69 3.45
Overall 4.58 3.93 4.01 3.88 3.65 6.05 5.24 5.41 5.19 4.95
Figure 4: Spatial-distribution of mean temperature biases for the testing period (2001-2005) from (a) RCM and (b-e) four
bias-correction methods (unit: ℃). The spatial average RMSEs (the upper one) and annual average daily map correlations
(the lower one) between the RCM/corrected outputs and observations are provided in lower right corner of the panels.
the best results. In the TP region, the complex terrain
results in larger biases in RCM simulations.
Traditional methods process data in a relatively
simple way, making them better suited to this
scenario. In contrast, deep learning models struggle to
learn temperature bias characteristics due to the large
amount of high-error data. Consequently, QDM
performs best in the TP region. These results suggest
that, in terms of overall agreement with surface air
temperature data, the two U-Net-based deep learning
methods provide superior corrections across most
regions, with CE-MS-Unet yielding the most
consistent results.
4.3.2 Spatial Distribution Bias
As shown in Figure 4, the five-year average
temperature bias between the corrected results and
observational data was calculated to assess each
method's ability to correct spatial biases. The RMSE
of the original data’s annual average temperature
reached 2.41, while all four correction methods
significantly reduced this bias, lowering the RMSE to
below 1. Owing to their superior spatial feature
extraction capability, CU-net and CE-MS-Unet not
only effectively reduced the bias but also better
preserved the original spatial patterns of the RCM.
ICPRAM 2025 - 14th International Conference on Pattern Recognition Applications and Methods
568
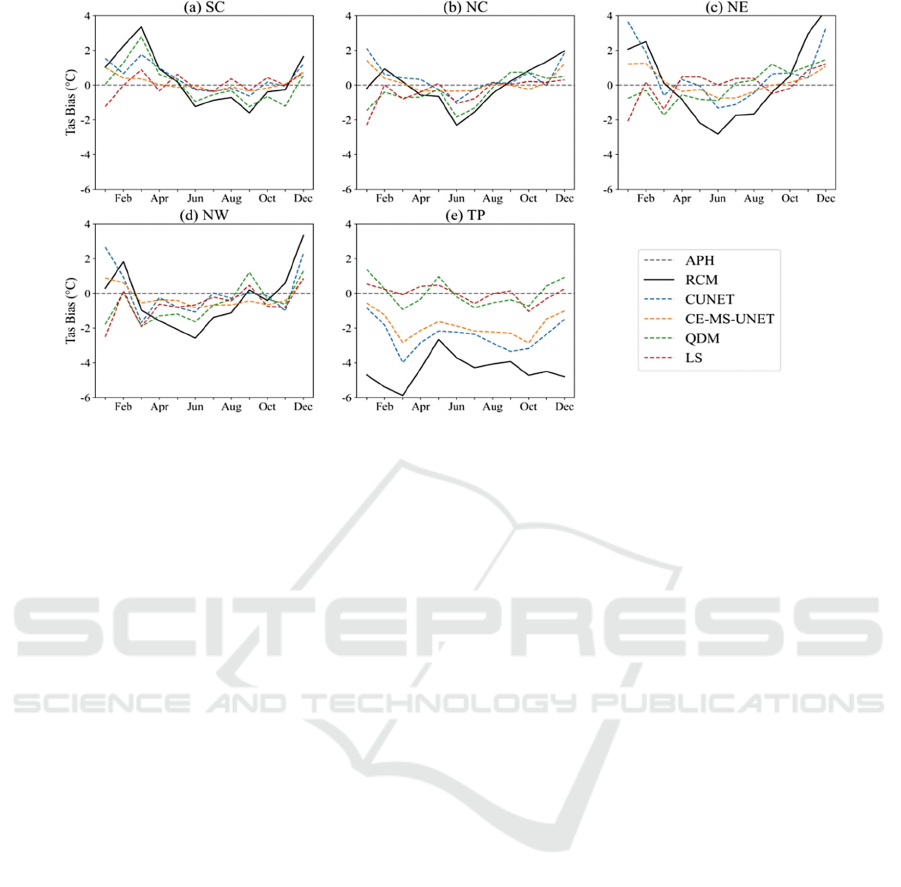
Figure 5: Annual cycles of temperature biases from REMO2015 and four bias-correction results over five subregions.
CE-MS-Unet reduced the bias to below 1°C in most
regions and eliminated the cold bias in high-latitude
areas seen with LS and QDM, resulting in a more
balanced cold-warm bias distribution.
Additionally, the spatial correlation coefficients
(SCC) between the five-year annual average
temperatures of each dataset and the observational
data were calculated. The results indicated that the
original RCM data had a SCC of 0.98, while all four
correction methods improved it to 1. To further assess
each method's ability to enhance spatial correlation,
the approach of Wang and Tian (2022) was employed.
This method flattens the 2D spatial data into a 1D
vector to calculate daily map correlations, which are
then averaged over the 5 years. Figure 4 indicates that
CE-MS-Unet achieved the highest annual average
daily map correlation. Although CU-net also
demonstrated a relatively high map correlation, its
RMSE was notably higher. Taking both metrics into
account, CE-MS-Unet has a clear advantage in
correcting spatial biases of temperature.
4.3.3 Temporal Skill
Figure 5 illustrates the regional monthly mean
temperature biases between the corrected results and
observational data. In four subregions excluding TP,
CE-MS-Unet, LS, and QDM significantly reduced
the monthly mean temperature bias, bringing it below
1°C for most months and closely matching the
observational climatology. CU-Net reduced the bias
in average temperatures for spring, summer, and
autumn, but showed a substantial warm bias in winter.
CE-MS-Unet effectively addressed the winter bias
issue observed in CU-Net and demonstrated
comparable capabilities to LS and QDM across four
subregions. Moreover, the deviations in the lowest
and highest monthly mean temperatures corrected by
LS and QDM were around 3°C, while those corrected
by CE-MS-Unet were closer to 2°C, indicating
thatCE-MS-Unet had less variability than the
traditional methods. In the TP region, both deep
learning methods were less effective than LS and
QDM in reducing the significant cold bias in RCM
simulations. This result aligns with the overall
agreement section and is attributed to higher errors
and lower data quality in the region's simulations.
5 CONCLUSIONS
To improve the accuracy of surface air temperature
simulations from the REMO2015 model within the
CORDEX-EA project over mainland China, we
presented a U-Net-based bias correction model, CE-
MS-Unet. Experimental results demonstrate that,
compared to traditional statistical methods like Linear
Scaling and Quantile Delta Mapping, as well as the
existing deep learning model CU-net, CE-MS-Unet is
better at capturing the spatial and temporal features of
surface air temperature. This improvement is
achieved by incorporating multi-scale residual blocks
and embedding calendar month data. In East Asia,
CE-MS-Unet excels in reducing MAE and RMSE,
while also providing superior correction for spatial
distribution and seasonal cycles. Although slightly
inferior to QDM in the Tibetan Plateau, CE-MS-Unet
A U-Net-Based Temperature Bias Correction Method for the REMO2015 Regional Climate Model in CORDEX-EA
569

overall outperforms LS, QDM, and CU-net in
correcting spatial and temporal biases in
REMO2015’s surface air temperature simulations.
Future work could explore further adjustments to
the CE-MS-Unet structure, such as integrating
attention mechanisms, designing more sophisticated
methods for calendar data fusion, and enhancing the
model's bias correction performance in the Tibetan
Plateau. Ablation studies could also be conducted to
improve the model's interpretability. Additionally,
testing CE-MS-Unet's performance in CORDEX
experiments outside East Asia would help validate its
generalization and applicability.
ACKNOWLEDGEMENTS
This work was supported by the State Key RandD
Program of China (No. 2021YFB0300200).
REFERENCES
Giorgi, F., and Mearns, L. O. (1999). Introduction to special
section: Regional climate modeling revisited. Journal
of Geophysical Research: Atmospheres, 104(D6),
6335-6352.
Gutowski Jr, W. J., Giorgi, F., Timbal, B., Frigon, A., Jacob,
D., Kang, H.-S., Krishnan, R., Lee, B., Lennard, C., and
Nikulin, G. (2016). WCRP coordinated regional
downscaling experiment (CORDEX): a diagnostic MIP
for CMIP6.
Yu, K., Hui, P., Zhou, W., and Tang, J. (2020). Evaluation
of multi‐RCM high‐resolution hindcast over the
CORDEX East Asia Phase II region: Mean, annual
cycle and interannual variations. International Journal
of Climatology, 40(4), 2134-2152.
Chen, J., Yang, Y., and Tang, J. (2022). Bias correction of
surface air temperature and precipitation in CORDEX
East Asia simulation: What should we do when
applying bias correction?. Atmospheric Research, 280,
106439.
Tong, Y., Gao, X., Han, Z., Xu, Y., Xu, Y., and Giorgi, F.
(2021). Bias correction of temperature and precipitation
over China for RCM simulations using the QM and
QDM methods. Climate Dynamics, 57, 1425-1443.
de Burgh-Day, C. O., and Leeuwenburg, T. (2023).
Machine learning for numerical weather and climate
modelling: a review. Geoscientific Model
Development, 16(22), 6433-6477.
Kesavavarthini, T., Rajesh, A. N., Venkata Srinivas, C., and
Kumar, T. L. (2023). Bias correction of CMIP6
simulations of precipitation over Indian monsoon core
region using deep learning algorithms. International
Journal of Climatology, 43(8), 3749-3767.
Molina, M. J., O’Brien, T. A., Anderson, G., Ashfaq, M.,
Bennett, K. E., Collins, W. D., Dagon, K., Restrepo, J.
M., and Ullrich, P. A. (2023). A review of recent and
emerging machine learning applications for climate
variability and weather phenomena. Artificial
Intelligence for the Earth Systems, 2(4), 220086.
Sha, Y., Gagne II, D. J., West, G., and Stull, R. (2020).
Deep-learning-based gridded downscaling of surface
meteorological variables in complex terrain. Part I:
Daily maximum and minimum 2-m
temperature. Journal of Applied Meteorology and
Climatology, 59(12), 2057-2073.
Yu, S., Chakraborty, I., Anderson, G. J., Lucas, D. D., Lops,
Y., and Galea, D. (2024). UFNet: Joint U-Net and fully
connected neural network to bias correct precipitation
predictions from climate models. Artificial Intelligence
for the Earth Systems.
Wang, F., and Tian, D. (2022). On deep learning-based bias
correction and downscaling of multiple climate models
simulations. Climate dynamics, 59(11), 3451-3468.
Ling, F., Li, Y., Luo, J. J., Zhong, X., and Wang, Z. (2022).
Two deep learning-based bias-correction pathways
improve summer precipitation prediction over
China. Environmental Research Letters, 17(12),
124025.
Zhang, Y., Chen, M., Han, L., Song, L., and Yang, L.
(2022). Multi-element deep learning fusion correction
method for numerical weather prediction. Acta
Meteorol. Sin, 80, 153-167.
Pan, B., Anderson, G. J., Goncalves, A., Lucas, D. D.,
Bonfils, C. J., Lee, J., Tian, Y., and Ma, H. Y. (2021).
Learning to correct climate projection biases. Journal
of Advances in Modeling Earth Systems, 13(10),
e2021MS002509.
Hess, P., Lange, S., Schötz, C., and Boers, N. (2023). Deep
Learning for Bias‐Correcting CMIP6‐Class Earth
System Models. Earth's Future, 11(10),
e2023EF004002.
Teutschbein, C., and Seibert, J. (2012). Bias correction of
regional climate model simulations for hydrological
climate-change impact studies: Review and evaluation
of different methods. Journal of hydrology, 456, 12-29.
Han, L., Chen, M., Chen, K., Chen, H., Zhang, Y., Lu, B.,
Song, L., and Qin, R. (2021). A deep learning method
for bias correction of ECMWF 24–240 h forecasts.
Advances in Atmospheric Sciences, 38(9), 1444-1459.
Faijaroenmongkol, T., Sarinnapakorn, K., and Vateekul, P.
(2023). Sub-Seasonal Precipitation Bias-Correction in
Thailand Using Attention U-Net With Seasonal and
Meteorological Effects. IEEE Access, 11, 135463-
135475.
ICPRAM 2025 - 14th International Conference on Pattern Recognition Applications and Methods
570
