
MillefioriAnalyzer: Machine Learning, Computer Vision and Visual
Analytics for Provenance Research of Ancient Roman Artefacts
Alexander Wiebel
1 a
, Oliver Gloger
1 b
and Hella Eckardt
2 c
1
UX-Vis Research Group, Worms University of Applied Sciences, Worms, Germany
2
Department of Archaeology, University of Reading, Reading, U.K.
{wiebel, gloger}@hs-worms.de, h.eckardt@reading.ac.uk
Keywords:
Visual Analytics, Computer Vision, Digital Humanities, Ancient Roman Artefacts, Archaeology, Millefiori.
Abstract:
In this position paper, we explore ways to digitally support provenance research of ancient Roman artefacts
decorated with millefiori. In particular, we discuss experiments applying visual analytics, computer vision and
machine learning approaches to analyze the relations between images of individual millefiori slices called flo-
rets. We start by applying automatic image analysis approaches to the florets and discover that image quality
and the small overall number of images pose serious challenges to these approaches. To address these chal-
lenges, we bring human intuition and pattern recognition abilities back into the analysis loop by developing
and employing visual analytics techniques. We achieve a convenient analysis workflow for the archaeologists
by integrating all approaches into a single interactive software tool which we call MillefioriAnalyzer. The soft-
ware is tailored to fit the needs of the archaeological application case and links the automatic image analysis
approaches with the interactive visual analytics views. As appropriate for a research software, MillefioriAna-
lyzer is open-source and publicly available. First results include an automatic approximate ordering of florets
and a visual analytics module improving upon the current manual image layout for further analytic reasoning.
1 INTRODUCTION
A distinctive group of Roman copper alloy objects
has millefiori (‘a thousand flowers’) decoration, small
polychrome patterns created by arranging slices (flo-
rets) of glass rods (canes) in elaborate, highly sym-
metrical and very striking patterns on a copper-alloy
base. An estimated 1200 of these objects are found
across the Roman world but existing overview stud-
ies are long out-dated (e.g. (Exner, 1939); (Henry,
1933)). Despite nearly a hundred years of study, we
have not progressed beyond a general assumption of
production in the Rhineland, Belgium or the Danube
provinces on general stylistic grounds. Research is in-
hibited by the fact that the material is dispersed, cur-
rently very poorly documented and the complexity of
the decorative motifs. Each stud or brooch with mille-
fiori decoration can have between three and five zones
of decoration, using multiple different motifs, with as
many as 100 florets decorating a single object.
This pilot project explores whether it is possible
a
https://orcid.org/0000-0002-6583-3092
b
https://orcid.org/0000-0002-0791-4273
c
https://orcid.org/0000-0001-9288-5624
to use machine learning (ML), computer vision (CV)
and, in particular, visual analytics (VA) to understand
millefiori designs. In particular, and as a first step,
we ask whether it is possible to identify florets from
the same cane – and therefore potentially identify ob-
jects made in the same workshop. These florets are
very small (3x3mm), and distorted from the process
of stretching the cane, making comparison with hu-
man eyes without any digital support difficult. In a
second step, we intend to identify the floret designs,
explore the ’grammar’ of the motifs and color com-
binations and study the placement of different design
on the jewellery. This could help to understand if spe-
cific combinations occur in particular regions. Thus,
the main contributions of this application paper are:
• An analysis of the challenges of applying CV and
ML techniques to millefiori images.
• A prototypical software, MillefioryAnalyzer,
which represents a first step towards supporting
the analysis of collections of millefiori images by
combining CV, ML and visualization techniques
into an application-specific VA system.
• Automation of parts of the archaeological re-
search workflow for millefiori research.
Wiebel, A., Gloger, O. and Eckardt, H.
MillefioriAnalyzer: Machine Learning, Computer Vision and Visual Analytics for Provenance Research of Ancient Roman Artefacts.
DOI: 10.5220/0013098900003912
Paper published under CC license (CC BY-NC-ND 4.0)
In Proceedings of the 20th International Joint Conference on Computer Vision, Imaging and Computer Graphics Theory and Applications (VISIGRAPP 2025) - Volume 1: GRAPP, HUCAPP
and IVAPP, pages 807-814
ISBN: 978-989-758-728-3; ISSN: 2184-4321
Proceedings Copyright © 2025 by SCITEPRESS – Science and Technology Publications, Lda.
807
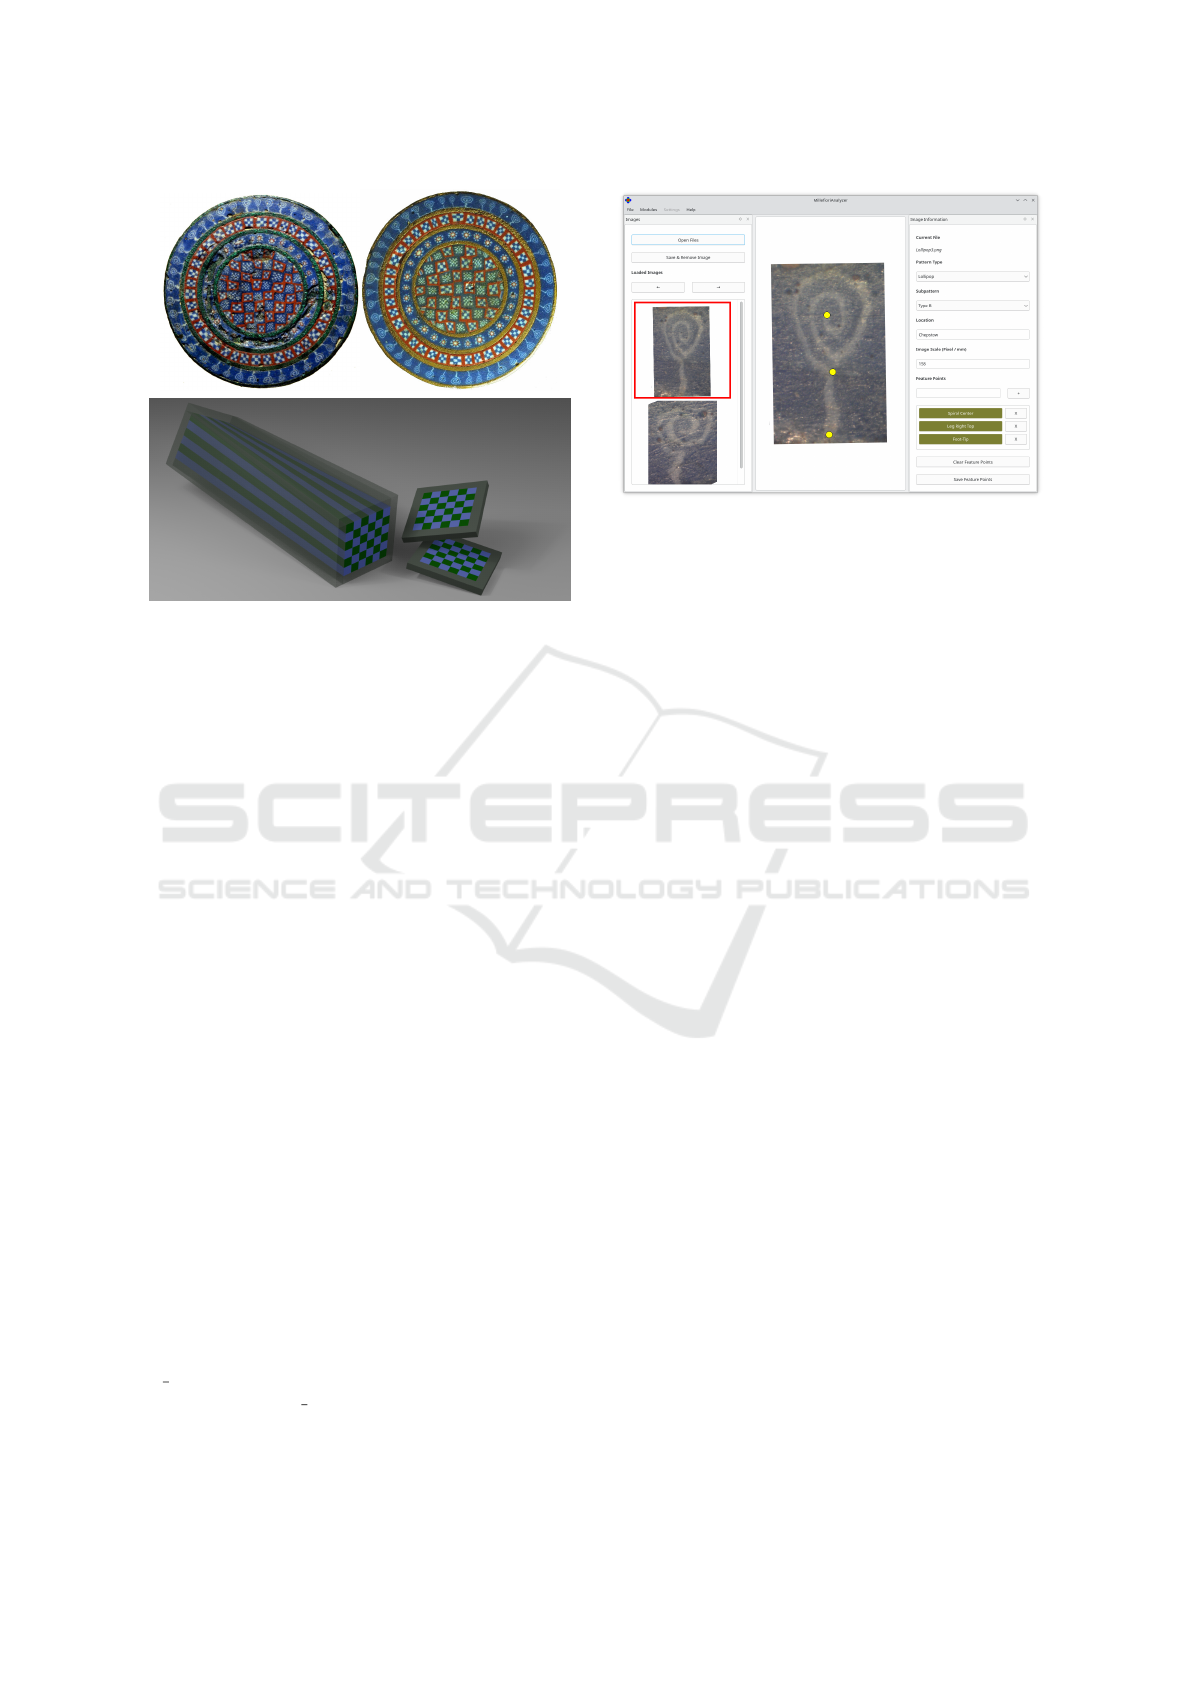
Figure 1: Top: Example of a copper alloy and enamel
stud inlaid with millefiori, from Chepstow, UK (left) and
Usk, UK (right). Left: © The Trustees of the British
Museum. Shared under a Creative Commons Attribution-
NonCommercial-ShareAlike 4.0 International (CC BY-NC-
SA 4.0) licence. Right: © Amgueddfa Cymru - Museum.
Bottom: Illustration of a cane (left) and florets (right).
• Perspectives for follow-up research steps.
The paper is structured to describe and discuss the
contributions in the order they are mentioned above.
2 BACKGROUND AND DATA
We chose two very similar studs (figure 1), from
Chepstow now in the British Museum and from Usk,
now in Caerleon Museum (belonging to Amgueddfa
Cymru – Museum) for our experiments. They are
virtually identical in size (51mm) and design (spi-
rals of pure white against a blue background (Bate-
son D1), squares of the three by three white and
blue chequerboard pattern within a red frame (Bate-
son A7), flowers with eight white petals and a white
centre surrounded by a red circle against a blue back-
ground (Bateson C13) with a central panel filled by
alternating three by three white and blue chequer-
board pattern within a red frame (A7), and five by
five white and blue chequerboard pattern within a
blue frame. The two studs were found ca. 25
km apart in the 19th century ((Brailsford, 1954),
56, pl. XXI, No. 6; (Henry, 1933) fig. 41.1;
cf. https://www.britishmuseum.org/collection/object/
H 1891-0327-12 or https://www.britishmuseum.org/
collection/object/H 1891-0327-9; (Lee, 1862), 56, pl.
XXVIII, No. 14). It seems likely that they were made
Figure 2: Image annotation module. Markers for three fea-
ture points have been added/edited in the image and meta-
data have been edited/provided in the side panel.
in the same workshop, but the question addressed here
is whether it is possible to strengthen that suggestion
by identifying florets from the same cane.
In our experiments we process images (photos) fo-
cusing on one floret each (see figures 2 and 4). Many
of these images are prone to high-frequency reflec-
tions (see e. g. figure 2) and artefacts resulting from
damage to the material of the florets (see figure 5).
3 RELATED WORKS
Previous applications of machine learning in archae-
ology have focused on highly standardized objects
such as coins (Deligio et al., 2023; Kiourt and Evan-
gelidis, 2021; Aslan et al., 2020; Schlag and Arand-
jelovic, 2017) while applications to more variable
forms of material culture such as pottery were per-
haps less successful (van Helden et al., 2022). Bick-
ler (Bickler, 2021) highlights how small archaeologi-
cal datasets with complicated contextual information
and poor surface images can be problematic, all issues
that affected this project.
The visual analytics part of this project was
motivated by exactly these issues. We are not
the first to approach archaeology problems in this
way. Employing visual analytics in archaeological
research has already been suggested over a decade
ago (Llobera, 2011). Knowledge discovery in rock
art research (Deufemia et al., 2014) is one example
where different petroglyphs have been presented in a
way similar to the cluster view in our system. Another
system exhibiting a clustering view as core part for
the analysis of pottery motifs has just recently been
presented by Li et al. (Li et al., 2024). The research
questions and thus the clustering and supporting inter-
action and visualization techniques in these applica-
IVAPP 2025 - 16th International Conference on Information Visualization Theory and Applications
808

Figure 3: MillefioriAnalyzer system architecture with edges
indicating data flow and calls between different modules.
tion areas are different to those in millefiori research
and thus in the MillefioriAnalyzer.
4 REQUIREMENTS
We conducted repeated preliminary interviews with
an archaeologist and her students to understand cur-
rent practices, identify deficiencies, and determine
our design requirements. The archaeologist is from a
university and is our collaborator. Based on the inter-
views we created two personas (Lidwell et al., 2010)
for typical users: an archaeology student and an ar-
chaeology professor. For these personas we derived
user stories which then were used to design and im-
plement the different features of the system.
Currently, matching and comparison of florets is
done by eyeballing. Due to the large amount of florets
belonging to one cane, this process is tedious and did
not lead to results with the desired quality. Thus, auto-
matic matching of similar florets or technical support
for comparison and grouping of florets is required.
In order to explore the grammar of motifs and
color combinations, the archaeologists currently man-
ually arrange the florets on slides in a presentation
software. In this process all additional (meta) infor-
mation is lost in the sense that it is not directly ac-
cessible from the slide. Thus iteratively refining the
arrangement using new information, e.g. from algo-
rithmic image analysis, becomes cumbersome if not
impossible. An interactive layout and annotation tool
retaining the connection to the original data and its
meta information is needed.
5 SYSTEM ARCHITECTURE
MillefioriAnalyzer is a research software. It serves
as a tool in archaeology research and as prototype for
developing new computational approaches for the ar-
chaeology research. Thus the system comprises mul-
tiple modules (see figure 3) exploring different ways
to analyze the millefiori images:
1. Image processing module (see section 6) , incor-
porating CV and ML techniques
2. Image annotation module (see figure 2), for man-
ually adding further meta data
3. Visual analytics module (see figure 7 and sec-
tion 7.1), for interactive overall analysis of floret
relationships
4. Image comparison module (see figure 8 and sec-
tion 7.2), for detailed analysis of potentially which
florets were originally neighbors in a cane.
This allows the archaeologists use and evaluate
multiple analysis approaches in one tool with a uni-
form interaction philosophy and look-and-feel across
all modules. Additionally, the integration of the dif-
ferent approaches allows to link them for an overview
first and details on demand approach (Shneiderman,
2003). A connection (see figure 3) between the visual
analytics module, for overview, and the image com-
parison module, for inspecting differences between
individual images, is an example for such a link.
The system has been implemented in
Python using PyQt as general GUI frame-
work, it is platform-independent, and it
is freely (GNU LGPL v3) available at
https://gitlab.rlp.net/ux-vis-public/millefiorianalyzer
and https://doi.org/10.5281/zenodo.14589448.
6 COMPUTER VISION AND
MACHINE LEARNING
The intention of the computer vision and machine
learning part of our interdisciplinary work is the de-
termination of millefiori images that were originally
produced from the same cane. This task requires us
not only to figure out the similarity between differ-
ent millefiori images but also to determine the correct
order of the millefiori images in their original canes.
Furthermore, the machine learning algorithms must
differentiate between different canes to assign mille-
fiori images correctly to the cane they belong to.
A major drawback of the data in our project is
the lack of training images as we could only gather
174 original millefiori images for our purposes. This
small amount of training examples can be a serious
disadvantage to learn significant patterns for image
similarity with machine learning methods and with
deep learning architectures in particular. Yet another
difficulty is the fact that, as mentioned above, images
of the millefiori slices frequently show damage (see
figure 5) and inclusions; there are also strong reflec-
tions that makes the identification of the originally
MillefioriAnalyzer: Machine Learning, Computer Vision and Visual Analytics for Provenance Research of Ancient Roman Artefacts
809
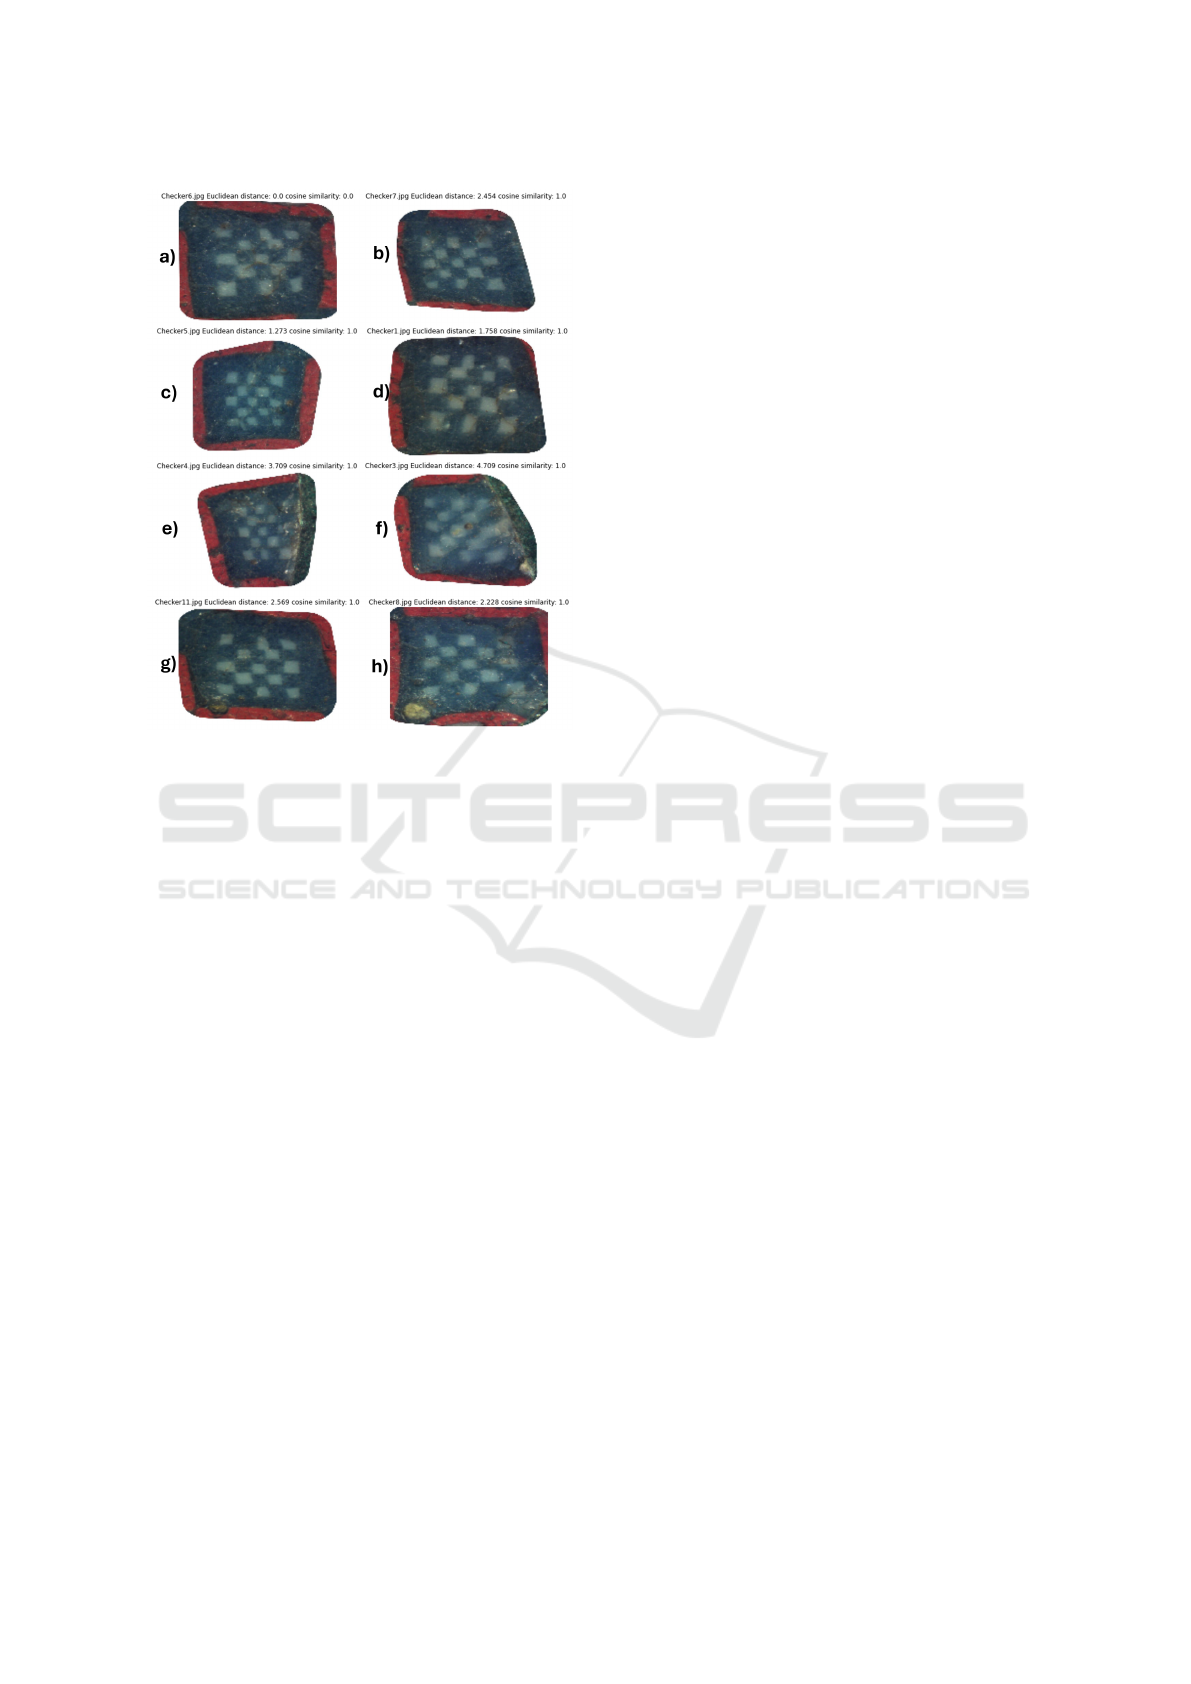
Figure 4: A reconstructed cane with an image sequence a)-
h) for a cosine similarity threshold of 0.9.
composed patterns even more difficult. Hence, the
fully automatic determination of image similarity in-
cluding the correct assignments to their original canes
is a great challenge for our project.
6.1 Automatic Image Processing
The challenging steps require the automatic calcu-
lation of the similarity of two images. There exist
several methods to compute image similarities like
SSIM (structural similar index measure) or pixel-
based RSME (root mean square error), normalized
cross correlation, keypoint-detectors like SIFT (scale-
invariant feature transform) or SURF (speeded up
robust features) features and others. Due to the
high variability in image appearance in combination
with the low number of images for ML approaches,
we started by using classical image processing tech-
niques. These were implemented in the image pro-
cessing module (figure 3).
Applying these techniques, we observed that
siginificant reflections lead to inappropriate SIFT-
keypoints and classical techniques like SSIM values
were not able to capture the image similarity be-
tween the millefiori patterns. Normalized cross corre-
lation produced the best results of all classical image
processing methods that we tested. It often showed
higher values for similar images. However, this kind
of template matching results are not sufficient to de-
termine image similarities as they do not take the dis-
placement of the most significant millefiori patterns
inside the cane into consideration.
6.2 Machine Learning Approaches
There are frequently used deep learning methods that
can learn latent feature spaces of the images. For
instance, (variational) autoencoders (Ballard, 1987;
Kingma, 2013) or Siamese networks (Koch et al.,
2015) learn to generate feature spaces, into which im-
ages can be transformed. Distances between images
embedded in feature space can then be calculated.
They represent image similarity measures. Siamese
networks with contrastive or triplet loss provide more
potential to learn image similarities than (variational)
autoencoders, since the millefiori images can be com-
bined to reach a larger amount of training examples.
In case of contrastive loss the training examples are
pairwise combined for training example generation.
Siamese networks that are steered by minimization of
triplet loss require a triplet training example consist-
ing of a positive, negative and an anchor image yield-
ing even more training examples. Hence, in contrast
to autoencoder and variational autoencoders Siamese
neural architectures offer the advantage to collect
much more training examples in order to achieve bet-
ter training results for image similarity.
We applied autoencoders, variational autoen-
coders and Siamese networks using both contrastive
loss and triplet loss. Since there exist no supervised
similarity values between the millefiori images, no
quantitative results can be provided to evaluate the
calculated image similarities. However, we observed
the most promising results for Siamese networks us-
ing triplet loss as they assign similar images to one
cane. For Siamese network training using triplet loss,
we divided the millefiori images into 5 categories
whereupon each category represents the same under-
lying millefiori pattern. We iterate through all mille-
fiori images and determine a new anchor image in
each iteration. Positive examples are taken from all
other images of the same category and negative exam-
ples are sampled from the other four categories. Thus,
each triplet example consist of an anchor image, a
positive and a negative image. We applied trans-
fer learning and used a ResNet50 (He et al., 2016)
as backbone with pre-trained weights, which were
trained for images of the ImageNet database.
As mentioned, the aim is find a sequence of flo-
rets which come from the same cane. For testing pur-
poses, we compute the embeddings of all images in
feature space. We start with the embedding vector of
IVAPP 2025 - 16th International Conference on Information Visualization Theory and Applications
810
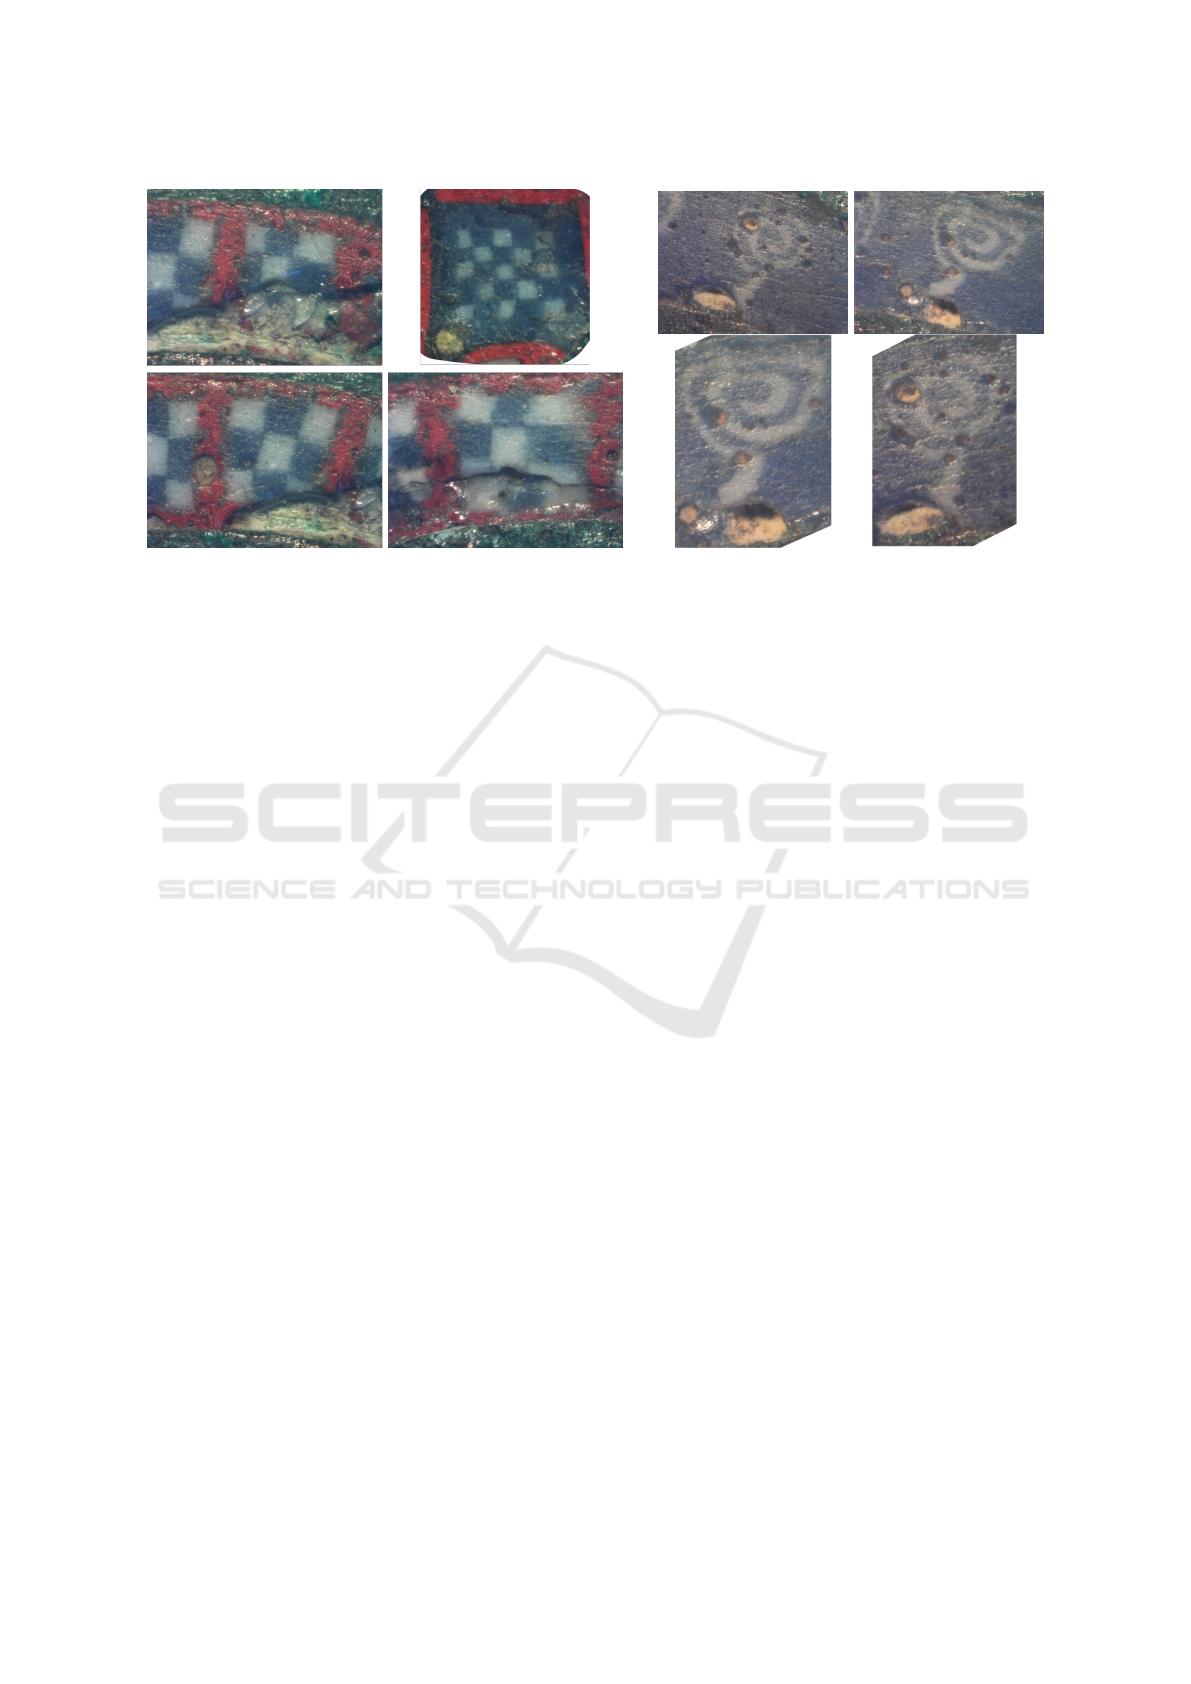
Figure 5: Challenging image quality due to damaged florets: missing parts, small holes, scratches or scraped top layer.
a randomly chosen millefiori image (actual predeces-
sor) and determine that image as successor in the cane
that has the highest cosine similarity between the two
embedding vectors. The successor then assumes the
role of the new predecessor, for that the new succes-
sor is determined in the same manner. If no successor
with a higher similarity as a pre-defined threshold is
found, we start with a new cane. However, we must
take into account, that the original cane may not be
complete due to missing intermediate millefiori im-
ages. The results (see figure 4) show that canes can
be reconstructed but depend highly on the used cosine
similarity threshold. If we choose too low thresholds,
then the reconstructed canes might include millefiori
images from another category. If too high thresholds
are used, then many millefiori images do not get a suc-
cessor and the reconstructed canes might be too small.
This shows that improvements to the techniques are
needed, but that an automatic separation of different
categories offloret designs is possible.
6.3 Manual Image Processing
The results obtained by the approaches discussed in
the previous subsection indicate that it might not be
feasible to process the original images directly and
automatically. This insight is supported by another
experiment where we applied a simple edge detection
filter to the gray scale version (figure 6 bottom left)
of one of the original images (figure 6 top left). The
result is shown in the top row of figure 6. Obviously
the relevant features, the checker pattern, are hidden
in a plethora of edges resulting from image noise (e.g.
reflections). Histogram equalization before edge de-
tection improves the visibility of the pattern a bit but
also strengthens the surrounding noise. Both of these
edge images are not useful.
An edge image that could be helpful for compar-
ing florets should look like the bottom right image in
figure 6. This image, however, has been obtained by
first manually tweaking a value for brightness thresh-
olding, three times erosion and dilation afterwards in
order to remove smaller artefacts, and finally applying
the edge detection to this manually improved image.
Such a manual process, however, would be too time
consuming when applied to many images and our at-
tempts to automate it have not been successful yet.
7 VISUAL ANALYTICS
Motivated by the challenges encountered in the exper-
iments using computer vision and machine learning
described in section 6, we decided to bring humans
back into the analysis loop. Using visual analytics ap-
proaches (Wong and Thomas, 2004) we can combine
human intuition and pattern recognition abilities with
the science of mathematical deduction, in our case
computer vision and ML, to derive connections be-
tween the images and insight from these connections.
7.1 Visual Analytics Module
The goal of this module is to integrate the original im-
age data, the results from the automatic analysis and a
human expert into the most effective analysis process
possible. To achieve this multiple different perspec-
tives on the images and the metadata are needed. Cur-
rently these perspectives are provided by three linked
visual analytics views as shown in figure 7. Based on
the analysis of the requirements (section 4) and on the
continued use of the system by the experts, additional
views will probably be added in the future. The three
MillefioriAnalyzer: Machine Learning, Computer Vision and Visual Analytics for Provenance Research of Ancient Roman Artefacts
811
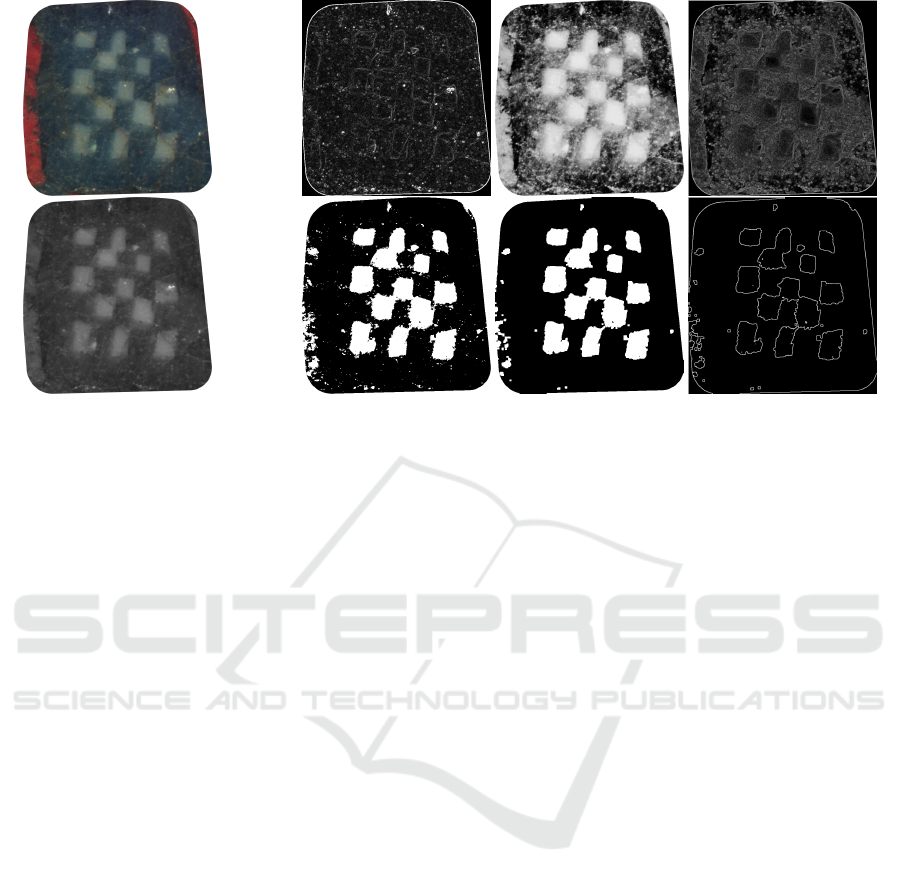
Figure 6: A checkerboard floret processed in different ways shows challenges resulting from the image quality. Left column:
color image, grayscale image (basis for all other steps). Right top row: Sobel edge detection, equalized, Sobel on equalized.
Right bottom row: thresholding with value 80, previous image eroded and dilated three times, Sobel on previous image.
existing views are described in the following. As all
views are linked, highlighting a floret in one of the
views will also highlight it in all other views.
7.1.1 Table View
The most basic, but also the most verbose of the cur-
rent views, is the table view (top left in figure 7).
It lists all loaded images row-wise. Each row con-
tains the filename of the floret image, the basic pattern
type present in the floret, a subpattern type, the loca-
tion where the object decorated by the floret has been
found, the number of feature points in the meta data,
and a thumbnail of the floret. The table can be sorted
by each of the columns. Each floret can be selected
and deselected (for highlighting). The corresponding
row will be highlighted accordingly.
7.1.2 Parallel Coordinates View
The parallel coordinates view (bottom left in figure 7)
presents axes for all properties (metadata) of the flo-
rets. The name and the thumbnail are not shown as
they do not belong to the metadata. As is characteris-
tic for parallel coordinates plots (Inselberg and Dims-
dale, 1990), each data point, in this case each floret, is
represented by a line connecting the locations on the
different axes which correspond to values of its prop-
erties. Lines and thus florets can be highlighted by
clicking on the lines or the line crossings at the axes.
The highlighting state of lines at the clicked location
will be toggled accordingly. Highlighted florets are
rendered as solid lines, others as dashed lines.
7.1.3 Image Clustering View
The image clustering view (right in figure 7) is in-
tended to support semantic layout and grouping of
florets for analysis purposes. Currently, the view sup-
ports to drag images from the repository row at the
bottom to the main canvas above it. In the main can-
vas, images can be dragged to move them to the de-
sired position. Related and thus closely positioned
images can be grouped by frames and groups can be
annotated by text. As this view, again, is linked to
all other views, images highlighted in other views are
highlighted by frames in both, the repository row and
the main canvas. Like all other views, the cluster view
can be used to highlight florets for interactive analy-
sis. This is possible in the canvas and the repository.
In the current version the clustering view only
supports manual layout and grouping. For the fu-
ture it is planned to provide initial layout using di-
mension reduction and projection techniques like t-
SNE (Van der Maaten and Hinton, 2008) as well as
initial grouping from the implicit clustering of such an
algorithm. Furthermore the clustering currently only
serves direct visualization and illustration purposes.
In the future the groupings will be made available as
floret properties to the other views. Thus, the groups
can be the basis for further interactive analysis.
7.1.4 Module Summary
The visual analytics module in its current form serves
as a replacement for the currently practiced manual
layout on presentation slides. The layout produced in
the clustering view, the annotation and the currently
IVAPP 2025 - 16th International Conference on Information Visualization Theory and Applications
812
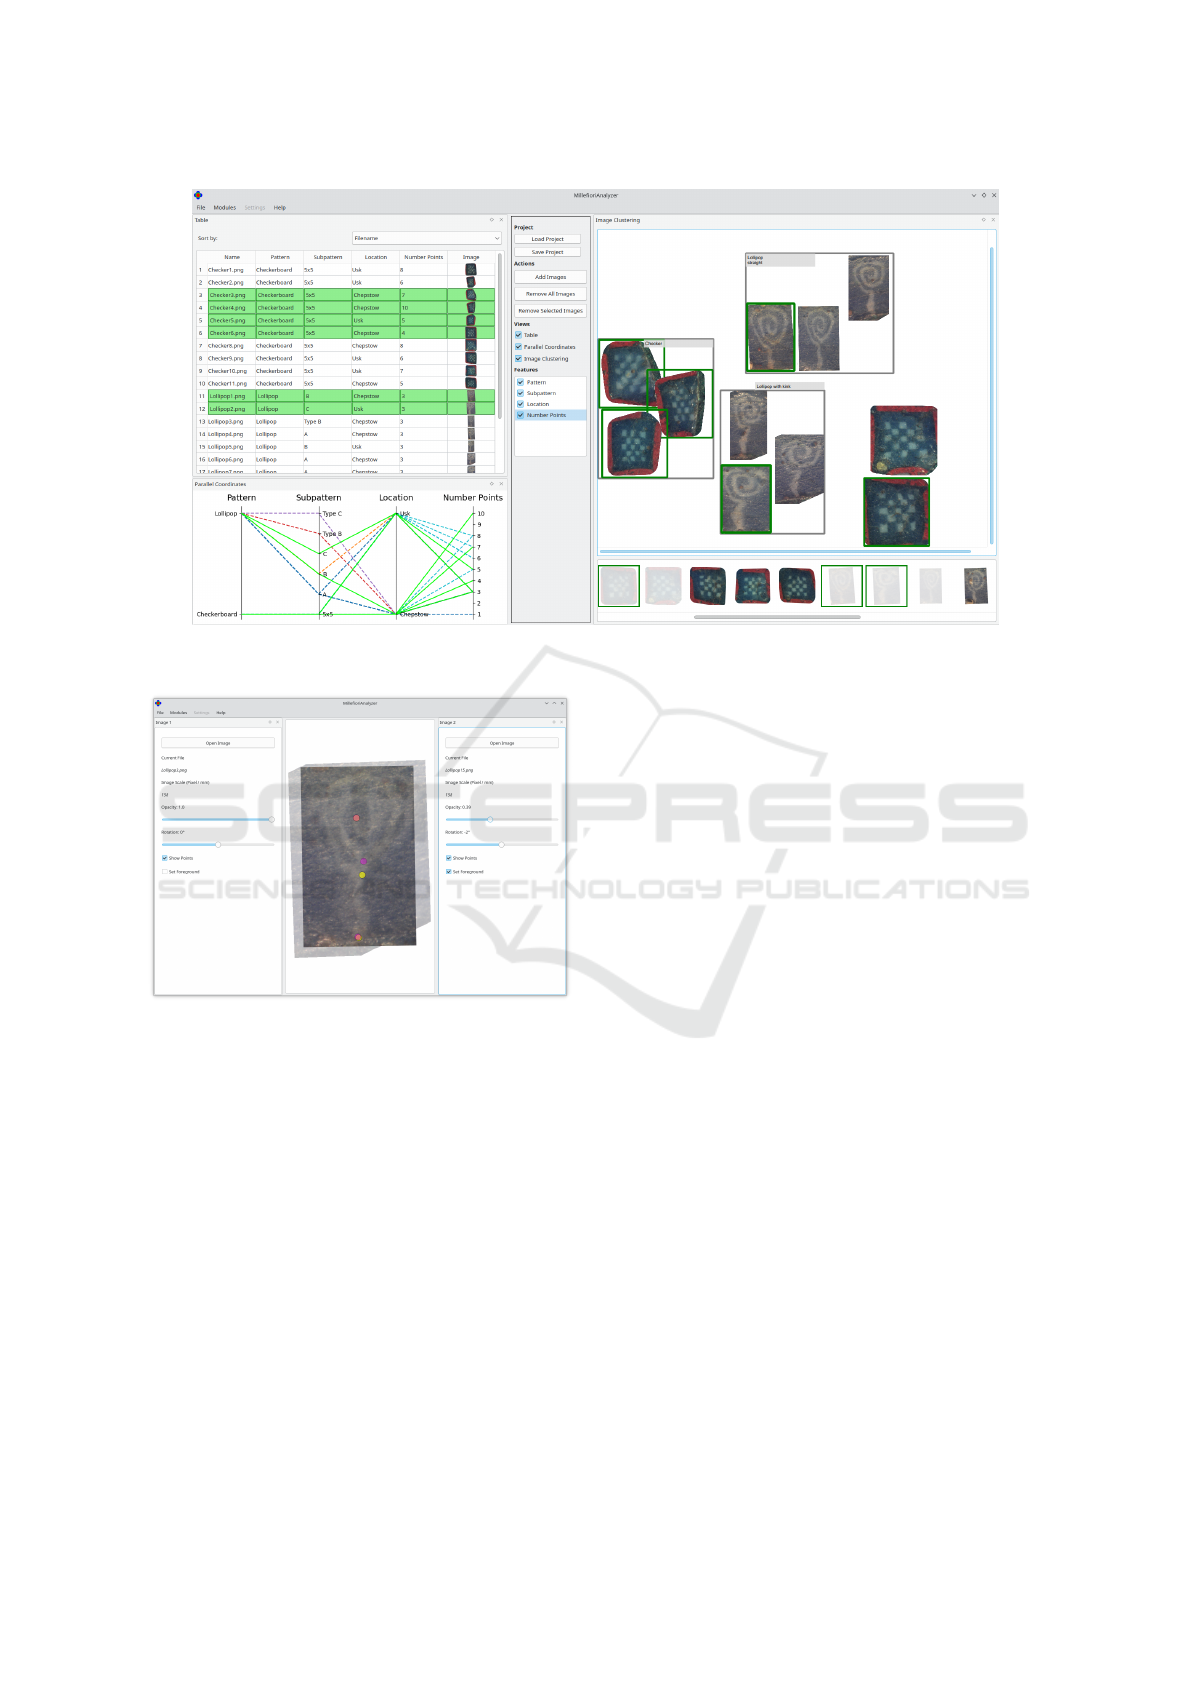
Figure 7: Visual analytics module. Three views are shown: table, parallel coordinates and image clustering. Several florets
are highlighted. Three semantic groups have been formed manually in the clustering view..
Figure 8: Image comparison module. Two images have
been superimposed for visual comparison.
highlighted florets can be saved in a project file and
thus the connections between the layout and the floret
meta data can be retained. Such connections are not
preserved in a suitable way for automatically reading
and pre-processing when using slide presentations.
Restoring the analysis status can serve presentation
purposes and allows to continue with the interactive
analysis whenever needed. While the employed vi-
sual analytics techniques might appear to quite basic,
they where chosen to specifically suit the application.
7.2 Image Comparison Module
The image comparison module enables users to visu-
ally check how similar two florets are and in which
feature they differ. For this purpose the module over-
lays the two images as shown in figure 8. The user can
decide which of the images will be shown on top. The
comparison is possible by toggling the visibility of the
top image. This works well because humans are good
in recognizing differences when images are shown in
immediate succession (Healey and Enns, 2012). To
study the differences in more detail, the module al-
lows users to adapt the opacity of the images in order
to see both images at the same time (see figure 8).
The images are initially aligned according to key
points stemming from the annotation module. The
user interface allows to rotate images around the main
keypoint to manually improve the alignment. The size
of the images is determined based on an image scale
attribute storing pixels/mm. The size is important be-
cause the patterns in consecutive florets of a cane are
expected to have very similar size. This module is in-
tegrated into the analysis workflow by allowing users
to choose two images in the image clustering view and
directly open the comparison.
8 CONCLUSION AND FUTURE
WORK
In this position paper we introduced the archaeologi-
cal application case of millefiori provenance research
and described the challenging nature of the image
data arising in this context. We developed the research
software MillefioriAnalzer which addresses the re-
quirements of the archaeologists by integrating and
combining the automatic and interactive approaches
MillefioriAnalyzer: Machine Learning, Computer Vision and Visual Analytics for Provenance Research of Ancient Roman Artefacts
813

explored in this paper. The current automatic ap-
proaches, which are intended to find floret images
stemming from the same millefiori cane, allow for
a distinction between the different floret types. The
precision of the ordering in the computed image se-
quence needs further improvement. The visual ana-
lytics part of MillefioriAnalyzer allows for interactive
layout of the florets for visual analysis and retaining
the connection to the meta data at the same time. The
connection to the meta data has been lost in the ar-
chaeologists previous layout workflow.
As described throughout this paper, the Millefio-
riAnalyzer software and the archaeological analysis
are not yet complete. As usual in new digital human-
ities projects (J
¨
anicke, 2016), more iterations of de-
velopment and evaluation are needed. We will incor-
porate manually segmented images into our machine
learning part. These segmentations, provided by ar-
chaeological experts, contain the most significant pat-
terns of the florets an thus will positively influence the
minimization of the Siamese cost function. As a re-
sult, the calculated image similarities will be less con-
founded by damage, reflections and other noisy pat-
terns. In the future we will also acquire photographs
of higher quality and of more millefiori artefacts.
ACKNOWLEDGMENTS
We would like to thank T. Wendler, P. Kretler, M.
Kretler and S. Brender for their implementation sup-
port, and S. Lambert-Gates and S. Sarkar for support-
ing us in preparing the photographs and tracings.
REFERENCES
Aslan, S., Vascon, S., and Pelillo, M. (2020). Two sides
of the same coin: Improved ancient coin classification
using graph transduction games. Pattern Recognition
Letters, 131:158–165.
Ballard, D. H. (1987). Modular learning in neural networks.
In Proceedings of the sixth National conference on Ar-
tificial intelligence-Volume 1, pages 279–284.
Bickler, S. H. (2021). Machine learning arrives in archaeol-
ogy. Advances in Archaeolog. Practice, 9(2):186–191.
Brailsford, J. W. (1954). Guide to the antiquities of Roman
Britain. The Trustees of the British Museum.
Deligio, C., Tolle, K., and Wigg-Wolf, D. (2023). Support-
ing the analysis of a large coin hoard with AI-based
methods. In CAA2023 Conf. Proc. CAA, Zenodo.
Deufemia, V., Indelli Pisano, V., Paolino, L., and
de Roberto, P. (2014). A visual analytics system for
supporting rock art knowledge discovery. In Com-
putational Science and Its Applications–ICCSA 2014:
14th Internat. Conf., pages 466–480. Springer.
Exner, K. (1939). Die provinzialr
¨
omischen Emailfibeln der
Rheinlande. Bericht der r
¨
omisch-germanischen Kom-
mission, pages 31–121.
He, K., Zhang, X., Ren, S., and Sun, J. (2016). Deep resid-
ual learning for image recognition. In Proceedings of
the IEEE CVPR, pages 770–778.
Healey, C. and Enns, J. (2012). Attention and visual mem-
ory in visualization and computer graphics. IEEE
TVCG, 18(7):1170–1188.
Henry, P. (1933).
´
Emailleurs d’occident. Prehistoire II,
pages 66–146.
Inselberg, A. and Dimsdale, B. (1990). Parallel coordinates:
a tool for visualizing multi-dimensional geometry. In
Proceedings of the first IEEE conference on visualiza-
tion: visualization90, pages 361–378. IEEE.
J
¨
anicke, S. (2016). Valuable research for visualization and
digital humanities: A balancing act. In Worksh. on Vis.
for the Digital Humanities, IEEE VIS, volume 7.
Kingma, D. P. (2013). Auto-encoding variational bayes.
arXiv preprint arXiv:1312.6114.
Kiourt, C. and Evangelidis, V. (2021). Ancoins:
Image-based automated identification of ancient coins
through transfer learning approaches. In International
Conf. on Pattern Recognition, pages 54–67. Springer.
Koch, G., Zemel, R., Salakhutdinov, R., et al. (2015).
Siamese neural networks for one-shot image recog-
nition. In ICML deep learning workshop, volume 2,
pages 1–30. Lille.
Lee, J. E. (1862). Isca Silurum. Or an illustrated catalogue
of the Museum of Antiquities at Caerleon. Longman,
Green, Longmans & Roberts.
Li, J., Lai, C., Zhang, H., and Yuan, X. (2024). PM-Vis: A
visual analytics system for tracing and analyzing the
evolution of pottery motifs. IEEE TVCG, 30(6):3022–
3034.
Lidwell, W., Holden, K., and Butler, J. (2010). Universal
principles of design, revised and updated: 125 ways to
enhance usability, influence perception, increase ap-
peal, make better design decisions, and teach through
design. Rockport Pub.
Llobera, M. (2011). Archaeological visualization: towards
an archaeological information science (aisc). Journal
of Archaeological Method and Theory, 18:193–223.
Schlag, I. and Arandjelovic, O. (2017). Ancient roman
coin recognition in the wild using deep learning based
recognition of artistically depicted face profiles. In
Proceedings of the IEEE international conference on
computer vision workshops, pages 2898–2906.
Shneiderman, B. (2003). The eyes have it: A task by data
type taxonomy for information visualizations. In The
craft of inform. vis., pages 364–371. Elsevier.
Van der Maaten, L. and Hinton, G. (2008). Visualizing data
using t-sne. J. of machine learning research, 9(11).
van Helden, D., Mirkes, E., Tyukin, I., and Allison, P.
(2022). The arch-i-scan project: Artificial intelligence
and 3d simulation for developing new approaches to
roman foodways. J. of Comp. Applic. in Archaeology.
Wong, P. C. and Thomas, J. (2004). Visual analytics. IEEE
Computer Graphics and Applications, 24(5):20–21.
IVAPP 2025 - 16th International Conference on Information Visualization Theory and Applications
814
