
Facility Layout Generation Using Hierarchical Reinforcement Learning
Shunsuke Furuta
1
, Hiroyuki Nakagawa
1,2
and Tatsuhiro Tsuchiya
1
1
Graduate School of Information Science and Technology, Osaka University, 1-5 Yamadaoka, Suita, Osaka, Japan
2
Graduate School of Environmental, Life, Natural Science and Technology, Okayama University,
3-1-1 Tsushima-naka, Kita-ku, Okayama, Japan
Keywords:
Machine Learning, Hierarchical Reinforcement Learning, Facility Layout Problem, Layout Design.
Abstract:
Facility Layout Problem (FLP), which is an optimization problem aimed at determining the optimal place-
ment of facilities within a specified site, faces limitations in existing methods that use genetic algorithms (GA)
and metaheuristic approaches. These methods require accurately specifying constraints for facility placement,
making them difficult to utilize effectively in environments with few skilled workers. In layout generation us-
ing reinforcement learning-based methods, the need to consider multiple requirements results in an expanded
search space, which poses a challenge. In this study, we implemented a system that adopts hierarchical rein-
forcement learning and evaluated its performance by applying it to existing benchmark problems. As a result,
we were able to confirm that the system could stably generate facility layouts that meet the given conditions
while addressing the issues found in previous methods.
1 INTRODUCTION
Facility Layout Problem (FLP) (Drira et al., 2007)
is an optimization problem that involves designing
appropriate arrangements of facilities within a site.
Since facility layout significantly impacts factors such
as operational costs, it is essential to consider require-
ments like interrelationships between facilities during
the design process. Furthermore, with the rapid pace
of technological advancements, the frequency of re-
designing existing factories has increased, necessitat-
ing quick layout design solutions. Given these cir-
cumstances and the NP-hard (Ripon et al., 2010) na-
ture of FLP’s computational complexity, metaheuris-
tic approaches, which provide approximate solutions,
have primarily been proposed. Additionally, rein-
forcement learning, a type of machine learning, has
recently been applied to this problem. However,
metaheuristic methods face challenges in requiring
exploration for each case, resulting in a limited range
of adaptability. Moreover, in the case of existing rein-
forcement learning methods, the learning process for
the complex FLP leads to an expanded search space,
making it difficult to generate facility layouts quickly.
In this study, we propose a facility layout sys-
tem for FLP using hierarchical reinforcement learn-
ing. Hierarchical reinforcement learning optimizes
policies—strategies for addressing the target prob-
lem—without requiring training data. Its hierarchical
structure allows for the reduction of the search space
and efficient optimization of policies. We evaluated
the performance of the proposed method by applying
it to benchmark problems for FLP.
The structure of this paper is as follows. Section 2
discusses the research background, including existing
studies on FLP, reinforcement learning, and hierarchi-
cal reinforcement learning. Section 3 introduces the
proposed facility layout generation system using hi-
erarchical reinforcement learning. Section 4 presents
the evaluation experiments and results related to the
proposed method. Section 5 provides a discussion of
the experimental results, and Section 6 concludes the
study and outlines future research directions.
2 BACKGROUND
2.1 Reinforcement Learning
Reinforcement learning (Kaelbling et al., 1996) is a
machine learning method that enables a system to
learn optimal actions for a given problem through
its own trial-and-error process, without requiring pre-
prepared training data. The learning process in rein-
forcement learning progresses through the interaction
of the following two components:
150
Furuta, S., Nakagawa, H. and Tsuchiya, T.
Facility Layout Generation Using Hierarchical Reinforcement Learning.
DOI: 10.5220/0013098200003890
In Proceedings of the 17th International Conference on Agents and Artificial Intelligence (ICAART 2025) - Volume 3, pages 150-157
ISBN: 978-989-758-737-5; ISSN: 2184-433X
Copyright © 2025 by Paper published under CC license (CC BY-NC-ND 4.0)
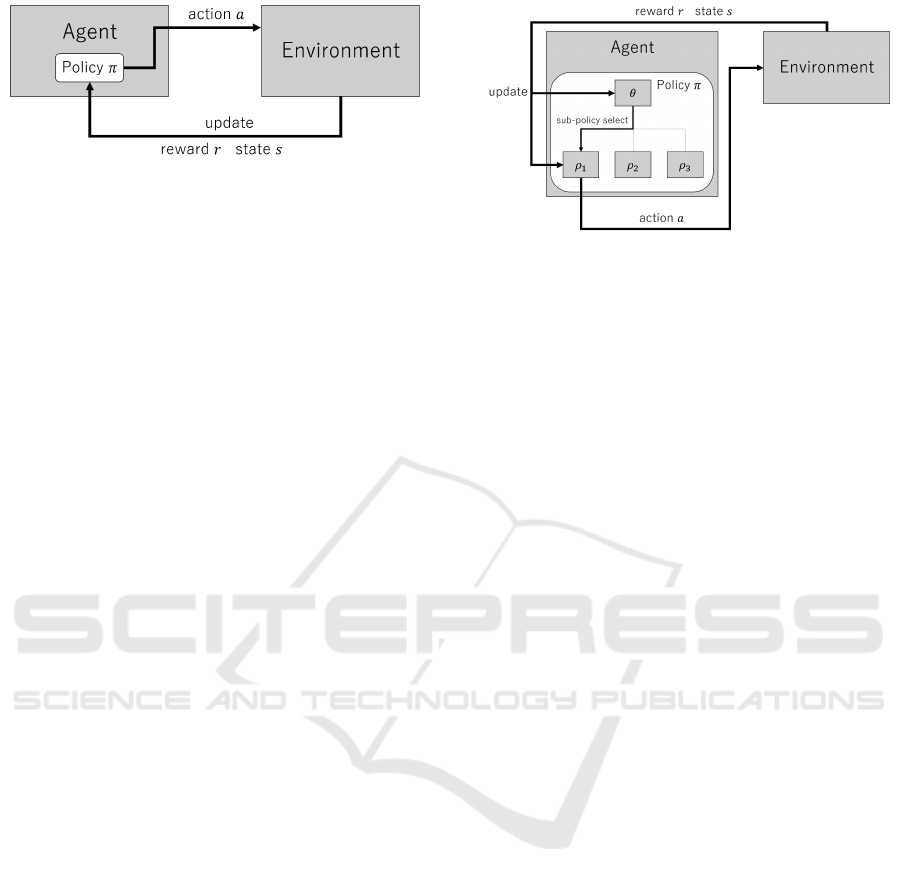
Figure 1: Overview of Reinforcement Learning.
• Agent: The learning system responsible for se-
lecting actions.
• Environment: The setting in which the agent per-
forms the target problem.
The agent selects actions based on a probability
distribution called a policy. The agent then performs
the selected action in the environment and receives a
reward from the environment. Subsequently, it tran-
sitions to a new state and updates its policy. By re-
peating this cycle, the agent learns to solve the target
problem. Specifically, the period until the agent takes
one action is called a step, and the entire process from
the beginning to the end of the problem is referred to
as an episode.
Examples of reinforcement learning algorithms
include Q-learning and Deep Q-Networks (DQN)
(Arulkumaran et al., 2017). These algorithms calcu-
late the value of actions, referred to as Q-values, and
learn to improve these values. Q-learning manages Q-
values in a table, while DQN uses neural networks to
handle high-dimensional tables of Q-values.
2.2 Hierarchical RL
Hierarchical reinforcement learning (Sutton et al.,
1999) is a type of reinforcement learning character-
ized by its hierarchical policy structure. This struc-
ture allows for more abstract learning in higher-level
policies, which is said to reduce the search space (Di-
etterich, 2000). In FLP, as the number of facilities to
be arranged increases, the unallocated space becomes
more limited, making it desirable to have allocation
strategies tailored to each situation. Therefore, this
study focuses on Meta Learning Shared Hierarchies
(MLSH), proposed by Frans et al. (Frans et al., 2017).
In MLSH, the policy structure consists of two lay-
ers: a master policy and multiple sub-policies. Each
sub-policy attempts sub-tasks derived from the target
problem, learning optimal actions suited to specific
situations. This allows the higher-level policy to only
learn how to select the appropriate sub-policy for a
given situation. Figure 2 illustrates master policy θ
selecting sub-policy ρ
1
.
Figure 2: Meta Learning Shared Hierarchies.
2.3 Existing Methods
As mentioned earlier, methods for solving FLP have
primarily focused on metaheuristic methods (Husoon
et al., 2022) such as Genetic Algorithms (GA) since
early studies like (Meller and Bozer, 1997) and (Kar
Yan Tam, 1992). These methods are characterized by
incorporating rules for appropriate facility layouts as
input when generating layouts. For instance, Paes et
al. proposed an FLP solution combining GA with
a divide-and-conquer approach (Paes et al., 2017),
optimizing facility layouts based on constraints such
as material handling costs. However, such methods
generate solutions only for predefined cases, making
them highly dependent on the skill of the user who
sets the parameters and limited in their ability to adapt
to layouts involving many facilities.
On the other hand, research utilizing reinforce-
ment learning for FLP is also being advanced. Xin-
han et al. (Di and Yu, 2021a) proposed a furni-
ture arrangement method using Deep Q-Networks
(DQN). This method enables the generation of lay-
outs that satisfy room constraints, but its learning
is limited to single pieces of furniture. They also
proposed a method utilizing multi-agent deep rein-
forcement learning (Di and Yu, 2021b), which al-
lows each agent to learn furniture arrangement strate-
gies that satisfy constraints from various perspectives,
enabling the creation of suitable 3D layouts from
a three-dimensional viewpoint. However, even this
method cannot handle the arrangement of multiple
pieces of furniture. Meanwhile, Ikeda et al. (Ikeda.
et al., 2023) proposed a method that combines rein-
forcement learning with the Analytic Hierarchy Pro-
cess (AHP) (Saaty, 1980) to generate layouts that con-
sider the relationships between facilities. AHP is a
decision-making approach that determines the most
effective option based on objective evaluation val-
ues calculated by weighting multiple evaluation crite-
ria that constitute the problem. This method allows
for the appropriate arrangement of multiple facility
groups. However, the success rate of layout gener-
Facility Layout Generation Using Hierarchical Reinforcement Learning
151
ation remains around 34%, indicating challenges in
achieving stability in the learning process for layout
generation.
3 FACILITY LAYOUT SYSTEM
Based on the issues identified in the existing studies
discussed in Section 2.3, we propose a facility layout
generation system utilizing MLSH. The objectives of
the generated layouts are as follows:
• Placing all facilities within the site without gaps.
• Placing related facilities as close as possible.
In this environment, site area, sizes of facilities,
and their relationships are predefined. (We call a pair
of the two different facilities a relationship and as-
sume that a relationship is assigned a non-negative
real number called the strength.) The agent of the pro-
posed method learns constraints and rules for optimal
facility placement through repeated operations of ac-
tually placing facilities. Subsequently, using learned
master policy and sub-policies, layouts can be gener-
ated for any given set of facilities.
3.1 Learning Environment
The environment of FLP and the facility placement
actions selected by the agent, are defined as follows:
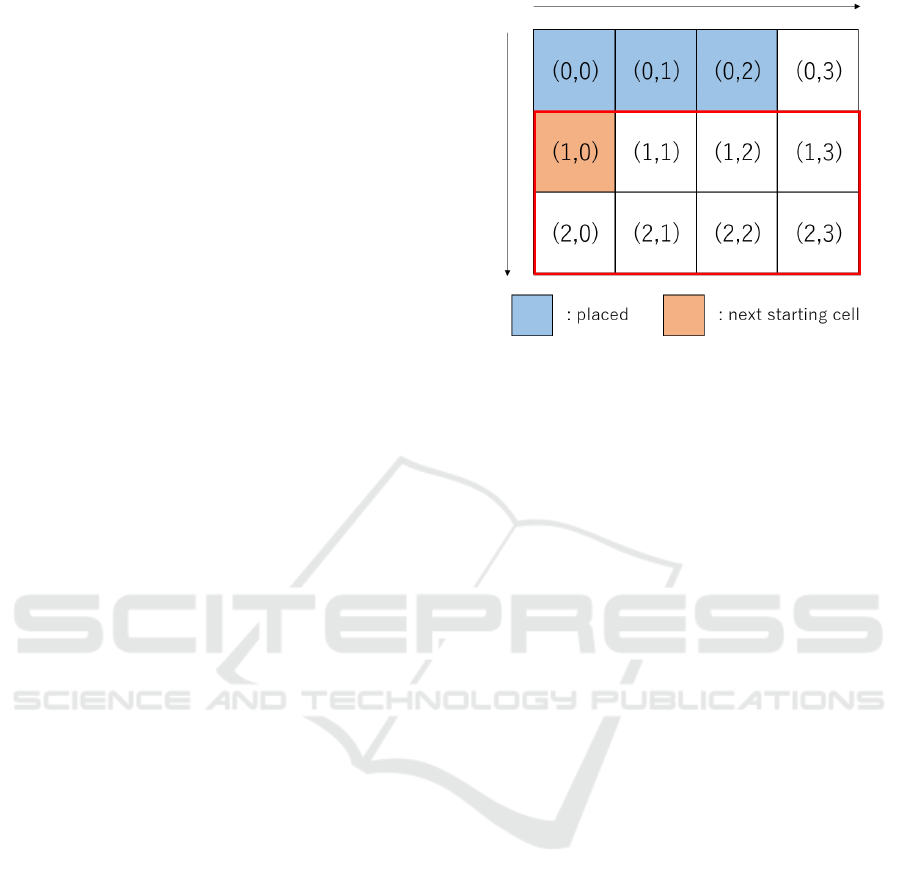
1. The site and facility are defined as cuboids repre-
sented by (width, length).
Figure 3 shows a site with (width, length) = (4, 3).
2. The site information is represented as a two-
dimensional array, with (0, 0) as the starting point,
where the right direction corresponds to width and
the downward direction corresponds to length,
both taken as positive directions.
3. Facilities are also considered when rotated by 90
degrees.
4. The relationship between facilities is expressed in
the form (relationship strength, facility 1, facility
2) and defined at the start of each episode.
5. The starting point for placing facilities is defined
randomly at the start of each episode. Subse-
quently, the next starting point will be the loca-
tion in the unplaced area where the largest possi-
ble rectangle can be formed.
In Figure 3, the starting point is (0, 0). In this case,
the largest rectangle in the unplaced area starts at
(1, 0), so the next starting point will be (1, 0).
6. facility placement actions (a) to (d) are defined as
follows:
Figure 3: Starting point.
(a) Select one facility with the maximum product
of width and length.
(b) Select one facility with the maximum evalua-
tion value of P
rel
.
P
rel
=
∑
r∈R
relation
r
∗ D
r
(1)
• R : Set of relationships with already allocated
facilities.
• relation
r
: Strength of relationship r.
• D
r
: Reciprocal of Manhattan distance be-
tween facilities in relationship r. The distance
is measured between the center coordinates of
two facilities.
(c) Select one facility with the maximum evalua-
tion value of P
both
.
P
both
=
∑
r∈R
(relation
r
∗ 0.5 + space ∗ 0.5) ∗ D
r
(2)
• R : Set of relationships with already allocated
facilities.
• relation
r
: Strength of relationship r.
• space : The product of width and length of the
unplaced facility under consideration.
• D
r
: Reciprocal of Manhattan distance be-
tween facilities in relationship r.
(d) Select one facility that can be placed randomly.
P
both
considers both the strength of relationships
and the width and length of the facilities. These
values are normalized to ensure that neither has
an overwhelming influence on the result.
7. The agent’s state consists of the following two el-
ements((a) and (b)):
(a) Site area satisfaction
ICAART 2025 - 17th International Conference on Agents and Artificial Intelligence
152

The ratio of the area occupied by allocated fa-
cilities to the total site area. If all facilities are
placed without gaps, this value is 1.
(b) Facility relationship satisfaction
The sum of T (equation (3)) for each already
allocated facility is compared to the total sum
of relationship strengths. If the Manhattan dis-
tance between all related facilities is 1, this
value is 1.
T =
∑
r∈A
relation
r
∗ D
r
(3)
• A : Set of relationships with other already allo-
cated facilities.
• relation
r
: Strength of relationship r.
• D
r
: Reciprocal of Manhattan distance between
facilities in relationship r.
8. The reward R
ac
for the agent’s actions is as fol-
lows. Here, the increase rate of the facility area
before and after placement is denoted as A, and
the increase rate from equation (3) is denoted as
B. Additionally, cases where a facility is placed is
denoted as true, and cases where a facility could
not be placed is denoted as f alse.
R
ac
=
(
0.5 ∗ A + 0.5 ∗ B if true
0 if f alse
(4)
The reward R
end
at the end of the episode is as
follows. In the following equation (5), let N
unp
represents the number of unallocated facilities.
R
end
= −1.0 ∗ N
unp
(5)
3.2 Learning Method
This section explains the learning process of MLSH
agent within a single episode. Figure 4 illustrates
this flow. First, facilities with random widths and
lengths are generated until the total area of the facility
group exceeds the site area, defining the facility group
for learning. At this point, the relationships between
facilities are also set. Second, after a certain num-
ber of steps, the master policy selects one sub-policy.
At other times, the previously selected sub-policy is
used. Third, the selected sub-policy performs one fa-
cility placement action based on its own probability
distribution. It then receives a reward based on the
placement results using equation (4) and updates the
selected master policy and sub-policy. The second
and third steps are repeated thereafter. Finally, when
no facilities can be placed, a reward is given accord-
ing to the number of unplaced facilities using equation
(5), and the episode ends.
3.3 Layout Generation Method
This section explains the method for generating facil-
ity layouts using the master policy and sub-policies
after training.
First, set the (width, length) of the site where the
facility layout generation will actually be performed.
Second, set the group of facilities to be placed and
the relationships between these facilities for the ac-
tual facility layout generation (these information must
be predefined). Third, after a certain number of steps,
master policy selects one sub-policy based on a proba-
bility distribution (if a certain number of steps has not
passed, the same sub-policy as the previous attempt
is selected). Fourth, selected sub-policy chooses one
facility placement action, and attempts to place one
facility on the site. The third and fourth steps are re-
peated thereafter.
At the end of each episode, there are two possi-
ble outcomes: either there are no unplaced facilities
remaining, or some remain unplaced. When no un-
placed facilities exist, it means that all facilities have
been successfully placed. In this case, facility layout
system outputs the generated facility layout.
4 EXPERIMENT
We conducted experiments to evaluate the effective-
ness of the proposed system utilizing MLSH. Using
the facility groups and relationships between facilities
from benchmark problem (Meller and Bozer, 1997).
4.1 Verification of Layout Generation
4.1.1 Experimental Overview
In this experiment, to evaluate the stability of the lay-
out generation of the proposed system, we measured
the ratio of generated facility layouts in which all fa-
cilities could be placed (referred to as success rate).
The number of steps for facility placement actions
during learning was set to a maximum of 180,000
times, the number of updates for master policy was
set to a maximum of 3,600 times, and the total number
of updates for sub-policies was set to a maximum of
2,160 times. Additionally, the number of steps for fa-
cility placement actions during layout generation was
set to 5,000 times. The success rate was calculated
for every 10,000 steps of facility placement actions
during learning, based on the results generated by the
learned agent, and the changes in its increase or de-
crease were also confirmed.
Facility Layout Generation Using Hierarchical Reinforcement Learning
153
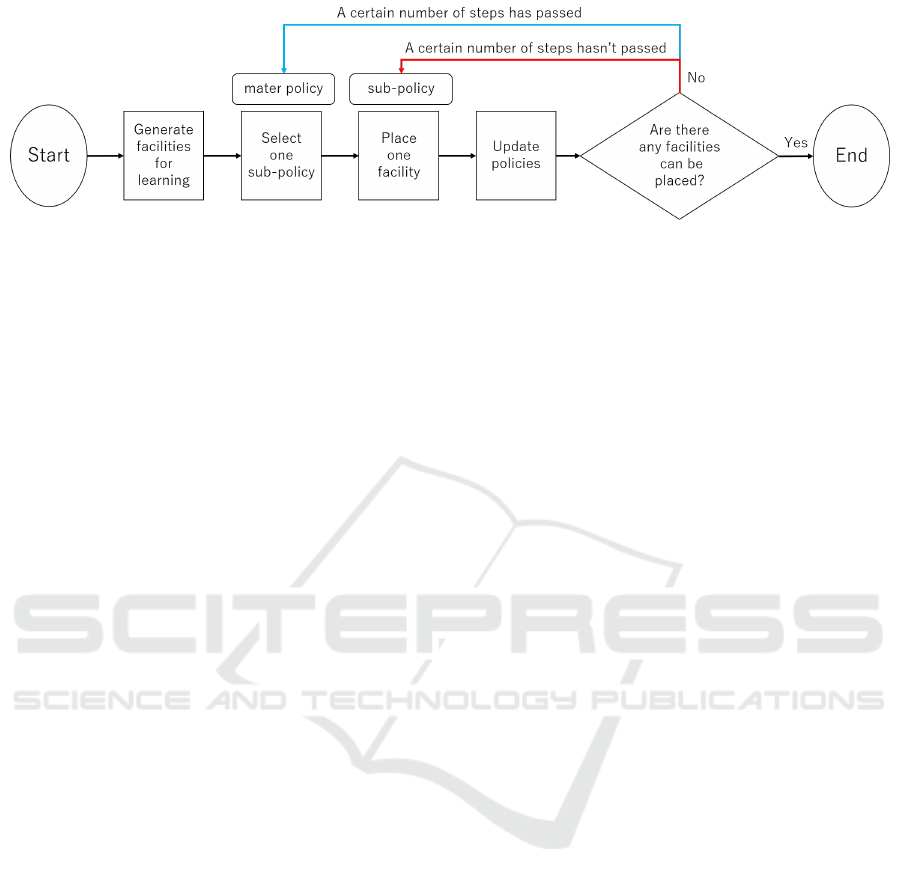
Figure 4: Flow of one learning episode.
4.1.2 Experimental Results
Figure 5 shows the graph results indicating the re-
lationship between the number of steps for facility
placement actions required for learning and the suc-
cess rate. In learning with a smaller number of steps,
the success rate was less than 50%, but from 80,000
learning steps onwards, a stable result was obtained
with the success rate converging to 80% to 90%. This
confirms that learning with MLSH meets the objec-
tive of ”Placing all facilities within the site without
gaps.”
As an example, a facility layout generated using
master policy and sub-policies trained with 180,000
steps is shown in Figure 6.
4.2 Evaluation of Generated Layout
4.2.1 Experimental Overview
This experiment confirmed whether the placement
considered the relationships between facilities while
being able to place all facilities. The evaluation crite-
ria used DI analysis, a facility layout analysis method.
DI analysis evaluates the facilities placed in the lay-
out based on the product of the distance between fa-
cilities (Distance) and the intensity of the relationship
between facilities (Intensity). Since this study aims
for shorter distances between facilities with stronger
relationships, the product of Distance and Intensity
should be small. Therefore, we calculated the follow-
ing P
DI
, and determined that the smaller this value,
the higher the layout evaluation.
P
DI
=
∑
x∈I
relation
x
∗ L
1
x
(6)
• I : Set of all relationships
• relation
x
: Strength of relationship x
• L
1
x
: Manhattan distance between facilities in re-
lationship x
Similar to experiment in Section 4.1, the number
of steps for facility placement actions during learning
was set to a maximum of 180,000 times, the number
of updates for master policy to a maximum of 3,600
times, and the total number of updates for sub-policies
to a maximum of 2,160 times. Additionally, the num-
ber of steps for facility placement actions during lay-
out generation was set to 5,000 times. The average
value of P
DI
was calculated for every 10,000 steps
of facility placement actions during learning, based
on the results generated by the learned agent, and its
changes were also monitored.
Furthermore, the calculated average value of P
DI
was compared with the execution results of the ex-
isting method by Ikeda et al. (Ikeda. et al., 2023).
This existing method selects facilities based on the
objective evaluation values of each facility, calculated
from the weights called ”combination rate”, which
are derived using AHP with Q-learning and DQN al-
gorithms for facility area and facility relationships.
The higher ”combination rate”, the more emphasis is
placed on the relationships between facilities. For ex-
ample, ”combination rate” of 0.9 indicates ”relation-
ship between facilities : facility area = 9:1”.
4.2.2 Experimental Results
Figure 7 shows a graph illustrating the relationship
between the number of action steps required for facil-
ity placement during learning and the average value
of P
DI
. Although there is some variation with the in-
crease in the number of steps required for learning,
a decreasing trend is observed. This confirms that
the proposed method can learn to place facilities with
significant relationships as close together as possible
across the entire facility layout.
Meanwhile, Table 1 compares the average value
of P
DI
of proposed method after 180,000 learning
steps with those of existing methods by Ikeda et al.
(Q-learning+AHP and DQN+AHP). In the table, R
s
refers to ”combination rate” mentioned in Section
4.2.1.
From Table 1, it was confirmed that the proposed
method could achieve learning and layout generation
that consider the relationships between facilities bet-
ICAART 2025 - 17th International Conference on Agents and Artificial Intelligence
154
Figure 5: The success rate of facility layout generation.
Figure 6: Example of facility layout by proposed method
trained with 180,000 steps. The numbers indicate the fa-
cility numbers, and facilities with the same color represent
those with particularly strong relationship.
Table 1: comparison of the average of P
DI
.
method P
DI
DQN + AHP (R
s
: 0.9) 139,525.0
DQN + AHP (R
s
: 0.5) 146,259.5
Q-Learning + AHP (R
s
: 0.9) 175,487.5
Ours (MLSH) 144,824.9
ter than Q-learning, as the average value of P
DI
is
lower than that of the combination of Q-learning +
AHP, even when ”combination rate” that most empha-
sizes the relationships between facilities is 0.9. On the
other hand, in comparison with DQN + AHP, when
the synthetic ratio is 0.9, the proposed method had
a higher average P
DI
value, resulting in a lower lay-
out evaluation. However, when ”combination rate” is
lower than 0.9, i.e., when more emphasis is placed on
the sufficiency of the site area (as shown in Table 1
for ”combination rate” of 0.5), the evaluation based
on P
DI
is higher than that of DQN, indicating that the
proposed method does not necessarily perform worse
than DQN + AHP.
5 DISCUSSION
In experiment in Section 4.1, we verified whether fa-
cility layouts could be stably generated, with facilities
being placed tightly on the site, using MLSH. As a re-
sult, by using MLSH agent trained with 80,000 steps,
we achieved a success rate of around 80%, and it was
confirmed that by increasing the number of learning
steps, layouts could be generated with a success rate
of 80% to 90%. This outcome can be attributed to
the imposition of rewards indicated by equation (5).
According to equation (4), during each facility place-
ment attempt, a negative reward is not incurred even
if facility placement cannot be achieved. However,
when all facilities cannot be placed by the end of an
episode, a negative reward is given, which encourages
learning that prioritizes facility placements enabling
all facilities to maximize return.
In experiment in Section 4.2, we compared and
evaluated the proposed method and existing method
using DI analysis. As a result, we were able to achieve
a facility layout generation with higher evaluation
than Q-learning+AHP, but there were cases where the
evaluation was lower than DQN+AHP. The method
by Ikeda et al., which was used for comparison, ob-
jectively evaluates each facility during layout gener-
ation based on ”combination rate” of AHP for the
facility area and the relationships between facilities,
and selects facilities based on these evaluation values.
Therefore, unlike the proposed method, the existing
method takes into account the relationships between
all facilities, which is believed to be the reason for the
inferior results compared to DQN+AHP. On the other
hand, the relationship between the number of learning
steps in the proposed method and the variance value
of P
DI
is as shown in Figure 8. From this graph, it can
Facility Layout Generation Using Hierarchical Reinforcement Learning
155
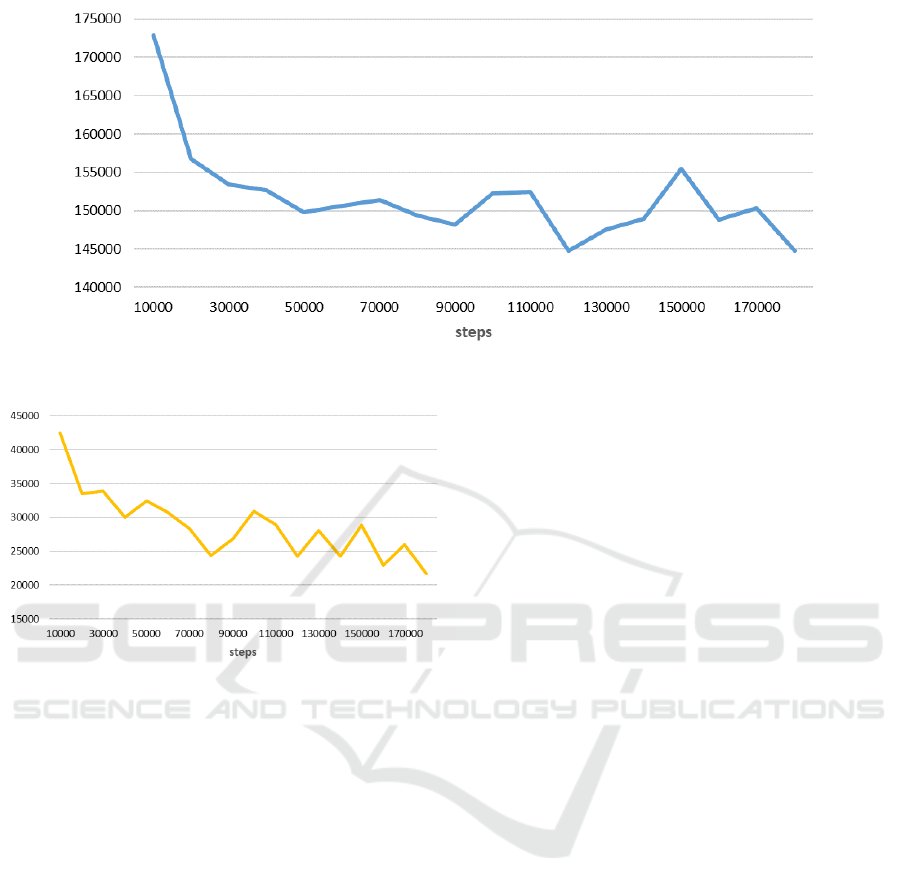
Figure 7: The average of P
DI
for the facility layouts.
Figure 8: The variance of P
DI
for the facility layouts.
be suggested that the proposed method is capable of
learning to consider the relationships between facili-
ties, as indicated by the decreasing trend in variance
corresponding to the number of learning steps.
6 CONCLUSION AND FUTURE
WORKS
6.1 Conclusion
This study focuses on Facility Layout Problem (FLP),
which involves devising the optimal arrangement of
facilities on a site. We propose a facility layout gen-
eration system using MLSH to improve the efficiency
of generating layouts that take multiple requirements
into account while being independent of user skill by
enabling the system itself to learn the constraints and
rules for appropriate facility placement.
Applying the proposed system to a benchmark
problem, we confirmed that it could generate layouts
where all facilities are placed without gaps within the
specified site. Furthermore, we evaluated whether the
system could consistently generate layouts with all
facilities placed on the site, using a metric referred
to as the success rate. Additionally, we examined
whether the generated layouts considered the rela-
tionships between facilities based on DI analysis and
compared the results with those of existing reinforce-
ment learning-based method.
From the perspective of success rate, the proposed
method demonstrated stable performance, achieving
the success rate of 80% to 90% in the latter stages
of training, indicating that it could consistently gen-
erate layouts with all facilities placed without gaps.
However, in terms of layout evaluation using DI anal-
ysis, the proposed method occasionally performed
worse compared to existing methods that consider
facility relationships during layout generation using
AHP. Overall, considering the very high probability
of generating layouts with all facilities placed and the
system’s increasing ability to account for facility re-
lationships as training progresses, the usefulness of
MLSH for FLP has been demonstrated.
6.2 Future Work
Looking ahead, based on the evaluation experiments
and issues with MLSH, we aim to address the fol-
lowing feature additions and specification changes in
future research.
6.2.1 Environmental Settings
From the evaluation experiments of the generated lay-
outs using DI analysis conducted in Section 4.2, it was
found that the proposed method sufficiently learned to
meet the site’s area requirements, but the learning effi-
ciency concerning the relationships between facilities
was not as high as that for the area requirements. In
the current environment, as shown in equation (4), the
ICAART 2025 - 17th International Conference on Agents and Artificial Intelligence
156

reward related to the relationships between facilities is
only partially calculated during facility placement ac-
tions. This suggests that the relationships between fa-
cilities do not significantly contribute to the reinforce-
ment learning objective of maximizing profit. There-
fore, since the reward in equation (5) improved the
success rate of layout generation, we plan to examine
whether applying a similar reward to the relationships
between facilities can further reduce the DI analysis
evaluation values. For example, a method that im-
poses negative rewards on the number of relationships
between facilities with distances exceeding a certain
value at the end of an episode, thereby encouraging
the placement of facilities considering their relation-
ships to ensure that the distances between facilities
fall within a certain range, can be mentioned.
6.2.2 Improvement of MLSH
Not limited to MLSH, hierarchical reinforcement
learning, which divides the target problem into multi-
ple sub-tasks for learning, is said to contribute to re-
ducing the exploration space during learning due to its
structure of having multiple sub-policies. However,
it has been pointed out that methods that automati-
cally acquire such sub-policies may result in all sub-
policies converging to the same policy, thereby losing
diversity among them. In response to this, Huo et al.
proposed a method that updates MLSH sub-policies
to differentiate them from each other using similar-
ity measures of probability distributions, such as KL
divergence, thereby effectively utilizing the multi-
ple sub-policies (Huo et al., 2023). Experiments on
various tasks have shown that this method increases
the rewards compared to conventional MLSH. In this
study, we aim to introduce such methods that lever-
age the structural advantages of MLSH to optimize
the learning of facility relationships.
REFERENCES
Arulkumaran, K., Deisenroth, M. P., Brundage, M., and
Bharath, A. A. (2017). Deep Reinforcement Learn-
ing: A Brief Survey. IEEE Signal Processing Maga-
zine, 34(6):26–38.
Di, X. and Yu, P. (2021a). Deep Reinforcement Learning
for Producing Furniture Layout in Indoor Scenes.
Di, X. and Yu, P. (2021b). Multi-Agent Reinforcement
Learning of 3D Furniture Layout Simulation in Indoor
Graphics Scenes. CoRR, abs/2102.09137.
Dietterich, T. G. (2000). Hierarchical Reinforcement Learn-
ing with the MAXQ Value Function Decomposition.
Journal of Artificial Intelligence Research, 13:227–
303.
Drira, A., Pierreval, H., and Hajri-Gabouj, S. (2007). Fa-
cility layout problems: A survey. Annual Reviews in
Control, 31(2):255–267.
Frans, K., Ho, J., Chen, X., Abbeel, P., and Schulman, J.
(2017). Meta Learning Shared Hierarchies.
Huo, L., Wang, Z., Xu, M., and Song, Y. (2023). A Task-
Agnostic Regularizer for Diverse Subpolicy Discov-
ery in Hierarchical Reinforcement Learning. IEEE
Transactions on Systems, Man, and Cybernetics: Sys-
tems, 53(3):1932–1944.
Husoon, O. O., Kadhim, D. A., and Raheem, K. M. H.
(2022). Reconfigration of manufacturing facility lay-
out using meta heuristic particle swarm optimization.
AIP Conference Proceedings, 2386(1):050013.
Ikeda., H., Nakagawa., H., and Tsuchiya., T. (2023). Au-
tomatic Facility Layout Design System Using Deep
Reinforcement Learning. In Proceedings of the 15th
International Conference on Agents and Artificial In-
telligence - Volume 2: ICAART, pages 221–230. IN-
STICC, SciTePress.
Kaelbling, L. P., Littman, M. L., and Moore, A. W. (1996).
Reinforcement learning: a survey. J. Artif. Int. Res.,
4(1):237–285.
Kar Yan Tam (1992). Genetic algorithms, function opti-
mization, and facility layout design. European Jour-
nal of Operational Research, 63(2):322–346. Strate-
gic Planning of Facilities.
Meller, R. D. and Bozer, Y. A. (1997). Alternative
Approaches to Solve the Multi-Floor Facility Lay-
out Problem. Journal of Manufacturing Systems,
16(6):457–458.
Paes, F. G., Pessoa, A. A., and Vidal, T. (2017). A hy-
brid genetic algorithm with decomposition phases for
the Unequal Area Facility Layout Problem. European
Journal of Operational Research, 256(3):742–756.
Ripon, K. S. N., Glette, K., Høvin, M., and Torresen, J.
(2010). A Genetic Algorithm to Find Pareto-optimal
Solutions for the Dynamic Facility Layout Problem
with Multiple Objectives. In Wong, K. W., Mendis, B.
S. U., and Bouzerdoum, A., editors, Neural Informa-
tion Processing. Theory and Algorithms, pages 642–
651, Berlin, Heidelberg. Springer Berlin Heidelberg.
Saaty, T. L. (1980). The analytic hierarchy process (AHP).
The Journal of the Operational Research Society,
41(11):1073–1076.
Sutton, R. S., Precup, D., and Singh, S. (1999). Between
MDPs and semi-MDPs: A framework for temporal
abstraction in reinforcement learning. Artificial Intel-
ligence, 112(1):181–211.
Facility Layout Generation Using Hierarchical Reinforcement Learning
157
