
Analyses of Land Use Land Cover Change Detection of the Ugam
Chatkal National Park, Uzbekistan
Mukhiddin Juliev
1,2 a
, Nozimjon Teshaev
3b
, Gulnora Djalilova
4c
, Inobat Agzamova
5d
,
Giyosiddin Gulyamov
5e
and Jasmina Gerts
3f
1
Institute of Fundamental and Applied Research, “TIIAME” National Research University,
39, Kori Nioziy, Tashkent, 100000, Uzbekistan
2
Turin Polytechnic University in Tashkent, 17, Little Ring Road, Tashkent, 100095, Uzbekistan
3
“Tashkent Institute of Irrigation and Agricultural Mechanization Engineers” National Research University,
39, Kori Nioziy, Tashkent, 100000, Uzbekistan
4
National University of Uzbekistan named after Mirzo Ulugbek, 4 Str. University, Tashkent, 100174, Uzbekistan
5
Tashkent State Technical University, 2, University, Tashkent, 100095, Uzbekistan
Keywords: Land Use Land Cover, Ugam-Chatkal, Climate Change.
Abstract: The Ugam-Chatkal National Park was established in 1992 as a result of reorganization of Chatkol Biosphere
Reserve. Located in the southern Tien Shan Mountain range, in the Chatkal mountain system, it is the largest
natural reserve in Uzbekistan. The national park was created to protect unique ecosystems and endangered
animals. In this study, the national park land cover change during the years 2000-2020 and the change map
of precipitation in the corresponding years were created based on the satellite images. Land cover change was
calculated using the Maximum likelihood classification (MLC) supervised classification method. From the
change of the land cover, it can be determined that the amount of vegetation has increased in the last two
decades, and the snow cover has decreased on the contrary. It was also found that open land cover increased
in the south.
1 INTRODUCTION
According to (Costanza et al., 2014), natural
ecosystems offer a range of goods and services that
are necessary for human survival. Human activity,
particularly industry and urbanisation, has an impact
on natural ecosystems. As such, there is risk to
ecosystem services, which are benefits that humans
derive from ecosystems (Kremen, 2005). The history
of scientific study on ecosystem services dates back
to the late 1970s, but the first systematic assessment
of the world's ecosystem services was carried out in
1997 (Gomes et al., 2021). Many scientists are
working to build and promote a set of ecosystem
a
https://orcid.org/0000-0002-8582-0352
b
https://orcid.org/0009-0007-2798-2816
c
https://orcid.org/0000-0003-1003-4434
d
https://orcid.org/0000-0002-3102-4289
e
https://orcid.org/0000-0003-3365-1902
f
https://orcid.org/0009-0001-6222-1111
service categories gradually (Czúcz et al., 2018;
Gafurova et al., 2021).
The increase and decrease in the area of a
particular land use or land cover is called Land use
land cover changes (Tian et al., 2014). The term
“land-use” was used by people for the proper use of
land covers for self-sufficiency. LULC makes a
significant contribution to the study of the process of
urbanization, to the monitoring and understanding of
changes in the urban area, its intensity, direction and
impact. It provides valuable information for land use
management and sustainable urban planning (Kontgis
et al., 2014). GIS and Remote Sensing technologies
are widely used to assess the dynamics of spatial and
Juliev, M., Teshaev, N., Djalilova, G., Agzamova, I., Gulyamov, G. and Gerts, J.
Analyses of Land Use Land Cover Change Detection of the Ugam Chatkal National Park, Uzbekistan.
DOI: 10.5220/0014268400004738
Paper published under CC license (CC BY-NC-ND 4.0)
In Proceedings of the 4th International Conference on Research of Agricultural and Food Technologies (I-CRAFT 2024), pages 325-332
ISBN: 978-989-758-773-3; ISSN: 3051-7710
Proceedings Copyright © 2025 by SCITEPRESS – Science and Technology Publications, Lda.
325
temporal changes of global LULC on a global scale
(Lambin & Geist, 2008).
Using Landsat and MODIS satellite imagery, Yin
et al. mapped forest land cover changes in Central
Asia for 2009–2011 (Didan, 2015). The dynamics of
expansion of irrigated cropland in the Kashkadarya
region of the Republic of Uzbekistan in 1972-2000
was calculated by Edlinger et al. Tashkent region has
very rich natural resources, in particular, the Ugam-
Chatkal National Park is the largest natural protection
area in Uzbekistan (Yin et al., 2017). The presence of
more than 2,200 plant species in the park and the
presence of large forest areas made the national park
a UNESCO World Heritage Site in 2016 (Oymatov et
al., 2023). Chukwudi et al. (Kumar et al., 2022;
MohanRajan et al., 2020; Harris et al., 2020) studied
the degree of variability and trends in annual rainfall
in southwest Nigeria, taking into account the specific
nature of rainfall and these data have implications for
predictive modeling and long-term climate
change/variability adaptation programs in the basin.
In this research, we mapped the National Park's land
use change dynamics, vegetation cover change
dynamics, and decadal precipitation change maps
using spatial data analysis. The objective of the article
is to study the impact of global climate change on the
ecological condition of the national park.
2 MATERIALS AND METHODS
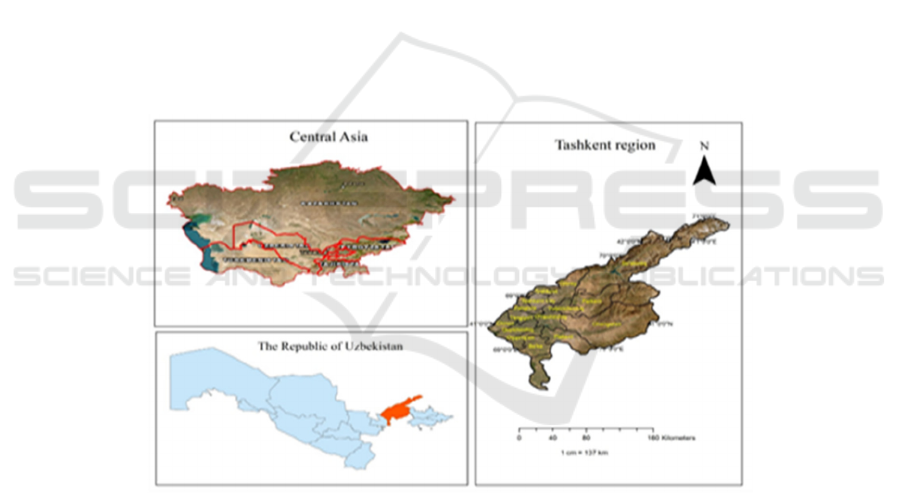
2.1 Study Area
Tashkent region borders the Republic of Kazakhstan
to the north and northwest, the Kyrgyz Republic to
the northeast, Namangan Region to the east, the
Republic of Tajikistan to the south, and Syrdarya
Region to the southwest. The area (without the area
of Tashkent city) is 15.3 thousand km². The
population (without the population of Tashkent city)
is more than 2.931 million people (2022) (Oymatov
et al., 2023). The climate is a typically continental
climate with mild wet winters and hot dry summers.
Chatkal National Park, with mountains and forests, is
located within Tashkent Region.
Figure 1: Location of Tashkent region.
2.2 Data Processing
Landsat-5 TM and Landsat 8 (OLI & TIRS) satellites
were selected using the Earth explorer platform to
download satellite images. Satellite images for the
time period 2000–2020 were selected in June,
allowing for up to 10 percent cloud cover (path 142,
row 41;). Landsat satellite imagery has a resolution
of 30x30 m with eight reflectance bands of 30 m, one
panchromatic band of 15 m, and two thermal bands
of 100 m. The downloaded raw data were processed
in ArcGIS 10.7.1 without atmospheric correction.
The remaining technical parameters of the satellite
can be seen in the table below.
2.3 Method
There are various geospatial software tools used by us
researchers at different stages in the precise study of
remote sensing. An example is the pre-processing,
classification, analysis, and prediction of LU/LC
changes using multispectral satellite imagery. Some
of them are: ENVI, ArcGIS, IDRISI, ERDAS
Imagine, Quantum GIS and Google Earth. Land cover
I-CRAFT 2024 - 4th International Conference on Research of Agricultural and Food Technologies
326
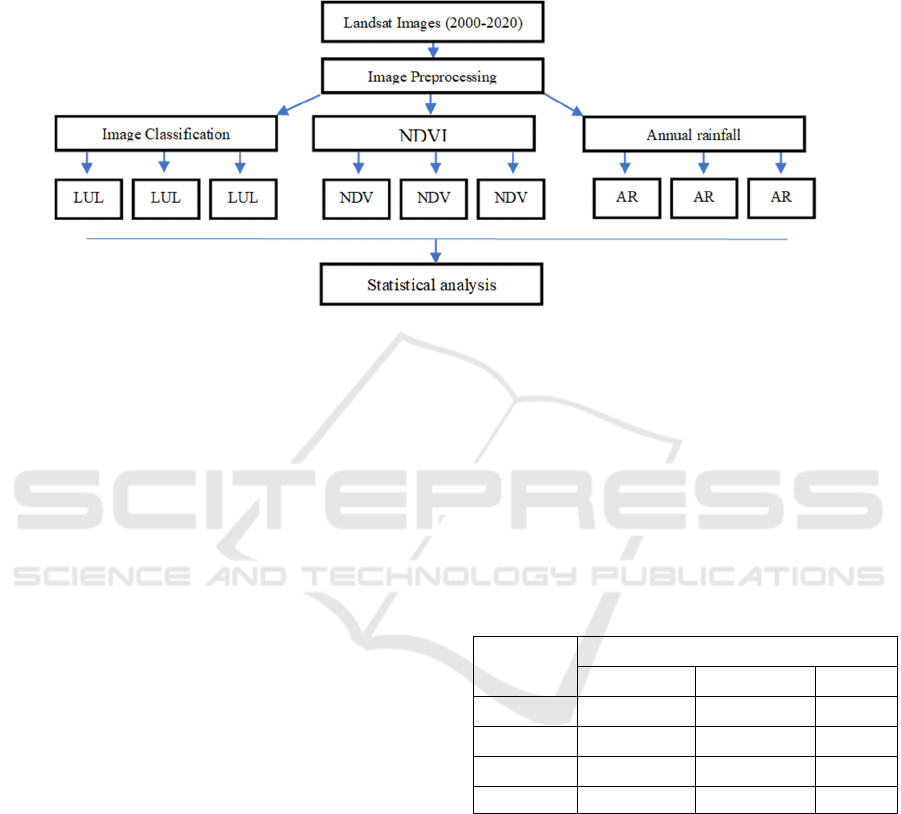
change classification and understanding can also be
assessed using various remote sensing indices:
NDVI, NDWI, NDBI, SAVI etc. Indices calculated
using satellite images have demonstrated the ability
of GIS to systematically, reliably and spatially
comprehensively monitor greenness and
accumulation indices. Methodological workflow and
data analysis of scientific research in the figure below
(Fig. 2).
Figure 2: Methodological workflow and data analysis.
Several types of land cover were distinguished
based on the study area in ArcGIS 10.7 using satellite
images as a source of information. Image
classification was performed using the MLC
Supervised Classification method. The main reason
that the downloaded spatial data was taken in June is
that the vegetation index is close to the maximum
point, as well as the selection of a cloudless image.
As mentioned above, only four of the 8 bands - Red,
NIR, SWIR, and TIRS1 bands- are required for
LULC analysis (Fig. 5). Vegetation cover analysis is
calculated by NDVI; the formula is given below.
Index varies between -1 and 1. In this case, the larger
the value, the healthier or dense plant cover is
understood, and the negative value is not considered
vegetation (Fig. 3).
NDVI = (NIR-RED)/(NIR+RED),
where: NIR is the Near Infrared band of Landsat
sensor (band 4 for Landsat TM 5 and Landsat-5 TM;
band 5 for Landsat 8 OLI); and RED is the red band
of Landsat sensor (band 3 for Landsat TM 5 and
Landsat ETM+ 7; band 4 for Landsat 8 OLI).
The CRU TS has provided a collection of high-
resolution, monthly observations dating back to 1901
(Yin et al., 2017). This set consists of ten observed
and derived variables. Rainfall data from this
collection were analysed and mapped using software
(Fig. 7).
3 RESULTS AND DISCUSSION
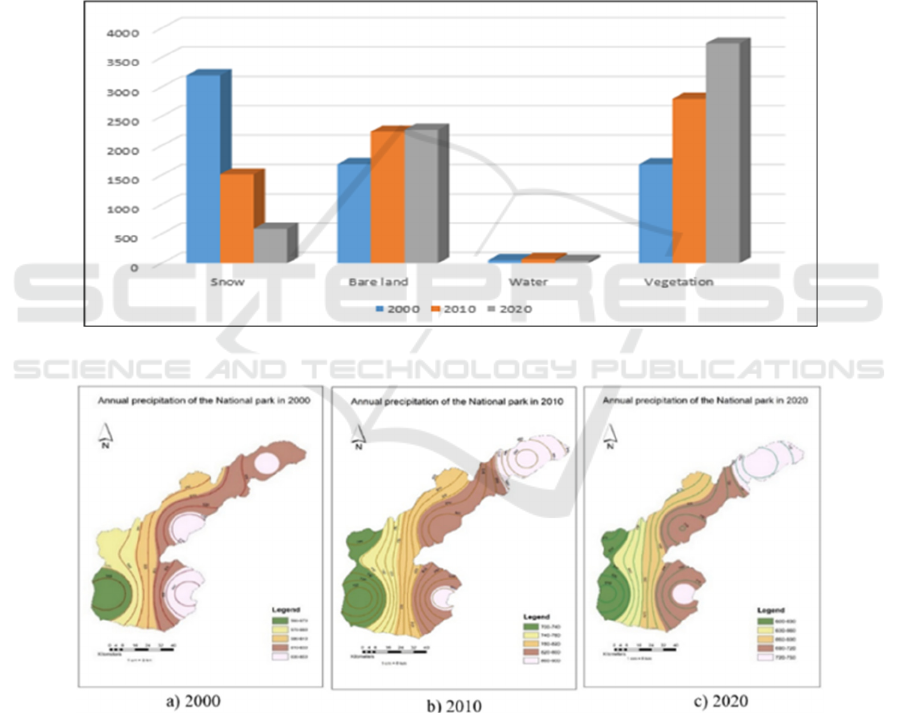
The achieved results show that within 20 years the
LULC of the National Park changed significantly.
The obtained results can be used for monitoring
glaciers, determining the flood of glacial lakes,
estimating forest biomass, and preserving
biodiversity in the national park (Table 1).
Table 3: Results of LULC assessment in the National Park.
Classes Area (km
2
)
2000 2010 2020
Snow 3200.3 1513.96 587.019
Bare land 1686.68 2239.74 2273.74
Water 54.3852 73.8441 45.8622
Vegetation 1684.19 2798 3741.37
Significant changes in vegetation cover were
observed due to the melting of glaciers and snow.
Although there is an increase in NDVI, it can be seen
that there is a regular decrease in the highest density
of green vegetation (Fig. 4).
Analyses of Land Use Land Cover Change Detection of the Ugam Chatkal National Park, Uzbekistan
327
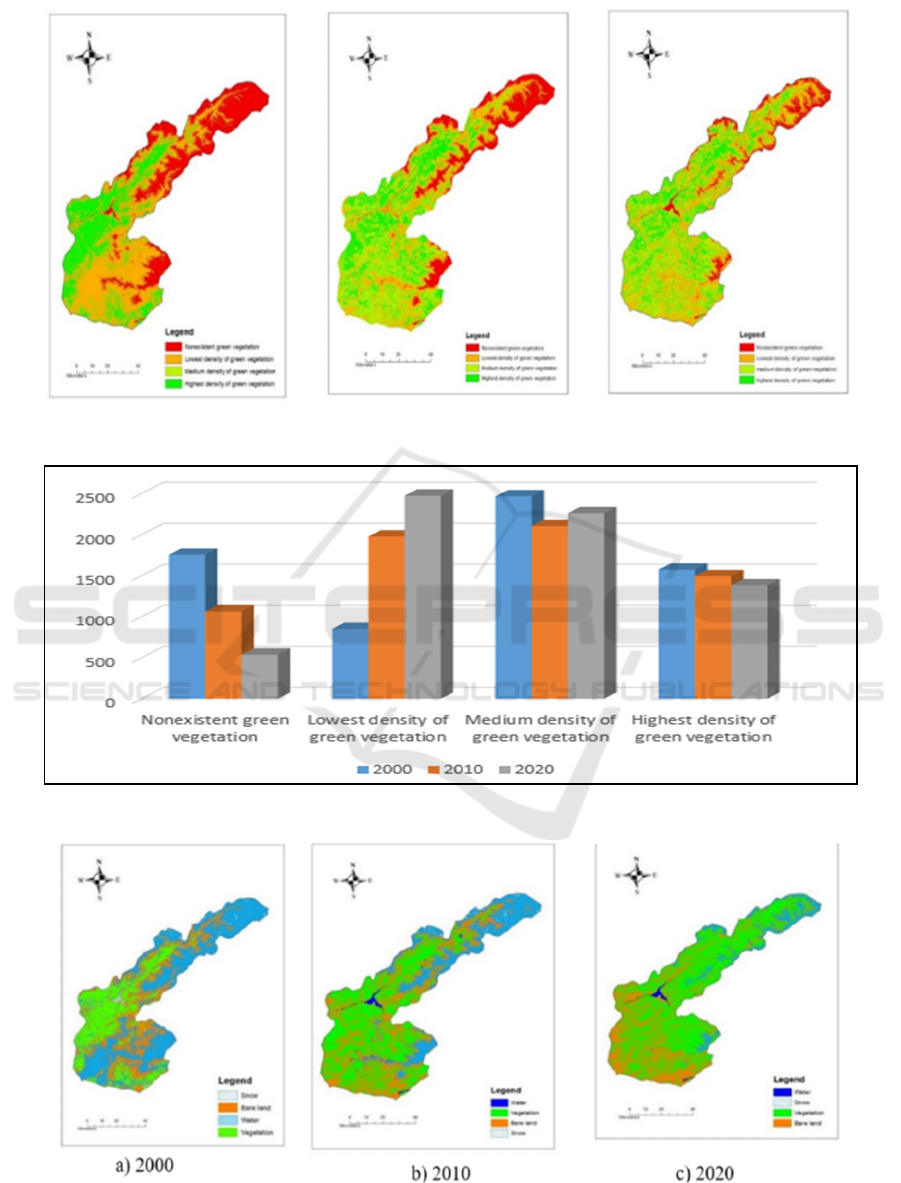
Figure 3: NDVI map of Tashkent region.
Figure 4: NDVI change dynamics of the study area.
Figure 5: LULC in Tashkent region during 2000-2020.
I-CRAFT 2024 - 4th International Conference on Research of Agricultural and Food Technologies
328
The main reason for doing LULC is to evaluate
the significant changes in the land surface over a long
period of time due to natural causes. serious changes
in the land cover caused a sharp change in the snow
cover against the background of global climate
change. as a result, it can be seen that the vegetation
cover was formed on the lands formed by the melting
of the snow cover, on the contrary, the amount of bare
land in the residential areas and resort zones increased
in the lands where there was a green cover (Fig. 6).
Annual precipitation data is derived from Version
4 of the CRU TS monthly high-resolution gridded
multivariate climate dataset (Juliev et al., 2022;
Teshaev et al., 2020; Aslanov et al., 2023;
Musirmonov et al., 2023; Juliev et al., 2023). The
downloaded data were analyzed in ArcGIS software
to create rainfall maps for the respective years. The
areas of the national park where bare land is growing,
a decline can be seen the amount of annual
precipitation while in the northern part the amount of
precipitation has increased (Fig. 8).
It can be seen from these maps that the annual
precipitation in the southwestern parts has decreased
sharply in recent decades, while the amount of heavy
precipitation has increased in the northeastern part of
the division. This conclusion was also clearly shown
by LULC maps (Fig. 5).
Figure 6: NDVI change dynamics of the study area.
Figure 7: Annual precipitation maps of the study area.
Analyses of Land Use Land Cover Change Detection of the Ugam Chatkal National Park, Uzbekistan
329
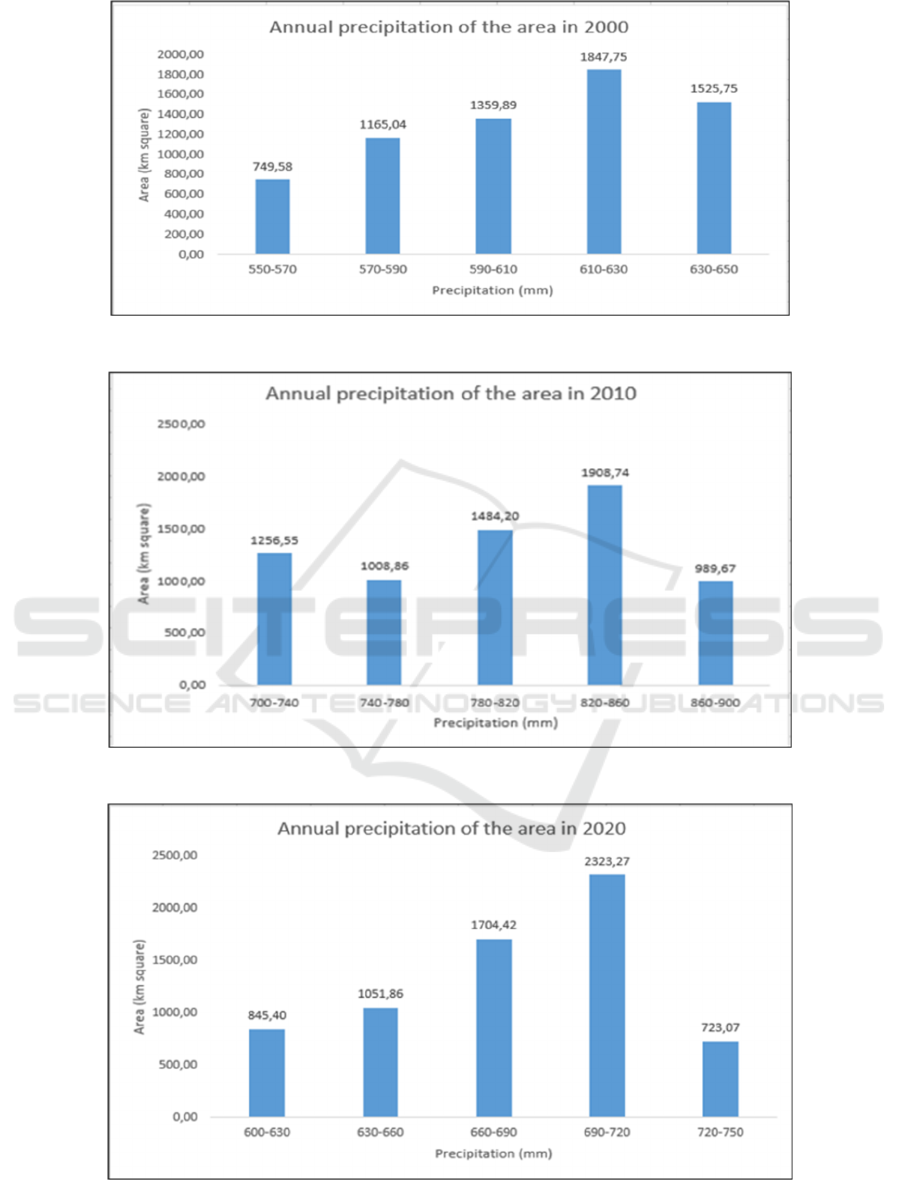
Figure 8: Yearly Precipitation Chart (in millimeters) for the study area in 2000.
Figure 9: Yearly Precipitation Chart (in millimeters) for the study area in 2010.
Figure 10: Yearly Precipitation Chart (in millimeters) for the study area in 2020.
I-CRAFT 2024 - 4th International Conference on Research of Agricultural and Food Technologies
330

4 CONCLUSIONS
The impact of global climate change in the Central
Asian region is becoming more severe every year. In
analyzing the dynamics of these changes, the
importance of RS and GIS systems is getting stronger
year by year.
- the greenness index has been increasing in the
national park for the past 20 years. This is mainly
observed in the northern and eastern parts of the
region;
- in the territory of the national park, a decrease in
snow cover was observed in the last 20 years, as a
result of which the growth of vegetation accelerated;
- as a result of anthropogenic effects, an increase
in bare lands was observed in the southwestern lands;
- the change in annual precipitation was observed
to increase mainly in the northern region and decrease
in the southern regions.
REFERENCES
Anon, 2023. Tashkent Region Wikipedia
Aslanov, I., Teshaev, N., Khayitov, K., Uzbekhon, M.,
Khaitbaeva, J., & Murodova, D., 2023. Analysis of
desertification trends in Central Asia based on MODIS
Data using Google Earth Engine. E3S Web of
Conferences, 443. DOI:
10.1051/e3sconf/202344306015.
Costanza, R., De Groot, R., Sutton, P., Van Der Ploeg, S.,
Anderson, S.J., Kubiszewski, I., Farber, S., & Turner,
R.K., 2014. Changes in the global value of ecosystem
services Glob. Environ. Change, 26, 152–8
Czúcz, B., Arany, I., Potschin-Young, M., Bereczki, K.,
Kertész, M., Kiss, M., Aszalós, R.,& Haines-Young, R.,
2018. Where concepts meet the real world: A systematic
review of ecosystem service indicators and their
classification using. CICES Ecosyst. Serv., 29, 145-157.
Didan, K., 2015. MOD13Q1 MODIS/Terra Vegetation
Indices 16-Day L3 Global 250m SIN Grid V006.
Emeribe,C., Uwadia, N., Fasipe, O., Isagba, E., 2017. Inter-
Decadal Nature of Rainfall Character Over
SudanoSahel, North-West Nigeria. AFRREV, 11, 55–
73.
Gafurova, L. & Juliev, M., 2021. Soil Degradation
Problems and Foreseen Solutions in Uzbekistan
Regenerative Agriculture ed D Dent and B Boincean
(Cham: Springer International Publishing), 59–67.
Gomes, E., Inácio, M., Bogdzevič, K., Kalinauskas, M.,
Karnauskaitė, D., & Pereira, P., 2021. Future land-use
changes and its impacts on terrestrial ecosystem
services: A review. Sci. Total Environ., 781, 146716.
Harris, I., Osborn, T.J., Jones, P., & Lister, D., 2020.
Version 4 of the CRU TS monthly high-resolution
gridded multivariate climate dataset. Sci. Data, 7, 109.
Juliev, M., Jumaniyazov, I., Togaev, I., Toshtemirov, Sh.,
Samiev, A., Ochilov, I., Usmanov, K., & Saidova, M.,
2023. Land degradation in Central Asia: a review of
papers from the Scopus database published in English
for the period of 2000-2020. E3S Web of Conferences,
462. https://doi.org/10.1051/e3sconf/202346203020.
Juliev, M., Matyakubov, B., Khakberdiev, O., Abdurasulov,
X., Gafurova, L., Ergasheva, O., Panjiev, U.,
Chorikulov, B., 2022. Influence of erosion on the
mechanical composition and physical properties of
serozems on rainfed soils, Tashkent province,
Uzbekistan. IOP Conf. Ser.: Earth Environ. Sci., 1068,
012005.
Juliev, M., Ng, W., Mondal, I., Begimkulov, D., Gafurova,
L., Hakimova, M., Ergasheva, O., & Saidova, M., 2023.
Surface displacement detection using object-based
image analysis, Tashkent region, Uzbekistan. E3S Web
of Conferences, 386.
https://doi.org/10.1051/e3sconf/202338604010.
Khamidov, M.Kh., Juraev, U.A., Buriev, X.B., Juraev,
A.K., Saksonov, U.S, Sharifov, F.K, & Isabaev, K.T.,
2023. Efficiency of drip irrigation technology of cotton
in saline soils of Bukhara oasis. IOP Conference Series:
Earth and Environmental Science, 1138.
Kontgis, C., Schneider, A., Fox, J., Saksena, S., Spencer,
J.H, & Castrence, M., 2014. Monitoring peri-
urbanization in the greater Ho Chi Minh City
metropolitan area. Appl. Geogr., 53, 377–88.
Kremen, C., 2005. Managing ecosystem services: what do
we need to know about their ecology? Ecol. Lett., 8,
468–479.
Kumar, B.P., Babu, K.R., Anusha, B.N., & Rajasekhar, M.,
2022. Geo-environmental monitoring and assessment
of land degradation and desertification in the semi-arid
regions using Landsat 8 OLI / TIRS, LST, and NDVI
approach. Environ. Chall., 8, 100578.
Lambin, E.F. & Geist, H.J., 2008. Land-use and land-cover
change: local processes and global impacts (Springer
Science & Business Media).
Mahkamova, D., Gafurova, L., Nabeva, G.,
Mukhammadev, S., Kasmov, U., Julev, M., 2022.
Integral indicators of the ecological and biological state
of soils in Jizzakh steppe, Uzbekistan. IOP Conf. Ser.:
Earth Environ. Sci., 1068, 1755-1307.
MohanRajan, S.N., Loganathan, A., & Manoharan, P.,
2020. Survey on Land Use/Land Cover (LU/LC)
change analysis in remote sensing and GIS
environment: Techniques and Challenges. Environ. Sci.
Pollut. Res., 27, 29900–26.
Musirmonov, J., Gafurova, L., Ergasheva, O., & Saidova,
M., 2023. Wastewater treatment in Central Asia: a
review of papers from the Scopus database published in
English of 2000−2020. E3S Web of Conferences, 386.
https://doi.org/10.1051/e3sconf/202338602005.
Oymatov, R., Teshaev, N., Makhsudov, R., & Safarov, F.,
2023. Analysis of soil salinity in irrigated agricultural
land using remote sensing data: case study of Chinoz
district in Uzbekistan. E3S Web of Conferences. doi:
10.1051/e3sconf/202340102004.
Analyses of Land Use Land Cover Change Detection of the Ugam Chatkal National Park, Uzbekistan
331

Teshaev, N., Mamadaliyev, B., Ibragimov, A., & Khasanov,
S., 2020. The soil-adjusted vegetation index for soil
salinity assessment in Uzbekistan, doi: 10.35595/2414-
9179-2020-3-26-324-333.
Tian, H., Banger, K., Bo, T. & Dadhwal, V.K., 2014.
History of land use in India during 1880–2010: Large-
scale land transformations reconstructed from satellite
data and historical archives. Glob. Planet. Change, 121,
78–88.
Yin, H., Khamzina, A., Pflugmacher, D., & Martius, C.,
2017. Forest cover mapping in post-Soviet Central Asia
using multi-resolution remote sensing imagery. Sci.
Rep., 7.
I-CRAFT 2024 - 4th International Conference on Research of Agricultural and Food Technologies
332
