
Optimization of Foliar Chitosan Doses as a Biofertilizer for Enhanced
Pepper Cultivation
Boran İkız
*a
, H. Yıldız Daşgan
b
, Cumali Yeniay and Muhammet Taş
Çukurova University, Department of Horticulture, 01330 Balcalı, Adana, Turkey
Keywords: Capsicum annuum L., Glucosamine, Sustanaible Agriculture, Biostimulant, Yield Optimization, Fruit
Quality.
Abstract: Chitosan is a water-soluble aminopolysaccharide obtained by the deacetylation of chitin, which is the second
most abundant biopolymer after cellulose. Chitin is primarily found in the exoskeletons of shellfish, and
chitosan is produced by converting the acetyl groups in the chemical structure of this natural polymer into
amine groups. The study aimed to evaluate the effects of different chitosan doses on plant growth, yield and
fruit properties of pepper. The experiment included a control group with no chitosan application, as well as
treatments with 150 ppm, 300 ppm, and 450 ppm of chitosan. The applications were made foliar once a week
The 150 ppm chtosan treatment ncreased yeld by 67.4%, and the 300 ppm treatment by 44.9%, compared
to the control. Chitosan treatments also significantly and positively influenced plant growth parameters, such
as plant height, plant width, and leaf number. Additionally, the chitosan applications increased, vitamin C,
total phenols and total flavonoids, EC (electrical conductivity) in the fruit juice.
This study’s objectives are
to ascertain the proper chitosan dosage for application and to track the beneficial benefits of employing
chitosan as a biostimulant.
1 INTRODUCTION
Chtosan s a naturally occurrng bopolymer wth a
wde range of possble uses n agrculture. In
partcular, chtosan s employed as a rhzosphere
modulator, plant growth regulator, and bopestcde.
When used as a bopestcde, chtosan effectvely
combats bactera, fungus, and vruses (Badawy et al.,
2011). It strengthens the structure of the sol, makes t
more capable of retanng water, and encourages
mcrobal actvty n the rhzosphere. It prevents harm
from heavy metals, whch enhances sol health
(Naeem ve et al., 2018). Because t encourages cell
dvson and plant growth, chtosan plays a sgnfcant
role n boostng frut and vegetable output yelds
(Khan et al., 2009). It s well known that the food and
agrcultural ndustres also employ chtosan as a flm
coatng. Bodegradable and antbacteral, chtosan-
based flms are also knd to the envronment.
Accordng to Rhm et al. (2020), ths s an addtonal
alternatve for food preservaton and plant protecton.
a
https://orcd.org/0000-0003-3012-4533
b
https://orcd.org/0000-0002-0403-1627
*
Correspondence Author
It can also have an effect on agrculture’s sustanablty
by beng economcal and envronmentally bengn
(Malerba et al., 2021). Pepper (Capscum annuum L.)
s an economcally mportant crop grown for ts
nutrtonal value, boactve compounds, antoxdant
propertes, and natural colors (Santosh, 2013).
Pepper
s wdely consumed worldwde both as a fresh
vegetable and as a processed product. Varetes of
peppers nclude sweet peppers (e.g., bell peppers) and
hot peppers (e.g., chl peppers). Wth ts hgh content
of vtamn C, vtamn A, and antoxdants, pepper s
consdered a hghly nutrtous vegetable and s
therefore regarded as an mportant source for a healthy
det (Sdhu et al., 2019).
Accordng to 2022 FAO data,
pepper s one of the most mportant vegetables,
cultvated on 2,020,816 hectares wth a producton of
36,972,494 tons (FAO, 2018).
Pepper s also used as a model plant for
botechnologcal and bostmulant applcatons that
enhance resstance to varous botc (pathogens,
nsects) and abotc (drought, salnty) stress factors
˙
Ikız, B., Da¸sgan, H. Y., Yeniay, C. and Ta¸s, M.
Optimization of Foliar Chitosan Doses as a Biofertilizer for Enhanced Pepper Cultivation.
DOI: 10.5220/0014261000004738
Paper published under CC license (CC BY-NC-ND 4.0)
In Proceedings of the 4th International Conference on Research of Agricultural and Food Technologies (I-CRAFT 2024), pages 253-259
ISBN: 978-989-758-773-3; ISSN: 3051-7710
Proceedings Copyright © 2025 by SCITEPRESS – Science and Technology Publications, Lda.
253

(Trverd et al., 2020). Pepper s a plant that performs
best under warm clmate condtons. Factors such as
water stress and hgh temperatures have sgnfcant
mpacts on the productvty of pepper cultvaton. To
enhance the plant’s reslence to these envronmental
stresses, varous bostmulants and water management
strateges are employed.
There are over 200 common names used 2nda re
Capscum annuum speces. Among the most common
are chl pepper, red pepper (sweet varetes), bell
pepper, red pepper, jalapeños, and chltepn (hot
varetes), as well as Chrstmas peppers (ornamental)
(Latham et al., 2009; Zhang et al., 2002). In the past,
some knda forms of ths speces were referred to as
C. Frutescens, but the characterstcs used to
dstngush these 2nda re2e observed n many
populatons of C. Annuum, and there s no consstently
recognzable C. Frutescens speces (Zhang et al.,
2002). It can be dffcult to dfferentate Capscum
annuum from cultvated C. Chnense (the hottest
peppers) and C. Frutescens (tabasco peppers), as ther
morphologcal trats may overlap. These three speces
share the same ancestral gene pool 2nda re sometmes
referred to as the “annuum-chnense-frutescens
complex (Aracel et al., 2009).
Caps৻cum annuumL. Contans capsacnods
(capsacn, dhydrocapsacn), carotenods (luten,
zeaxanthn, capsorubn, β-carotene), flavonods
(quercetn, kaempferol, catechn, epcatechn, rutn,
luteoln), and sterodal saponns (capscosde E, F, G,
and capscdn). The man components of C. Annuum
essental ol, dentfed usng GC/MS, are capsamde
and acetc acd. C. Annuum has been reported to
possess varous bologcal actvtes, ncludng
antoxdant, antbacteral, antvral, antprolferatve,
ant-adpogenc, antmutagenc, enzyme nhbtory,
ant-nflammatory, hepatoprotectve, antdabetc,
renoprotectve, hypocholesterolemc, anttumor, ant-
obesty, analgesc, appette suppressant, and ant-
reflux propertes (Yuca, 2002).
2 MATERIALS AND METHODS
The research took place durng the summer growng
season of 2024 at the Unversty of Cukurova, Adana,
Turkye (36°59′N, 35°18′E, 20 m above sea level).
The temperature values n the regon fluctuated
throughout the days, wth daytme temperatures
rangng between 35-40°C. The row spacng was set to
50 cm, and the spacng wthn the rows was 90 cm.
Chtosan (Adaga-NanoWet) was appled to the plants
at doses of 150 ppm, 300 ppm, and 450 ppm per week
to determne the optmal dose after 15 days frst
plantng and per one week.
The pepper seeds used n
ths study were of the Semerkant F1 varety, developed
by the Nunhemscompany. After beng grown nto
seedlngs, they were transplanted nto the sol.).
Harvestng of the plants began 45 days after plantng
and was carred out fve tmes.
Plant heght, plant wdth, and plant canopy
measurements were taken usng a meter, whle frut
length, frut dameter, and frut wdth were measured
usng calpers.
Color measurements were performed
usng the FRU Precse color reader WR-18 color space
system. pH and EC measured by portable WTW
phmeter.
Chlorophyll content was measured usng a
handheld SPAD meter from the Mnolta brand.
Vtamn C content was carred out usng the adapted
approach outlned n Elgalan et al. (2017)’s study.
A randomzed block experment was conducted
usng a four-replcate desgn, wth 15 plants each
replcate. In the context of frut analyss,
measurements were performed on 10 fruts per repeat.
Furthermore, at the tme of harvest, 10 plants were
measured n each replcaton. Statstcal analyses were
performed wth the JMP software.
The am of ths
study s to observe the ameloratve effects of usng
chtosan as a bostmulant and to determne the
approprate chtosan dosage for applcaton.
3 RESULTS AND DISCUSSION
3.1 Plant Heght, Plant Dameter and
Stem Dameter
When examnng the plant heght n pepper plants, t
was observed that the use of chtosan as a bostmulant
ncreased plant heght. Plant heght ncreased n all
three doses compared to the control plants; however,
there was no statstcally sgnfcant dfference
between the treatments. In the control plants, the plant
heght was 48.08 cm, whle the plants treated wth 300
ppm chtosan as a bostmulant ncreased to 55.25 cm.
Smlarly, plants treated wth chtosan exhbted a
greater stem dameter compared to the control plants.
Although the dfference was not statstcally
sgnfcant, the plant dameter was found to be hghest
n the 300 ppm chtosan treatment, consstent wth
other parameters. Salachna and Zawadznska (2014)
demonstrated that chtosan, wth varyng molecular
weghts, can be used as a bostmulant n the
cultvaton of Freesa plants n pots. They observed
that, regardless of the compound’s molecular weght,
plants treated wth chtosan had more leaves and
shoots, flowered earler, and produced more flowers
and bulbs. Addtonally, Kumaraswamy et al. (2021)
I-CRAFT 2024 - 4th International Conference on Research of Agricultural and Food Technologies
254
reported that the applcaton of chtosan-slcon nano-
fertlzer on corn plants enhanced growth and yeld.
They observed that these bostmulants ncreased leaf
area as well as stem and root length. Perez et al. (2024)
conducted folar applcatons of chtosan,
brassnosterods, and thdazuron on strawberres,
demonstratng that chtosan treatment ncreased plant
heght, leaf count, leaf area, and frut frmness.
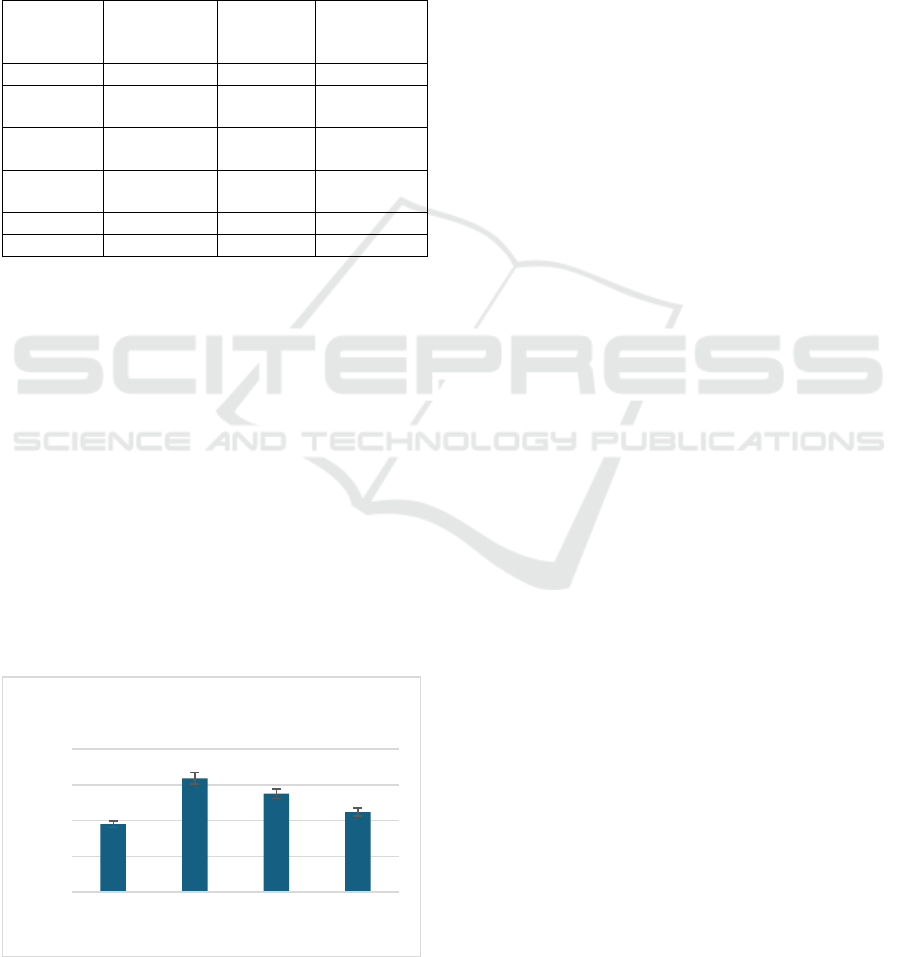
Table 1: Effects of chtosan doses on plant growth
measurements n pepper.
Apps.
Plant-
Dameter
(
cm
)
Plant
Heght
(
cm
)
Stem
dameter
(
mm
)
Control 45.54 48.08 b 12.83 b
150 ppm
Chtosan
53.46 55.00 a 17.42 a
300 ppm
Chtosan
55.08 55.25 a 19.70 a
450 ppm
Chtosan
52.00 54.50 a 17.76 a
P0.05 N.S 0.02 0.002
LSD N.S 6.14 2.80
There s no sgnfcant dfference between means wth the
same letter n the same column, LSD the least sgnfcant
dfference, NS: Non sgnfcant, Apps: Applcatons.
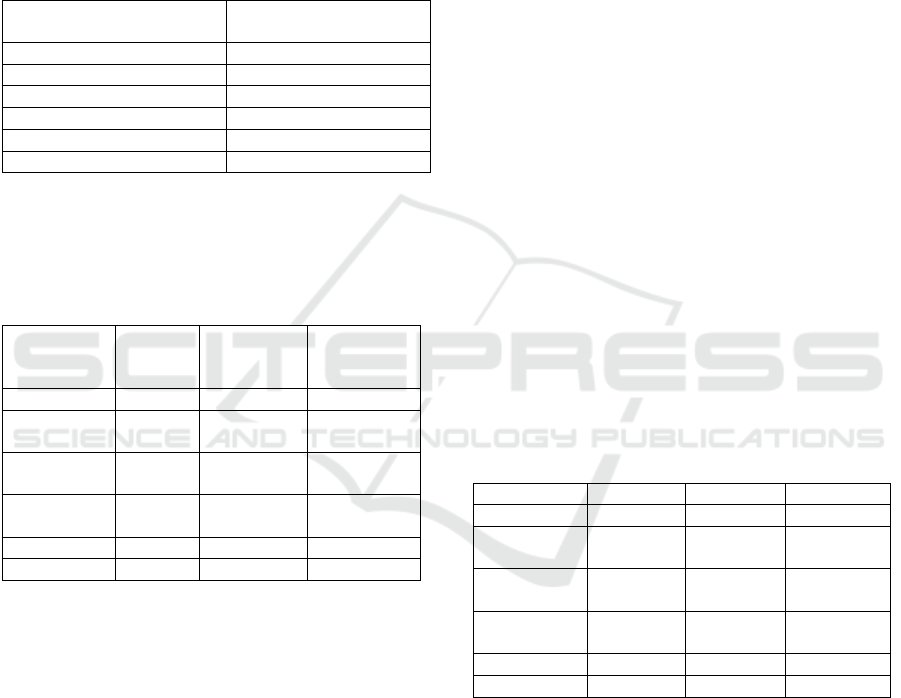
3.2 Yeld
The 150 ppm chtosan treatment ncreased yeld by
67.4%, the 300 ppm treatment by 44.8%, and the 450
ppm treatment by 17.7%, compared to the control
(Fgure 1). Abdel-Mawgoud et al. (2010) appled
chtosan to strawberry plants and observed an ncrease
n the number of fruts per plant as well as
mprovements n yeld parameters per plant. Plant
growth parameters, chlorophyll content, and
consequently photosynthetc capacty, as well as
Vtamn C content an mportant factor n pepper plants
showed better results n all chtosan treatments
compared to the control.
Fgure 1: Effects of chtosan doses on yeld n pepper.
However, t was observed that hgher chtosan
doses led to a reducton n yeld. Usng the lowest
dose of chtosan s also economcally advantageous.
When examnng other parameters, no sgnfcant
dfferences were observed among the dfferent
chtosan treatments.
3.3 Chlorophyll Content
In terms of chlorophyll content, the use of chtosan,
bo-fertlzer yelded hgher results compared to the
control plants. Snce an ncrease n chlorophyll
content s assocated wth photosynthess, t was
observed that chtosan enhances photosynthess,
whch n turn nfluences the ncrease n growth
parameters such as plant heght and stem dameter.
İnam et al. (2024) nvestgated the effects of chtosan
and znc oxde fertlzers on allevatng the severe
mpacts of drought on corn plants. They observed that
the applcaton of 1000 µg/L chtosan produced better
results than both the control and znc oxde
treatments.
Smlarly, n ther study on strawberres,
Perez et al. (2024) suggested that the combned
applcaton of chtosan and brassnosterods
sgnfcantly promoted crown dameter,
photosynthetc pgments, carotenods, and the fresh
and dry weghts of both roots and above-ground parts,
as well as maturaton.
In ther study, Tamer Khalfa et
al. (2024) nvestgated the nteractve effects of sol
mulchng materals (non-mulched, whte plastc, rce
straw, and sawdust) and chtosan folar spray
applcatons (control, 250 mg L⁻¹ regular chtosan,
125 mg L⁻¹ nano-chtosan, and 62.5 mg L⁻¹ nano-
chtosan) on the bochemcal sol propertes and
productvty of common beans grown n clay-salne
sol. Ther research emphaszed the adopton of eco-
frendly strateges to enhance the sustanablty of
agrcultural ecosystems. The hgher chlorophyll
content ndcates enhanced photosynthess, whch n
turn promotes ncreased plant growth and
development. Ths also explans the hgher yeld
observed n chtosan applcatons compared to the
control.
3.4 Frut Propertes
When examnng frut wdth, t s observed that the
use of chtosan shows an ncrease compared to the
control. The use of 150 ppm chtosan ncreased by
8.12% compared to the control, 300 ppm by 26.78%,
and 450 ppm by 11.22%. The use of chtosan has
generally ncreased the frut wdth. Frut sze has also
shown a sgnfcant ncrease n chtosan usage, just
lke frut wdth. The frut sze ncreased by 9.39% n
3801 c
6364 a
5506 ab
4473 b
0
2000
4000
6000
8000
Control 150 ppm
Chitosan
300 ppm
Chitosan
450 ppm
Chitosan
Yield(kg/m2)
Optimization of Foliar Chitosan Doses as a Biofertilizer for Enhanced Pepper Cultivation
255
the 150 ppm chtosan applcaton compared to the
control, 21.74% n the 300 ppm applcaton, and
7.65% n the 450 ppm applcaton.
No correlaton has
been establshed between chtosan applcaton and
dry matter producton percentage (Table 3)
. Wth the
use of chtosan as a bostmulant, not only qualty
parameters but also physcal measurements of the
frut show mprovement (Rahman et al., 2018).
Table 2: Effects of chtosan doses on chlorophyll content n
pepper.
Apps.
Chlorophyll
Content(SPAD)
Control 49.14 b
150
pp
m Chitosan 54.49 a
300
pp
m Chitosan 50.97 a
450
pp
m Chitosan 55.55 a
P
0.05
0.01
LSD 5.001
There s no sgnfcant dfference between means wth the
same letter n the same column, LSD the least sgnfcant
dfference
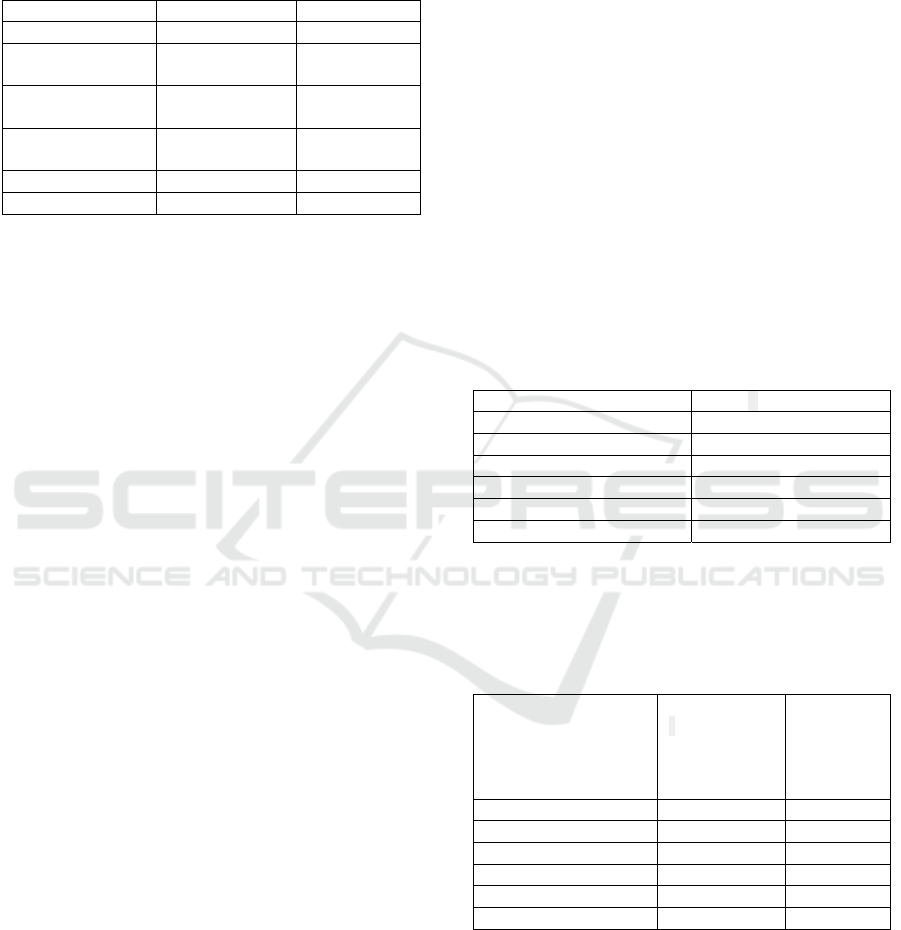
Table 3: Effects of chtosan doses on frut propertes n
pepper.
Apps. Frut
Wdth
(
mm
)
Frut
Heght
(
cm
)
Dry Matter
(%)
Control 25.5 b 11.50 b 5.31
150 ppm
Chtosan
27.57 b 12.58 ab 5.24
300 ppm
Chtosan
32.33 a 14.00 a 5.36
450 ppm
Chtosan
28.36 ab 12.38 ab 5.44
P
0.05
0.03 0.02 N.S
LSD 4.43 1.47 N.S
There s no sgnfcant dfference between means wth the
same letter n the same column, LSD the least sgnfcant
dfference
3.5 Frut Colour
The LAB color model ncludes L (lghtness), A (green
to red scale), and B (blue to yellow scale). Across all
treatments, the lghtness (L) values are smlar, wth a
slght ncrease observed wth chtosan applcatons.
The hghest lghtness occurs at 300 ppm (46.81),
whle the control group has the lowest value (45.19).
Although the dfferences n lghtness between the
control and chtosan-treated groups are 4ort, they
suggest a modest mprovement n brghtness wth
chtosan (Table 4).
The A parameter, representng the green-red scale,
shows a gradual ncrease wth hgher chtosan
concentratons. The control group has an A value of -
5.18, whle the maxmum shft toward red occurs at
300 ppm (-6.92). Ths ndcates that the 300 ppm
chtosan applcaton slghtly enhances red
pgmentaton compared to other treatments and the
control (Table 4).
4ort he B parameter (blue-yellow scale), the
hghest value s recorded at 300 ppm (18.20 a), wth
both 300 ppm and 450 ppm treatments yeldng
statstcally sgnfcant ncreases n yellow
pgmentaton compared to the control (16.34 b). Ths
suggests that chtosan, partcularly at 300 ppm,
enhances the yellow coloraton of the frut,
potentally contrbutng to a more vsually appealng
appearance (Table 4).
The applcaton of 300 ppm chtosan s the most
effcacous n affectng frut coloraton, resultng n
substantal ncreases n the yellow (B) and red (A)
scales, thereby mprovng overall color
characterstcs. Ths concentraton has the greatest
lghtness, renderng the frut more lumnous.
Chtosan treatments, partcularly around 300 ppm,
sgnfcantly mprove the aesthetc qualty of the
fruts. Dulta et al. (2022) examned the mpact of ZnO
nanopartcle-nfused chtosan coatng on the post-
harvest qualty of eggplants. Improvements n both
the texture and color of the fruts were noted n
comparson to the control.
Table 4: Effects of chtosan doses on frut colour n pepper.
Apps. L(Frut) A(Frut) B(Frut)
Control 45.19 -5.18 16.34 b
150 ppm
Chtosan
46.61 -5.35 18.57 a
300 ppm
Chtosan
46.81 -6.92 18.20 a
450 ppm
Chtosan
46.16 -6.69 17.15 a
P
0.05
N.S N.S 0.01
LSD N.S N.S 1.98
There s no sgnfcant dfference between means wth the
same letter n the same column, LSD the least sgnfcant
dfference, NS: Non sgnfcant.
3.6 Qualty Paramaters
3.6.1 pH and EC n Frut Juce
Although there s a notceable ncrease n pH value,
no statstcally sgnfcant ncrease has been observed.
However, the EC value decreased as the chtosan dose
ncreased, specfcally showng a reducton at the 450
I-CRAFT 2024 - 4th International Conference on Research of Agricultural and Food Technologies
256
ppm applcaton (Table 5). In ther study publshed,
Daşgan et al. (2022) found the effects of bostmulant
applcaton on EC and pH wthn the same group.
Table 5: Effects of chtosan doses on pH and EC n pepper.
A
pp
s.
p
H EC
(
dSm
-1
)
Control 5.54 4.99 a
150 ppm
Chtosan
5.86 5.06 a
300 ppm
Chtosan
5.87 5.11 a
450 ppm
Chtosan
5.76 4.47 b
P
0.05
N.S. 0.01
LSD N.S. 0.51
(There s no sgnfcant dfference between means wth the
same letter n the same column, LSD the least sgnfcant
dfference, NS: Non sgnfcant).
3.6.2 Vtamn C
The control group exhbts the lowest Vtamn C
content at 69.6 (b), sgnfyng that n the absence of
chtosan treatment, Vtamn C levels are nferor to
those n treated groups. The 150 ppm chtosan
treatment demonstrates a consderable elevaton n
Vtamn C content to 76.1 (a), whch s statstcally
superor to the control, underscorng the benefcal
mpact of chtosan at ths dose. At 300 ppm, the
Vtamn C concentraton attans 73.0 (ab), surpassng
the control but not exhbtng a statstcally sgnfcant
dfference from the 150 ppm treatment. The 450 ppm
chtosan concentraton yelds the greatest Vtamn C
content at 78.2 (a), exhbtng a statstcally
sgnfcant dfference from the control, ndcatng that
elevated chtosan concentratons may further enhance
Vtamn C levels.
The Vtamn C value showed an
ncrease of 9.34% at 150 ppm, 4.47% at 300 ppm, and
12.36% at 450 ppm compared to the control (Table 6).
The study demonstrates that chtosan treatments
markedly ncrease Vtamn C content. Whle 450 ppm
produces the maxmum concentratons, 150 ppm
provdes a sgnfcant enhancement wth only one-
thrd the quantty of chtosan relatve to 450 ppm. In
lght of the absence of a statstcally sgnfcant
dfference, 150 ppm may be regarded as the more
effectve opton. Plants subjected to chtosan exhbt
enhanced synthess of secondary metaboltes,
ncludng polyphenolcs, lgnn, flavonods, and
phytoalexns, alongsde Vtamn C, resultng n
mproved product qualty. Chtosan nanopartcles of
varyng szes have been employed to encapsulate
Vtamn C, prolong ts shelf lfe, and nvestgate ts
dstrbuton.
3.6.3 Total Phenols and Total Flavanods
Compounds
Total phenol and flavonoid contents in the fruit are
directly associated with quality, and it has been
observed that the use of chitosan in pepper fruit
increases these substances (Gholamipour et al.,
2009). In our study, when examining the effect of
chitosan use on the total phenolic content in pepper
plants, an increase of 15.69% was observed at a 150
ppm dose, 14.81% at a 300 ppm dose, and 12.39% at
a 450 ppm dose. Even though there is no statistical
difference, there is a decrease in the total phenol
content as the dose increases. When the total
flavonoid content was examined, compared to the
control, 150 ppm chitosan showed an increase of
22.21%, 300 ppm an increase of 11.31%, while the
application at the 450 ppm dose showed a decrease of
0.44%. A high dose of chitosan has caused a decrease
in the total flavonoid content (Table 7).
Table 6. Effects of chtosan doses on Vtamn C n pepper.
A
pp
s. Vt C
(
m
g
100
g
FW
−1)
Control 69.6 b
150 ppm Chtosan 76.1 a
300 ppm Chtosan 72.9 ab
450
pp
m Chtosan 78.2 a
P
0.05
0.01
LSD 4.41
There s no sgnfcant dfference between means wth the
same letter n the same column, LSD the least sgnfcant
dfference.
Table 7. Effects of chtosan doses on total phenols and
flavanods n pepper.
Apps. Total phenol
(mg GA/100 g
FW)
Total
flavonods
(mg
RU/100 g
FW)
Control 74.39 b 126.22 b
150
pp
m Chtosan 86.06 a 154.27 a
300
pp
m Chtosan 85.41 a 140.50 ab
450 ppm Chtosan 83.61 a 125.66 b
P
0.05
0.008 0.001
LSD 4.31 14.64
There s no sgnfcant dfference between means wth the
same letter n the same column, LSD the least sgnfcant
dfference.
Optimization of Foliar Chitosan Doses as a Biofertilizer for Enhanced Pepper Cultivation
257

4 CONCLUSIONS
Ths study conclusvely reveals that the applcaton of
chtosan greatly nfluences the growth, physcal
characterstcs, and yeld of pepper plants. The use of
150 ppm chtosan produced the maxmum yeld,
suggestng that lower concentratons are more
effcacous n mprovng yeld results n pepper
growng. Although 300 ppm chtosan was deal for
enhancng frut characterstcs ncludng breadth,
heght, and color pgmentaton, t dd not exceed 150
ppm n overall productvty. Moreover, elevated doses
such as 450 ppm shown no substantal advantages and
could even detrmentally affect yeld. The results
ndcate that chtosan s an excellent bostmulant for
pepper growth, wth 150 ppm dentfed as the
optmal concentraton for enhancng yeld and crop
qualty. Ths research underscores the promse of
chtosan as an economcal and envronmentally
sustanable bostmulant for mprovng pepper yeld.
Future nvestgatons should examne the mpact of
chtosan across dverse envronmental condtons and
varous pepper cultvars to enhance applcaton
methodologes.
REFERENCES
Abdel-Mawgoud, A.M.R., Tantawy, A.S., El-Nemr, M.A.,
& Sassne, Y.N., 2010. Growth and yeld responses of
strawberry plants to chtosan applcaton. European
Journal of Sc৻ent৻f৻c Research, 39(1), 170-177.
Aracel, A.M., Morrell, P.L., Roose, M.L., & Km, S.C.,
2009. Genetc dversty and structure n semwld and
domestcated chles (Caps৻cum annuum; Solanaceae)
from Mexco. Amer৻can Journal of Botany, 96(6),
1190–1202, https://do.org/10.3732/ajb.0800155.
Badawy, M. E. I., & Rabea, E. I., 2011. A bopolymer
chtosan and ts dervatves as promsng antmcrobal
agents aganst plant pathogens and ther applcatons n
agrculture. Journal of Pest Sc৻ence, 84(3), 229-245.
Dasgan, H.Y., Aldyab, A., Elgudayem, F., Ikz, B., &
Gruda, N.S., 2022. Effect of bofertlzers on leaf yeld,
ntrate amount, mneral content and antoxdants of
basl (Oc৻mum bas৻l৻cum L.) n a floatng culture.
Sc৻ent৻f৻c Reports, 12(1), 20917.
Dulta, K., Koşarsoy Ağçel, G., Thakur, A., Sngh, S.,
Chauhan, P., & Chauhan, P.K., 2022. Development of
algnate-chtosan based coatng enrched wth ZnO
nanopartcles for ncreasng the shelf lfe of orange
fruts (C৻trus s৻nens৻s L.). Journal of Polymers and the
Env৻ronment, 30(8), 3293-3306.
Elgalan, I.E.H., Elkareem, M.A.M.G., Noh, E.A.A.,
Adam, O.E.A., & Alghamd, A.M.A., 2017.
Comparson of two methods for the determnaton of
vtamn C (Ascorbc Acd) n some fruts. Am. J. Chem.,
2, 1–7.
Gholampour Fard, K., Kamar, S., Ghasemnezhad, M., &
Ghazvn, R.F., 2009. Effect of chtosan coatng on
weght loss and postharvest qualty of green pepper
(Caps৻cum annum L.) fruts. VI Internat৻onal
Postharvest Sympos৻um, 877, 821-826.
İnam, N.D., & Özdamar Ünlü, H., 2024. Use of oxalc acd
and chtosan to mprove pepper yeld and qualty.
Cogent Food & Agr৻culture, 10(1), 2366381.
Khalfa, T., Abdel-Kader, N.I., Elbagory, M., Ahmed, M. E.,
Saber, E. A., Omara, A. E. D., & Mahdy, R.M., 2024.
Investgatng the nfluence of eco-frendly approaches
on salne sol trats and growth of common bean plants
(Phaseolus vulgar৻s L.). PeerJ, 12, e17828.
Khan, W., Rayrath, U. P., Subramanan, S., Jthesh, M. N.,
Rayorath, P., Hodges, D. M., ... & Prthvraj, B., 2009.
Seaweed extracts as bostmulants of plant growth and
development. Journal of Plant Growth Regulat৻on,
28(4), 386-399.
Kumaraswamy, R.V., Saharan, V., Kumar, S., Choudhary,
R.C., Pal, A., Sharma, S.S., ... & Bswas, P., 2021.
Chtosan-slcon nanofertlzer to enhance plant growth
and yeld n maze (Zea mays L.). Plant Phys৻ology and
B৻ochem৻stry, 159, 53-66.
Latham E., 2009. The colourful world of chlles.
Stuff.co.nz, http://www.stuff.co.nz/lfe-style/food-
wne/1756288.
Malerba, M., & Cerana, R., 2021. Chtosan as a sustanable
tool n agrculture: recent advances and future
perspectves. Internat৻onal Journal of Molecular
Sc৻ences, 22(6), 2938
Martínez-Pérez, M.E., Ruíz-Anchondo, T.D.J., Jacobo-
Cuéllar, J.L., & Calderón-Zavala, G., 2024. Responses
to folar sprays of strawberry varety ‘Portola’to
bostmulants on growth, yeld, qualty, and boactve
compounds. Notulae Botan৻cae Hort৻ Agrobotan৻c৻
Cluj-Napoca, 52(3), 13513-13513.
Naeem, M., Za-ur-Rehman, M., & Akhtar, K., 2018.
Chtosan as a sol amendment for agrcultural
sustanablty. Journal of Plant Nutr৻t৻on, 41(7), 937-
954.
Rahman, M., Mukta, J.A., Sabr, A.A., Gupta, D.R., Moh-
Ud-Dn, M., Hasanuzzaman, M., ... & Islam, M.T.,
2018. Chtosan bopolymer promotes yeld and
stmulates accumulaton of antoxdants n strawberry
frut. PloS one, 13(9), e0203769.
Rhm, J.W., Park, H.M., & Ha, C.S., 2020. Recent
developments n chtosan-based flms for food and
agrcultural applcatons. Carbohydrate Polymers,
115428. DOI: 10.1016/j.carbpol.2020.115428.
Salachna, P., & Zawadzńska, A., 2014. Effect of chtosan
on plant growth, flowerng and corms yeld of potted
freesa. Journal of Ecolog৻cal Eng৻neer৻ng, 15(3).
Santosh, K., 2013. Bberde (Caps৻cum annuum L.) genetk
çeştllk çalışmaları. As৻an J Hort., 8, 280–284.
Sdhu, J.S., Kabr, Y., & Huffman, F.G., 2019. Functonal
foods from Capscum speces: A revew. Journal of
Food Sc৻ence and Technology, 56(10), 4211-4223.
DOI: 10.1007/s13197-019-03915-x.
I-CRAFT 2024 - 4th International Conference on Research of Agricultural and Food Technologies
258

Trved, P., Duan, Y., & Wang, N., 2020. Integrated
management of bacteral spot and other dseases n
Capscum speces. Phytopathology, 110(7), 1160-1167.
DOI: 10.1094/PHYTO-01-20-0012-RVW.
Yuca, H., 2022. Caps৻cum annuum L. In Novel drug targets
wth tradtonal herbal medcnes: Scentfc and
clncal evdence. 95-108. Cham: Sprnger Internatonal
Publshng.
Zhang Z., Lu, A., & D′arcy, W.G., 2002. Caps৻cum annuum
Lnnaeus, Specal Plant 1:188.1753, Flora of Ch৻na, 17,
313–313.
Optimization of Foliar Chitosan Doses as a Biofertilizer for Enhanced Pepper Cultivation
259
