
Real-Time Monitoring of Displacement of Machine Vision Bridge
Based on YOLOV5-MLR Study
Dong Ran
1,2,* a
, Jianxu Long
1,2 b
, Zhuan Wang
1,2
, Xiaoyong Zhang
1,2
and Qian Guo
1,2
1
Department of Architectural Engineering, Guizhou Communications Polytechnic University, Guiyang 551400, China
2
Key Laboratory of High Performance Repair Materials, Guizhou Communications Polytechnic University,
Guiyang 551400, China
*
Keywords: Bridge Monitoring, Target Detection, Target Recognition, Displacement Monitoring.
Abstract: Currently, the bridge maintenance tasks are arduous, and the health condition of bridges is of the utmost
importance to ensure traffic safety. In order to achieve real-time monitoring of bridges and reduce monitoring
costs, it is necessary to seek practical and effective solutions. Research has found that due to the influence of
environmental and other factors, the precision and accuracy of traditional machine vision monitoring methods
are insufficient. Therefore, this paper proposes a method called the YOLOV5-MLR improved algorithm. This
algorithm adopts more complex texture targets and can better distinguish the surrounding environment during
the monitoring process, thus improving the accuracy. In addition, during the calculation process, the algorithm
refines the precision unit to the pixel level and can achieve a precision level at the sub-millimeter level. After
a series of experimental verifications, the results show that the YOLOV5-MLR improved algorithm has high
robustness, and the monitoring error is controlled at the millimeter level, meeting the specification
requirements for bridge monitoring. This new algorithm provides important technical support for bridge
health monitoring and is expected to play a key role in the field of bridge monitoring.
1 INTRODUCTION
Currently, for the monitoring of buildings, slopes and
bridges, the main equipment used are total stations
and RTK. The total station has relatively high
precision and is the mainstream equipment for
monitoring. (Liu et al., 2024; Liao et al., 2024; Shan
et al., 2024) However, it requires continuous
operation by personnel to complete the measurement
work at monitoring points. Meanwhile, the cost of
total station equipment is relatively high. The
positioning accuracy of RTK is around 2 cm, which
to some extent has an impact on the monitoring
results. In addition, after collecting data through
sensors, some scholars conduct manual marking in
the way of image annotation. Although this method
has relatively high precision, its efficiency is low and
it requires post-processing for coordinate staking.
Some scholars also detect the center of the target
by means of corner detection (Liu, Y et al., 2024,
a
https://orcid.org/0009-0004-6775-2992
b
https://orcid.org/0000-0003-3067-448X
Shang et al., 2024; Bao et al., 2024). For example,
(Busca et al., 2024) developed a vision-based
displacement sensor system by utilizing pattern
matching, edge detection and digital image
techniques. Two different visual sensors were used to
track the high-contrast target fixed on the bridge and
measure the vertical displacement of the bridge.
Harris corner detection sets a predefined rectangular
window, moves it slightly in all directions in the
image, and identifies corners according to the gray
level changes of the image inside the window (Shang
et al., 2024; Xiang et al., 2010). SUSAN corner
detection adopts a nearly circular template and sets
the center point of the template as the core point (Lin
et al., 2010). A pixel point and a sufficient number of
different regional pixels around it are defined as
FAST corners (Ding et al., 2013).
For uncomplicated targets, this method can
quickly and accurately identify the center of the
target. However, when affected by the surrounding
220
Ran, D., Long, J., Wang, Z., Zhang, X., Guo and Q.
Real-Time Monitoring of Displacement of Machine Vision Bridge Based on YOLOV5-MLR Study.
DOI: 10.5220/0013628000004671
In Proceedings of the 7th International Conference on Environmental Science and Civil Engineering (ICESCE 2024), pages 220-227
ISBN: 978-989-758-764-1; ISSN: 3051-701X
Copyright © 2025 by Paper published under CC license (CC BY-NC-ND 4.0)
environment and the problems of the camera itself,
resulting in low-quality collected images or in the
case of targets with complex textures, using the
corner detection method will simultaneously obtain
multiple detection targets, and the accuracy will be
interfered to some extent. Moreover, manual
processing will still be required in the later stage.
In addition to corner detection, some scholars also
use tracking and target detection methods for
displacement detection. (Lee et al., 2012) proposed a
corner measurement system for large civil structures
based on computer vision. By utilizing image
processing technology, they tracked artificial targets
and calculated the rotation angles. (Hu et al., 2022)
used the computer vision-based method to identify
the displacements of multiple targets. At present,
deep learning methods are mostly adopted for target
recognition, such as the YOLO series of algorithms
for target detection (Zhou et al., 2023), which can
quickly identify the positions of targets and quickly
obtain the central coordinates of targets according to
the prior boxes. However, due to the influence of
factors such as the shooting angle and the target
angle, the coordinates of the target center are not
accurate. Therefore, based on the YOLOv5 target
detection algorithm, this paper adds the MLR
(Multiple Linear Regression) method to quickly and
accurately determine the central position of the target
according to the gray values of the image.
2 DISPLACEMENT MONITORING
BASED on the IMPROVED
YOLOV5-MLR ALGORITHM
2.1 The Principle of Displacement
Measurement in Computer Vision
Two-dimensional coordinate displacement
monitoring of the monitored object is carried out
through the means of computer vision. The
calculation is mainly based on several parameters
such as the distance from the camera to the monitored
object, the focal length of the camera, the image
resolution and the number of displacement pixels, as
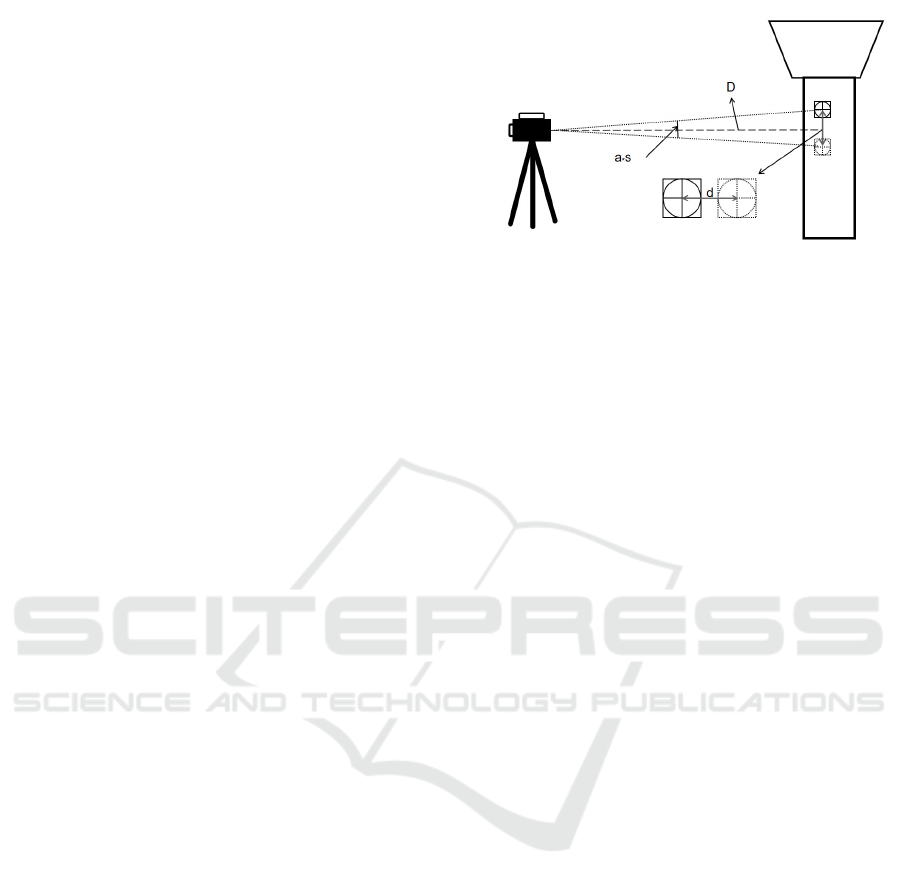
shown in the following Figure 1:
Figure 1: Schematic diagram of the target displacement
measurement with computer vision.
Among them, D represents the distance from the
camera to the target, a represents the pixel size of the
camera, s represents the number of pixels by which
the target has changed before and after displacement,
and the focal length f is a known value. According to
formula (1), the distance of the target before and after
displacement can be calculated.
d=D∗a∗s
f
⁄
(1)
During the entire calculation process, is a
variable that requires measurement and calculation.
Therefore, only by accurately obtaining the centers of
the targets before and after the change can the
displacement of the targets be calculated accurately.
When the value of increases, a single pixel also has
a relatively large impact on the accuracy of the
measurement data. Hence, it is necessary to adopt a
high-precision method for obtaining the centers of the
targets so as to ensure the accuracy of bridge
displacement monitoring.
2.2 Extraction of the Initial Coordinates of
Feature Points Based on YOLOV5
Affected by factors such as the environment, the
angle of the target, the deformation of the target, and
the bounding box (BOX), although the YOLOV5
algorithm cannot accurately identify the center point
of the target, it can obtain an approximate coordinate.
It can quickly calculate the center coordinate of a
target through the four corner points of the bounding
box. Therefore, the research in this paper uses the
YOLOV5 algorithm to identify the target and obtain
the initial coordinates.In the early stage, the
LabelImg software was used to label the targets so as
to obtain a model training sample library. Since the
environment has interference on target identification,
especially when monitoring bridges, the surrounding
white clouds may be misidentified. Therefore, the
Real-Time Monitoring of Displacement of Machine Vision Bridge Based on YOLOV5-MLR Study
221
targets used are not pure white-background
targets.Based on the sample library and labels, the
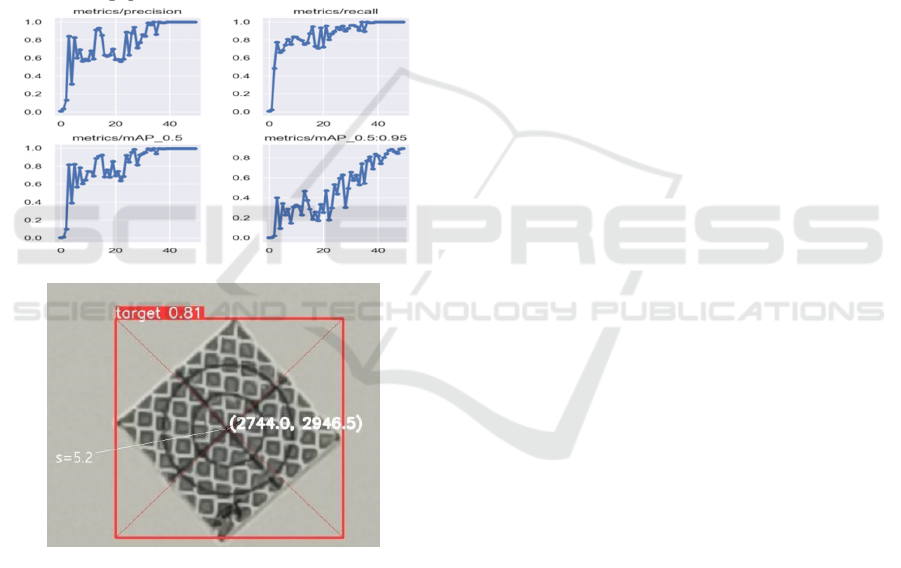
YOLOV5 algorithm was used for model training. As
it is a one-class model training and the characteristic
information of the targets is rather special, the
accuracy rate of the model training reaches 99%, as
shown in Figure 2(a).The calculation method for the
coordinates of the center point of the BOX is x
=
(x
+x
)/2, y
=(y
+y
)/2 ,Thus, the
coordinates of the center point of the target are
obtained. As shown in Figure 2(b), it can be seen
from Figure 2(b) that the center of the target can be
roughly identified by YOLOV5. However, there is
still a certain error compared with the actual center of
the target. The error is 5.2 pixels, which is also the
intersection recognition problem that needs to be
solved in the paper.
(a)Training of the target recognition model
(b) Recognition of the central coordinates of the target
Figure 2: Target training results and identification.
2.3 YOLOV5-MLR Improved Algorithm
As shown in Figure 2(b), due to the complexity of the
target image, which is not just in black and white, this
type of target can avoid the misidentification of the
target caused by the surrounding environment. Since
there are many other interfering backgrounds on the
target itself, multiple corner points will be detected
simultaneously when using the corner detection
algorithm, and the center of the target cannot be
accurately located. Therefore, the research in the
paper first employs the YOLOV5 algorithm to
conduct a rough identification of the center of the
target.Obtain the initial values of x
、y
and z
for
the target center.Among them, x
represents the
initial abscissa,y
represents the initial ordinate, and
z
represents the gray value. After obtaining the
initial coordinates, the extraction of the target center
can be carried out. The main process is as follows:
(1) Acquisition of the minimum grayscale value
within the region. Based on the initial
coordinates obtained by the YOLOV5 algorithm,
since the inner circle radius of the target is 9 mm,
in order to avoid retrieving the pixels on the
circle, during the retrieval process, the pixels
within the adjacent 5 mm range are retrieved.
The number of pixels is represented by q, and
the specific formula is as follows.
q=d∗f D∗a
⁄
(2)
Among them, D represents the distance from the
camera to the target, a stands for the size of a pixel,
and f represents the focal length. d refers to the
retrieval radius, and its value is 5 mm.
The value of q can be calculated through Formula
(2). The magnitude of q is determined by the distance
D and the focal length f. In addition, on the basis of
the initial coordinates of the target, the target searches
for the minimum gray value within q adjacent pixels.
Usually, this minimum value is mainly distributed on
the two intersection lines of the target.
(2) Acquisition of the coordinates of the pixels that
meet the requirements, including the values,
where represents the horizontal and vertical
coordinates of the pixel in the image, and the
value represents the grayscale value of the pixel.
According to the grayscale information of the
initial coordinates, extract all the points within q
pixels around the point and with a value less
than min(z
)+30, as shown in the following
formula.
x
−q<x<x
+q
y
−q<
y
<
y
+q
zmin(z
)+30
(3)
The research in the thesis processes the images
through Python programs to obtain all the pixels that
meet the conditions and whose values are less than
70. The search results are shown in the following
figure.
ICESCE 2024 - The International Conference on Environmental Science and Civil Engineering
222
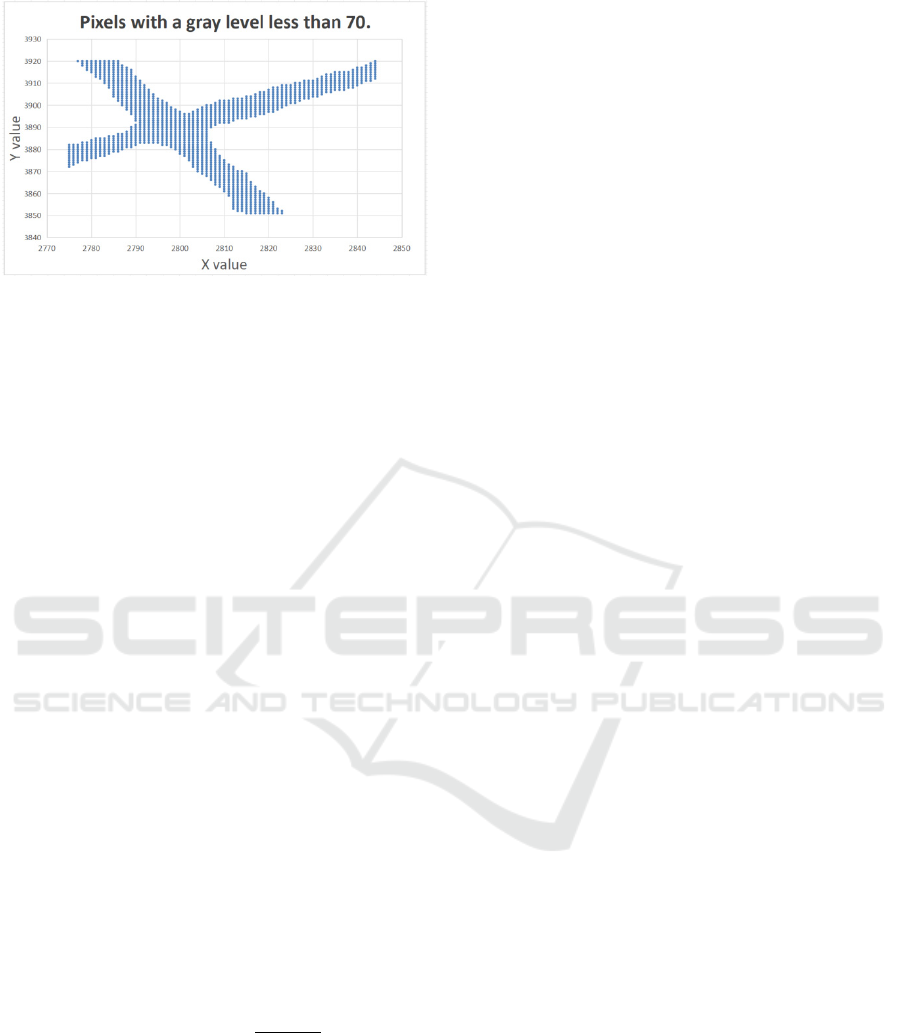
Figure 3: Points with gray values less than 70 within the
area.
(3) Acquisition of the initial intersection line
equation: No matter at what angle the cross
intersection line at the center of the target is
located, the equations of the two intersecting
straight lines can be extracted.
First, randomly select two points ( 𝑥
,𝑦
) and
( 𝑥
,𝑦
) from the point library that satisfies the
condition of being less than min(z
) +
30.Meanwhile, it is required that the distance
between the two points should be greater than 2q
pixel values, where q is a positive integer. If the
distance from the camera to the target decreases or
the camera resolution increases, the value of q will
increase correspondingly. On the contrary, if the
distance from the camera to the target increases or the
resolution decreases, the value of q will decrease
accordingly. Therefore, this value is adjusted
according to the actual visual measurement. This can
ensure that the constructed linear equations are
distributed as close to the intersection lines of the
target as possible. Meanwhile, it can avoid
constructing linear equations with adjacent points,
which would otherwise increase the amount of
calculation. Therefore, setting a threshold for the
distance between two points can improve the
calculation efficiency of the target linear equations.
A
=(
y
−
y
)(x
−x
)
⁄
C
=
y
−A
x
i,j=1......n
d
=
|
A
x
+B
y
+C
|
/
A
+B
k=
1......n
(4)
As shown in Equation (4), in the equation,A
represents the slope, C
represents the intercept, B
=
1, and d
is the distance from any point in the point
library where z is less than min(z
)+30 to the
generated straight line. Meanwhile, it is required that
the number of pixels satisfying d
< 1 should be
greater than 4q, where q is a positive integer.
Therefore, two straight line equations of relatively
high quality can be obtained through this method.
A
x+B
y
+C
=0
A
x+B
y
+C
=0
(5)
As shown in Equation (5), B
and B
are
constants with a value of 1.A
and A
are slopes.C
and C
are intercepts. And the slopes A
and A
a r e
two values with opposite signs.As shown in Figure 3,
since the two intersecting straight lines are
perpendicular to each other, the signs of the slopes of
the equations of the two straight lines must be
different. From this, two straight lines that are
basically close to the target straight lines can be
obtained.
(4) Inspection of the equations of the two
intersection lines and acquisition of the optimal
straight lines. The intersection line equations
obtained through step (3) are relatively close to
the target intersection line equations. The error
of the intersection point pixels obtained through
these intersection line equations is within the
range of 2 - 5 pixels, but there still exists a
certain degree of error.According to the
displacement calculation formula, d=(D∗a∗
s)/f,Among them, "a" represents the pixel size,
"D" stands for the distance from the camera to
the target, "s" represents the number of pixels,
and "f" represents the focal length. The camera
used in the research of the paper has a fixed focal
length of 12 mm, and a 2x zoom with a focal
length of 24 mm. The pixel size is 2 μm, and the
resolution is 48 million pixels. When the
distance is 1 m, the precision is 0.08 mm, and
when the distance is 10 m, the precision is 0.8
mm. When the error is 5 pixels, the maximum
error is 0.4 mm at a distance of 1 m, and the
maximum error is 4 mm at a distance of 10 m.
Generally, the error requirement for bridge and
building monitoring is at the millimeter level. If
the error is controlled within 2 pixels, the
maximum error is 0.16 mm at a distance of 1 m,
and the maximum error is 1.6 mm at a distance
of 10 m, which meets the monitoring
requirements. When the distance is relatively
close, the intersection coordinates obtained from
the initial intersection line equation are
sufficient to meet the requirements of bridge
monitoring. As the distance increases, the error
gradually increases. To further improve the
precision, inspection and optimal straight line
selection are carried out on the basis of step (3).
Through step (3), n pairs of straight line equations
that meet the requirements can be obtained.
Real-Time Monitoring of Displacement of Machine Vision Bridge Based on YOLOV5-MLR Study
223
Therefore, in order to further reduce the error in the
calculation of the intersection points of the target, it
is necessary to select the two straight lines with the
highest precision from the n pairs of intersection line
equations. Thus, after obtaining n pairs of straight
line equations that meet the requirements, the target
straight lines are selected by the substitution method.
A
𝑥
+C
=𝑦
|
𝑦
− 𝑦
|
<=1
𝑥
+C
=𝑦
𝑦
− 𝑦
<=1
(6)
Among them,𝑥
、𝑦
, 𝑥
and 𝑦
are the points in
the point library where z is less than <min(z
)+
30.In the inspection process, 4q points that meet the
condition of equation (6) are required, where q is a
positive integer. Two target straight lines are
determined by this method.
(5) Target center calculation. Conduct intersection
calculation based on 𝐴
, C
, 𝐴
a n d C
obtained
in step (4). This intersection is the target center.
Here, B
=1 and B
=1. The coordinates of the
target center are shown in the following formula:
x
=(B
C
−B
C
)/(A
B
−A
B
)
y
=(A
C
−A
C
)/(A
B
−A
B
)
(7)
3 COMPARATIVE ANALYSIS on
the APPLICATION of the
IMPROVED YOLOV5-MLR
ALGORITHM
3.1 Error Analysis of the Improved YOLOV5-
MLR Algorithm
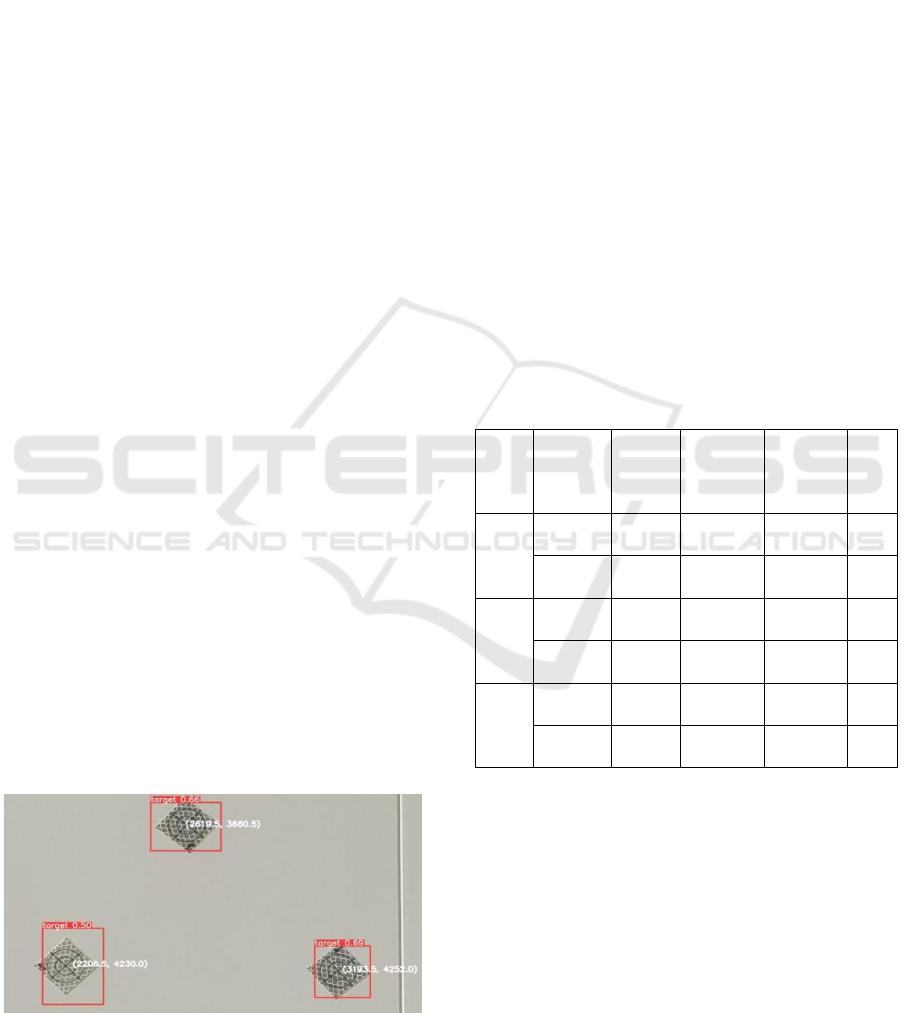
In terms of error analysis, the research in the thesis
conducts error analysis from two aspects. For the first
aspect, a comparative analysis is carried out
longitudinally for a single target. During the analysis
process, three targets at different distances from the
camera are selected, as shown in Figure 4.
Figure 4: YOLOV5 Target center coordinates acquisition.
The equations of n pairs of intersection lines can
be obtained through certain steps. The following are
the slope and intercept values of any pair of equations
among the three targets. Firstly, use YOLOV5 to
obtain the coordinates of the targets. Secondly, use
the equations of the intersection lines to obtain the
initial coordinates of the intersection
points.Respectively for 𝐴
=1.06,C
=
21915 , 𝐴
=−1,C
= 6407.0 , 𝐴
=1,C
=
1030 , 𝐴
= −1.14, C
= 6652.14 , 𝐴
=
−0.94, C
= 7228,𝐴
=1.1,C
= 753.
Finally, substitute the known coordinates for
checking and determine the optimal intersection line
equation and coordinates.Its slope and intercept are
𝐴
= 1.085714, C
= 1861.342857, 𝐴
=
−1.028571, C
= 6470.714285, 𝐴
=
−1.088235, C
= 6509.411764, 𝐴
=
0.939394, C
= 1189.939394, 𝐴
=
−0.787234, C
= 6750.148936, 𝐴
=
1.11764705, C
= 698 respectively.
The coordinates of YOLOV5, the initial
coordinates, the optimal coordinates and the real
coordinates are shown in Table 1.
Table 1: Individual target coordinates at different stages.
Poin
t
num
b
e
r
Coordi
nates
YOL
OV5
Initial
value
Optimal
value
Tru
e
val
ue.
1
x 2206
2180.58
2524
2180.10
8844
218
0
y 4230
4226.41
7476
4228.31
7551
422
8
2
x 2620
2627.16
8224
2623.49
4007
262
3
y 3660
3657.16
8224
3654.43
3764
365
4
3
x 3194
3174.01
9608
3177.17
9455
317
7
y 4252
4244.42
1569
4248.96
5245
424
9
For the three targets, through longitudinal analysis
of each individual target, it was found that during
the process of obtaining the central coordinates of
the three targets, the errors of the iterative
coordinates were all the smallest, and the errors of
the optimal coordinates tended to be around 0.
The
error results are shown in Figure 5.
ICESCE 2024 - The International Conference on Environmental Science and Civil Engineering
224
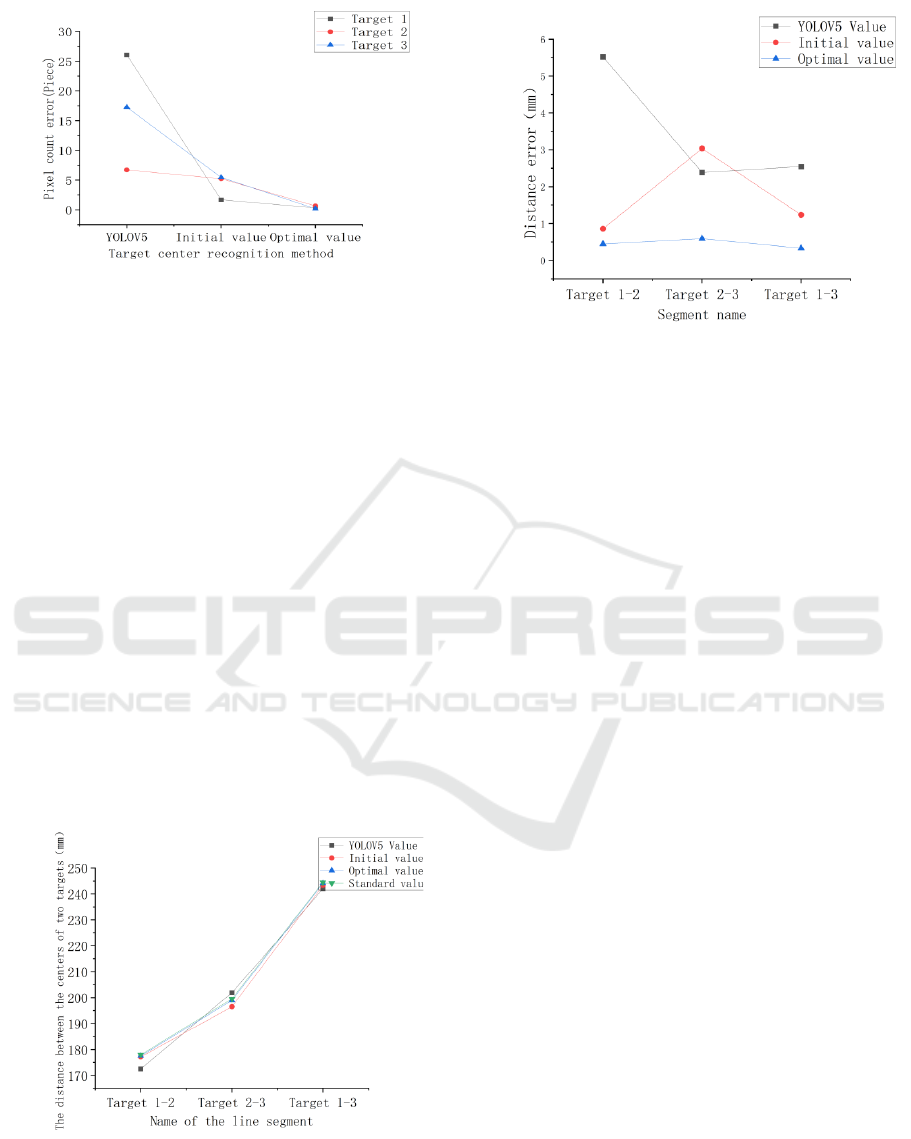
Figure 5: Error statistics plots for the different methods.
In addition to the longitudinal comparison, the
thesis research also conducts a lateral comparison
based on the actual distances. As shown in the Figure
6 below, it presents the distances between two targets
calculated by different methods. Among them, the
distance between the camera and the target is 1,469
mm. Through analysis, it was found that the
deviations between the distances between the two
targets obtained by YOLOV5 and the true values
were relatively large. And the initial values of the
distances between the two targets obtained through
the intersection line equation were relatively close to
the true values, but there were still errors and the
results were unstable, which was caused by
randomness. However, the distances between the two
targets calculated according to the optimal linear
equation were close to the true values, with errors
within 1 mm. Through practical analysis, it was
discovered that using the improved YOLOV5-MLR
algorithm for target displacement monitoring has a
relatively good effect, with high precision and low
errors.
Figure 6: Statistical map of the actual distance between the
two targets.
3.2 Application of the YOLOV5-MLR
Improved Algorithm in Target
Displacement Monitoring
This paper conducts a practical demonstration of
bridge displacement monitoring with the on-campus
bridge training base as the application scenario. The
selected bridge is the Kunpeng Bridge on campus,
which is a rather distinctive bridge and a training
bridge integrating monitoring and detection.
Therefore, applying the target-based visual
displacement monitoring technology to this bridge
has relatively high teaching value. In this practical
application, the target is attached to the bridge pier
for monitoring the lateral and longitudinal
displacements of the pier. Since the camera cannot
achieve high-power zoom and to ensure a relatively
high actual resolution of the target, the monitoring
distance of this bridge is 2666 mm, the camera focal
length is 24 mm, the pixel size is [not provided in the
original text], and the accuracy is 0.22 mm. As shown
in the following Figure 7, the pixel coordinates of the
target measured by the YOLOV5 - MLR improved
algorithm are (2130.1, 5968.4), and the actual
coordinates in the image plane coordinate system are
(473.22, 1325.89) with the unit of mm.
Real-Time Monitoring of Displacement of Machine Vision Bridge Based on YOLOV5-MLR Study
225
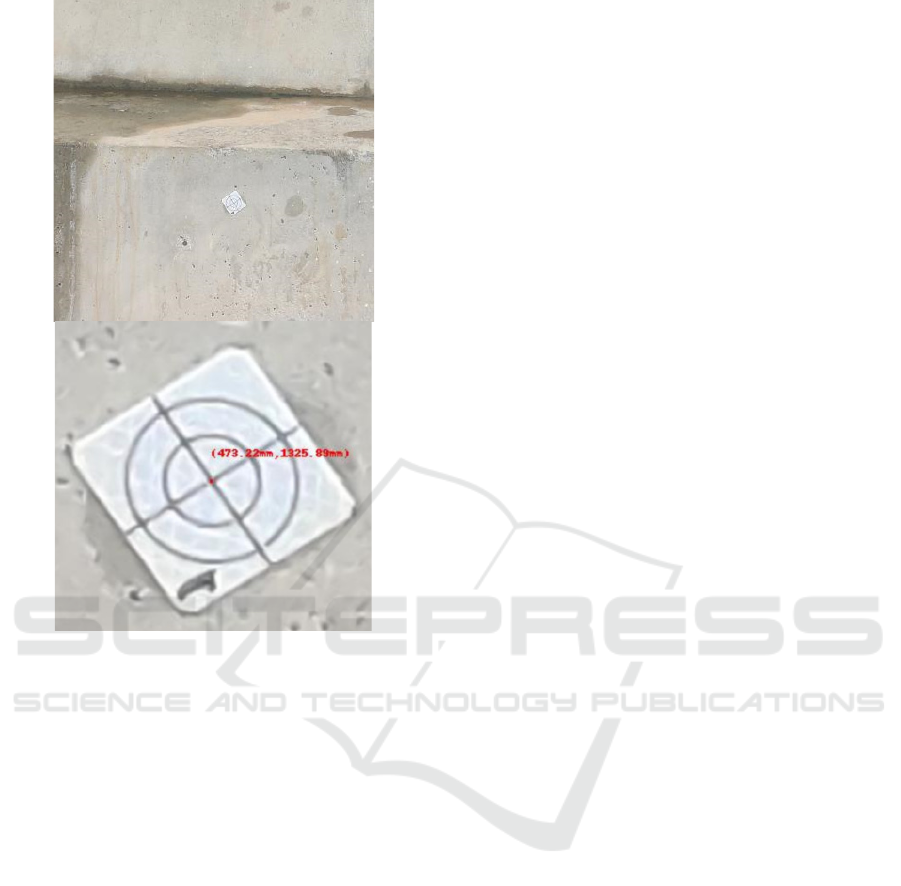
Figure 7: Pixel coordinates and image plane coordinates.
4 CONCLUSION
Bridge safety is a social focus and hot topic.
Therefore, bridges should be regularly monitored and
early-warning systems should be in place to ensure
their normal operation. Existing monitoring methods
mainly rely on coordinate measurement using
measuring equipment. However, the research in this
paper conducts bridge displacement monitoring
through computer vision. Through research, it has
been found that the improved YOLOV5-MLR
algorithm has the following advantages:
(1) In terms of target selection, targets with
relatively complex textures are chosen. The
main advantage of complex-textured targets lies
in the fact that they can be well distinguished
from the surrounding environment. Especially
when there are background images such as
clouds in the detection environment, traditional
black-and-white targets are prone to recognition
errors during the identification process.
Therefore, choosing relatively complex targets
helps to improve the accuracy of target detection.
(2) Compared with previous corner detection
algorithms, the improved YOLOV5-MLR
algorithm takes advantage of the YOLOV5
algorithm. YOLOV5 can quickly and
preliminarily locate the center of the target, and
has a higher detection efficiency. Moreover, as
the target texture becomes complex while
ensuring recognition accuracy, there are many
corner points in complex-textured targets. As a
result, using corner detection algorithms will
return multiple results, and the detection results
are not unique. However, the improved
YOLOV5-MLR algorithm can identify the
center of the target with a unique result, which
is more helpful for quickly extracting the center
point of the target.
(3) In terms of the recognition accuracy of the target
center, it is more precise than both the YOLOV5
and corner detection algorithms. Especially
when the target image is affected by factors such
as illumination and distance, the results obtained
by corner detection are not the center of the
target, with an error of several pixels. When the
improved YOLOV5-MLR algorithm is used for
target center detection, the error can be
controlled within the size of one pixel. Its
accuracy is more conducive to bridge
displacement monitoring and meets the
requirements of displacement monitoring
specifications. In addition, to improve the
adaptability of target center detection, in the
future, high-resolution zoom cameras can be
used for long-distance target center detection, so
as to achieve long-distance bridge displacement
monitoring.
ACKNOWLEDGMENTS
This work had been supported by Basic Research
Project of Guizhou Provincial Department of Science
and Technology, China (Grant No. ZK [2021]-290);
Science and Technology Plan Project of Guiyang
City, China (Grant No. [2024]-1-7); Soft Science
Research Project of Qingzhen City, China (Grant No.
[2023]04); Science and Technology Project of
Guizhou Provincial Department of Transport, China
(Grant No. 2023-123-036); Guizhou Province
Science and Technology Plan Project, China (Grant
No. GZSTCPT-CXTD[2021]008); Funding for
scientific research of Guizhou Communications
Polytechnic University (Grant No. KYQD2022006);
Key Laboratory of High Performance Restoration
Materials for Higher Education Construction Projects
in Guizhou Province, China (Grant No. [2023]030).
ICESCE 2024 - The International Conference on Environmental Science and Civil Engineering
226

REFERENCES
Liu, L., Luo, S., 2024. Data processing in the application of
bridge deflection deformation [J]. Science and
Technology Innovation, (08): 91-94.
Liao, X., He, Q., Luo, Q., 2024. Application of measuring
robot in bridge static load test [J]. Fujian Building
Materials, (02): 30-32.
Shan, J., Qi, L., 2024. Bridge structural displacement
reconstruction method based on the adaptive Kalman
filter GNSS-RTK fused with acceleration data [J].
Journal of Test Technology, 38(03): 221-229.
Liu, Y., Li, Y., 2024. Adaptive FAST corner point
detection optimization algorithm based on gray scale
mean [J]. Electro-optic and Control, 31(02): 65-71+91.
Shang, M., Wang, K., 2024. Image registration algorithm
based on multiscale Harris angular point detection[J].
Electro-optic and control, 31(01): 28-32.
Bao, J., Sun, D., Huang, J., et al., 2024. FAST detection
algorithm based on adaptive threshold [J/OL]. Journal
of Shanghai Jiao Tong University, 1-25 [2024-07-30].
https://doi.org/10.16183/j.cnki.jsjtu.2023.276.
Busca, G., Cigada, A., Mazzoleni, P., et al., 2014. Vibration
Monitoring of Multiple Bridge Points by Means of a
Unique Vision-Based Measuring System [J].
Experimental Mechanics, 54(2):255-271.
Shang, S., Cao, J., Wang, M., et al., 2024. Research on
corner detection algorithms in machine vision [J].
Computer Measurement and Control, 32(1): 217-225.
Xiang, Y., 2010. Research on image registration
technology based on point features[D]. Shengyang:
Northeastem University.
Lin, P., Li, L., Li, C., 2010. An improved fast SUSAN
corner detection algorithm[J]. Computer and
Modernization, 1(2): 66-68.
Ding, Y., Wang, J., Qiu, Y., et al., 2013. FAST feature
point extraction algorithm based on adaptive
threshold[J]. Command and Controll&Simulation,
35(2): 47-53.
Lee, J.J., Ho, H.N., Lee, J.H., 2012. A Vision-Based
Dynamic Rotational AngleMeasurement System for
Large Civil Structures [J]. Sensors,MolecularDiversity
Preservation International, 12(6): 7326-7336.
Hu, J., Zhu, Q., Zhang, Q., 2022. Global Vibration Comfort
Evaluation of Footbridges Based on Computer
Vision[J]. Sensors, 22(18): 7077.
Zhou, X., Wang, X., Liu, Y., et al., 2023. Method of
vertical displacement measurement based on the
YOLOv5 target detection model and vision [J].
Geospatial Information, 21(12): 25-28.
Real-Time Monitoring of Displacement of Machine Vision Bridge Based on YOLOV5-MLR Study
227
