
Analysis of Soil Pressure Distribution and Fracture Surface Inside
Mechanically Stabilized Earth (MSE) Walls of High-Speed Railways
Guangpeng Liu
1,2,3,* a
, Nan Zhang
2,3
, Guoliang Shi
2,3
, Weiming Huang
2,3
and Hong Xiao
4
1
School of Civil Engineering, Sun Yat-sen University, Guangzhou 510275, China
2
Guangzhou Construction Group Co., Ltd, Guangzhou 510030, China
3
Guangzhou Municipal Group Design Institute Co., Ltd, Guangzhou 510060, China
4
School of Civil Engineering, Beijing Jiaotong University, Beijing 100044, China
Keywords: MSE Wall, Model Test, Soil Pressure, High-Speed Railway, Fracture Surface.
Abstract: Due to the extremely strict settlement requirements for the high-speed railways, the MSE wall, as an
environmentally friendly structure, the variation of the soil pressure and the fracture surface are related to the
accurate design of the wall. Three sets of model tests were designed based on the similar theory, and the soil
pressure changes in the MSE wall and the retaining wall panel under different loads were studied respectively.
At the same time, the high-speed train-track-MSE wall model was conducted to analyze the dynamic loading
effect, the distribution of soil pressure and the changes of fracture surface. The result shows that: increasing
the layers of ribs and increasing the length of ribs will reduce the soil pressure. Under static load, the soil
pressure inside the MSE wall increases linearly along the wall height, while under the train load, the soil
pressure increases linearly in the stable area and increases non-linearly in the active area. In the designing,
the fracture surface of the MSE wall is considered to be a fixed value. However, if the failure of the ribs in
the range of 0.15H~0.25H at the bottom of the wall occurs, the position of the fracture surface will move
upward along the wall. The guidelines suggest when designing the high-speed rail MSE walls, 0.15H~0.25H
range should be strengthened.
1 INTRODUCTION
MSE wall is composed of reinforcement ribs, wall
panels, and connecting parts. Due to its outstanding
advantages such as less land occupation, low cost,
and easy construction, it has been widely used in
railway infrastructure.
Many scholars have also conducted a large
amount of theoretical and experimental research. Jean
et al. (Jiang et al., 2016; Noike et al., 2004; Jean et al.,
2015; Alain et al., 2017) combined full-scale model
tests with finite element simulation calculations to
simulate train loads using harmonic loads, and
calculated the mechanical characteristics of MSE
walls. Fei et al. (2018) used a combination of
centrifugal testing and finite element strength
reduction method to study the fracture surface forms
of MSE walls with different step forms. Ehsan et al.
(2018) regarded the MSE wall as a two-phase
medium material and calculated the form of the
a
https://orcid.org/0000-0002-3711-7902
fracture surface. Mohammad et al. (2018) used a
combination of experimental and numerical
simulation methods to study the deformation and soil
pressure changes of MSE walls under different
external loads.
Xiao et al. (2021) monitored the horizontal
displacement, soil pressure, and potential sliding
surface of the wall through large-scale indoor model
tests of a two-step MSE wall, and analyzed the
evolution law of the stepped MSE wall fracture
surface. Wang et al. (2023) conducted indoor model
tests to analyze the changes in mechanical behavior
of MSE walls, such as settlement, horizontal
displacement of panels, lateral soil pressure
coefficient, and grid strain. Ren et al. (2021)
conducted indoor model tests on MSE walls under
horizontal static dynamic loads, exploring the
deformation, horizontal soil pressure, reinforcement
strain, and potential fracture surface of the retaining
walls. Xu et al. (2023) used model calculations to
Liu, G., Zhang, N., Shi, G., Huang, W., Xiao and H.
Analysis of Soil Pressure Distribution and Fracture Surface Inside Mechanically Stabilized Earth (MSE) Walls of High-Speed Railways.
DOI: 10.5220/0013626300004671
In Proceedings of the 7th International Conference on Environmental Science and Civil Engineering (ICESCE 2024), pages 173-182
ISBN: 978-989-758-764-1; ISSN: 3051-701X
Copyright © 2025 by Paper published under CC license (CC BY-NC-ND 4.0)
173

study the variation law of the bearing capacity of
retaining walls under strip loads. Yang et al. (2021)
analyzed the evolution law of vertical stress, geogrid
strain, and settlement of the foundation and wall
during construction and after construction through
on-site in-situ tests of railway retaining walls.
From the above research, it can be seen that most
scholars currently focus on static load testing and
theoretical research, while some scholars mainly use
harmonic loads to replace train loads. However, there
is no specific design for MSE walls for high-speed
railways in the existing railway design rules. In order
to further study the soil pressure, fracture surface
changes, and stability characteristics of MSE walls
for high-speed railways under static and dynamic
loads, a model test of the retaining wall was first
carried out. Then, a dynamic coupling model of the
MSE wall for high-speed railways was established
based on finite element analysis. The changes in soil
pressure and reinforcement stress of the retaining wall
under vehicle loads were calculated. Based on the
failure of reinforcement materials, the change law of
the fracture surface inside the retaining wall was
calculated. Relevant research can provide data
support for the accurate designing of MSE walls for
high-speed railways in the future.
2 MODEL TEST
2.1 Experimental
The experiment in this article is based on an intercity
railway MSE wall. The MSE wall has a height of
7.8m, and the wall panels are made of C30 concrete
with a size of
0.5 0.3 0.3mmm××
. The geogrid is
unidirectional made of high-density polyethylene
material, whose length is
8.0 ~ 10.5m .
2.2 Model Similarity Relationship
The similarity theorem (Du et al., 2018; TB 10621-
2014) was used to calculate the model geometric
similarity, and the geometric similarity constant
=10
l
C
, strain similarity constant
1/10C
ε
=
, soil
density similarity ratio
1C
ρ
=
, soil elastic modulus
similarity
1
E
C =
, and tensile modulus similarity
constant of the reinforcement
=10
El
C
. According to
the similarity
π
law, the similarity relationship of
the other parameters is calculated as follows: stress
similarity ratio
1
l
CCC
σγ
==
, bulk density
similarity ratio
1/10C
γ
=
, and Poisson's ratio
similarity
=1C
μ
.
2.3 Similar Materials
The model experiment takes sand as the filler, with an
optimal moisture content 11%, compaction degree
0.94, and dry density 1.85g/cm
3
. When the optimal
moisture content is reached, the density of sand is
2.04g/cm
3
.
The wall adopts modular facing panels,
considering the convenience of production and
assembly. In the experiment, wood panels can meet
the relevant requirements.
This model experiment uses a unidirectional
tensile geogrid as the ribs, with a nominal tensile
strength ≥ 25kN/m. Other physical and mechanical
properties are shown in Table 1.
2.4 Test Design
Three sides of the model box are made of 1.5cm thick
tempered glass, and the wall is composed of a wooden
board with dimensions
533cm cm cm××
(length
5cm width 3cm height 3cm) connected as a whole
using steels. Set up horizontal barriers at the bottom
of the wall to simulate the limiting effect of the
foundation on the wall bottom.
The size of the model box is determined by the
geometric similarity relationship (length x width x
height), with a filling height of 0.78m. It is filled in
layers and compacted.
Set up a plate in the middle of the wall and use a
pressure sensor to control the jack to accurately
loading. According to the railway design
specifications, the maximum designing load on the
top of the track foundation is 54.1kPa. At the same
time, in order to study the variation of the wall under
different loads, step-by-step loading is adopted.
When using a jack for loading in the experiment,
the magnitude of the applied load is determined
through a pressure sensor, and the magnitude and
variation of the loading force are recorded and
controlled through an IMC data acquisition
instrument. The method of burying soil pressure
boxes inside the wall is adopted to measure the soil
pressure. The test site is shown in Figure 1.
ICESCE 2024 - The International Conference on Environmental Science and Civil Engineering
174
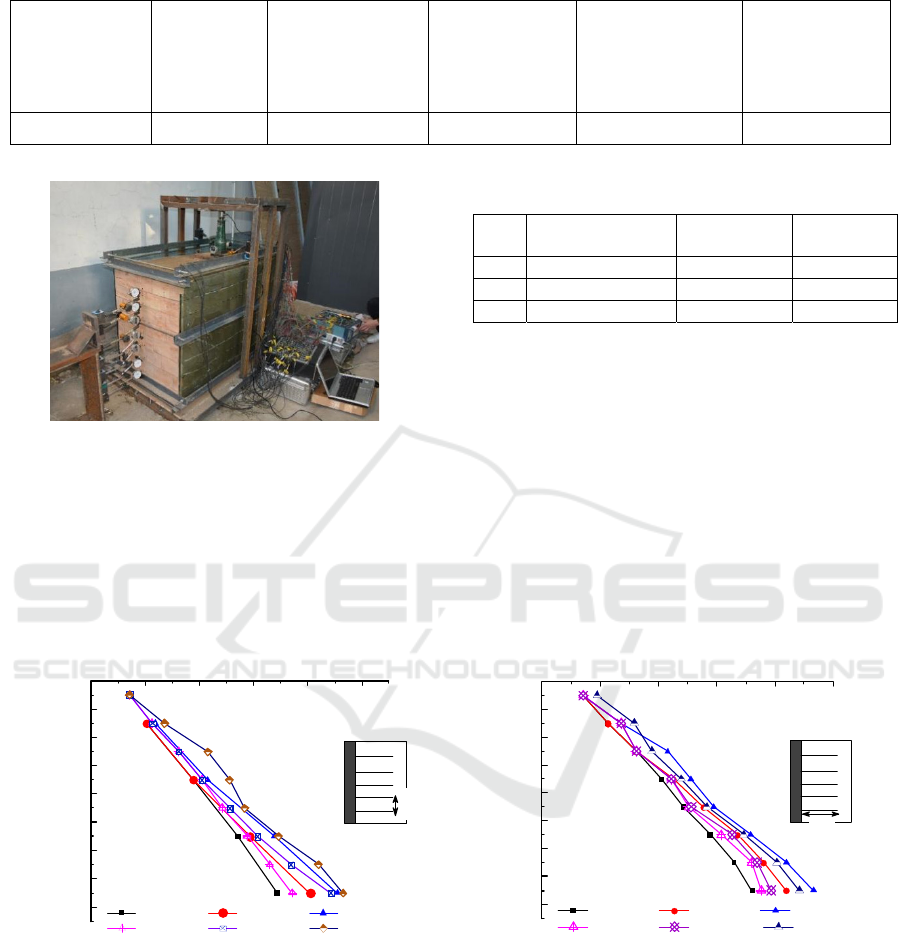
Table 1: Geogrid physical parameters.
nominal tensile
strength (kN/m)
elongation at
yield (%)
Tensile force at
2% elongation
(kN/m)
Tensile strength
at 5% elongation
(kN/m)
The spacing
between individual
tendons(mm)
Thickness of
single rib (mm)
≥25 ≤10 ≥7 ≥14 30 1
Figure 1: Test model.
Due to the fact that the spacing and length of ribs
are the main factors in the design of MSE walls (Yang,
2015), three sets of different spacing and length of
ribs were tested under different cases. The spacing
and length of ribs in each set of tests are shown in
Table 2.
Table 2: Test case.
case
Number of ribs
layers
ribs spacing
/
m
ribs length
/
m
1 7 0.1 0.8
2 5 0.15 0.8
3 5 0.15 1
3 RESULTS AND DISCUSSION
3.1 Soil Pressure on Retaining Wall
Under static load, tests were conducted on the
horizontal soil pressure of MSE walls at different
heights. The comparison of horizontal soil pressure
on the walls with different ribs layers is shown in
Figure 2(a), and the comparison of soil pressure with
different ribs lengths is shown in Figure 2(b).
0.51.01.52.02.5
0.8
0.7
0.6
0.5
0.4
0.3
0.2
0.1
0.0
Distance from the retaining wall(m)
Wall soil pressure(kPa)
0.1m-10kPa 0.1m-30kPa 0.1m-54.1kPa
0.15m-10kPa 0.15m-30kPa 0.15m-54.1kPa
0.8
0.0
0.10m
0.15m
wall soil
0.5 1.0 1.5 2.0 2.5
0.8
0.7
0.6
0.5
0.4
0.3
0.2
0.1
0.0
Distance from the retaining wall(m)
Soil pressure(kPa)
0.8m-10kPa 0.8m-30kPa 0.8m-54.1kPa
1m-10kPa 1m-30kPa 1m-54.1kPa
0.8
0.0
0.8m
1.0m
wall soil
(a) Comparison of spacing between different reinforcement
materials
(b) Comparison of different reinforcement lengths
Figure 2: Distribution of soil pressure with burial depth under static load.
Overall, the horizontal soil pressure on the wall
shows a non-linear and gradually increasing trend in
the vertical direction. From the different spacing of
ribs in Figure 2(a), it can be seen that the soil pressure
in case 2 is higher than that in case 1, indicating that
increasing the number of ribs layers and reducing the
vertical spacing of ribs can effectively reduce the
distribution of soil pressure.
From Figure 2(b), it can be seen that overall, the
soil pressure at the bottom under case 2 is higher than
that under case 3, indicating that increasing the length
of the ribs can effectively reduce the distribution of
soil pressure.
Analysis of Soil Pressure Distribution and Fracture Surface Inside Mechanically Stabilized Earth (MSE) Walls of High-Speed Railways
175
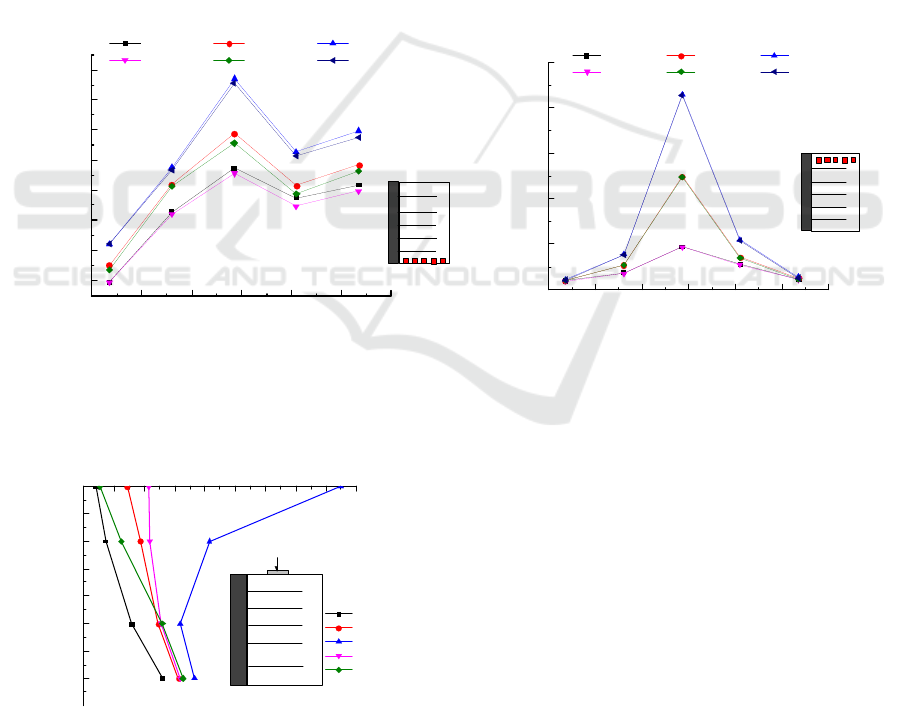
3.2 Vertical Soil Pressure inside the
MSE Wall
In the case where the number of ribs layers is the same
and all ribs are buried in the same position, the
influence of different ribs lengths on the vertical soil
pressure inside the was studied. The comparison of
experimental data for conditions 2 and 3 is shown in
Figure 3.
Under static load, the vertical soil pressure inside
the wall exhibits a non-linear distribution along the
length of the ribs, with the maximum soil pressure
occurring near the loading position and smaller at
ends. This is mainly because near the wall, due to the
horizontal displacement of the wall, soil pressure near
the wall is released. The soil on the side far away from
the load position is less affected by external loads.
From Figure 3(a), it can be seen that the length of
the ribs has a significant impact on the soil pressure
at the bottom of the wall. The soil pressure in case 2
is significantly higher than that in case 3. The ribs
increased from 0.8m to 1m, and the maximum soil
pressure at the bottom decreased by an average of
0.25KPa, about 1.4%. In Figure 3(b), the maximum
soil pressure at the bottom end decreased by an
average of 0.17 KPa, approximately 1.1%. In Figure
3 the maximum soil pressure at the bottom decreased
by an average of 0.08KPa, approximately 0.5%. The
length of the ribs in Figure 3 has little effect on the
soil pressure value at the top of the wall. The
influence of the length of the ribs on the soil pressure
inside the wall gradually weakens from the bottom to
the top.
To analyze the variation of soil pressure along the
height of the wall, the data of soil pressure along the
height of the wall at distances of 0.07m, 0.32m,
0.57m, 0.82m, and 1.07m are shown in Figure 4.
0.00.20.40.60.81.01.2
12
13
14
15
16
17
18
19
Vertical soil pressure(kPa)
Distance from the retaining wall(m)
0.8m-10kPa 0.8m-30kPa 0.8m-54.1kPa
1m-10kPa 1m-30kPa 1m-54.1kPa
wall
0.0 1.2
soil
0.0 0.2 0.4 0.6 0.8 1.0 1.2
10
20
30
40
50
Vertical soil pressure(kPa)
Distance from the retaining wall(m)
0.8m-10kPa 0.8m-30kPa 0.8m-54.1kPa
1m-10kPa 1m-30kPa 1m-54.1kPa
wall
0.0
1.2
soil
(a) Vertical soil pressure on the first layer (at the bottom of
the retainin
g
wall
)
(b) Vertical soil pressure on the fourth layer at the top of
the wall
Figure 3: Distribution of vertical soil pressure along the reinforcement under static load.
5 10 15202530354045
0.7
0.6
0.5
0.4
0.3
0.2
0.1
0.0
1.070.57
0.7 8
load
Wall height(m)
Vertical soil pressure(kPa)
0. 07m
0. 32m
0. 57m
0. 82m
1. 07m
wall
0
Figure 4: Distribution of vertical soil pressure inside the
retaining wall under static load.
From the Figure 4, it can be concluded that except
for the 0.57m below the loading position, the soil
pressure inside the wall at all other positions
increases linearly with the height, which is basically
consistent with the law described by Coulomb's soil
pressure. At a height of 0.57m, the soil pressure inside
the wall shows a non-linear trend. This is mainly due
to the energy dissipation of the soil below the wall
under external forces, which continuously decreases
along the depth of the wall. At the same time, there is
a certain increasing trend at the bottom of the wall,
which is because the bottom of the wall is outside the
range of external load influence.
ICESCE 2024 - The International Conference on Environmental Science and Civil Engineering
176
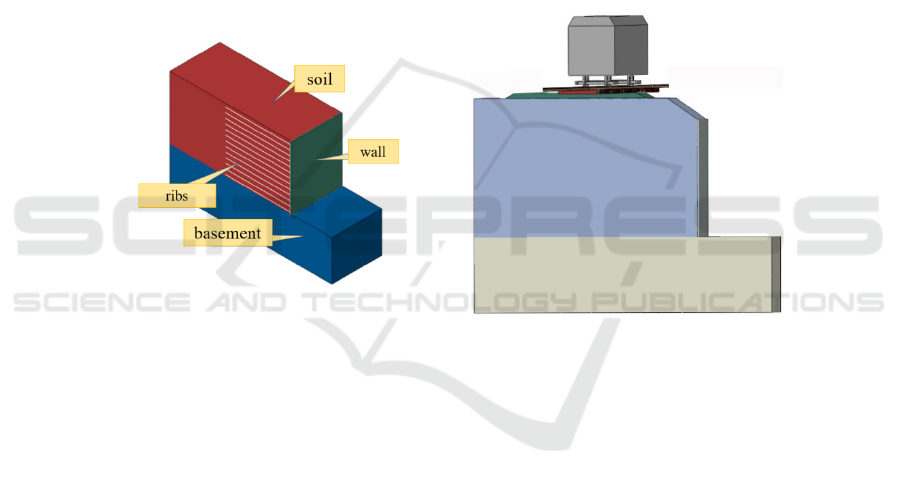
4 NUMERICAL SIMULATION
4.1 Modeling
The subgrade in the model adopts the Mohr Coulomb
constitutive model, and the embedded contact
relationship between the ribs and the soil is adopted.
The model (length x width x height) is 12, 6, 7.8m.
The soil and ribs parameters in the model are based
on the actual material of the intercity railway. The
model established using the finite element software is
shown in Figure 5 (a).
By comparing the static model with the
experimental results, the rationality of the material
and contact relationship can be verified. Furthermore,
the dynamic model can be used to calculate the soil
pressure during high-speed train operation.
In the dynamic model, relevant parameters such
as subgrade and foundation are selected according to
the actual parameters in relevant literature (Zhai,
2007), while parameters related to dynamic models
such as tracks and trains are selected according to the
provisions in literature (TB 10025-2019; Li, et al.
2020). Hertz contact relationship is used between
vehicle and tracks.
In the model, fixed boundary conditions are set at
the bottom of the wall, and displacement boundaries
are applied in the longitudinal and transverse
directions of the model. A binding contact
relationship is adopted between the track bed and the
subgrade, and displacement boundary conditions are
also set at the longitudinal ends of the rail. The three-
dimensional coupling system of vehicle track MSE
wall subgrade is shown in Figure 5(b).
(
a
)
Static calculation model for MSE walls
(
b)
D
y
namic model of vehicle track MSE wall
Figure 5: Dynamic calculation model of MSE wall for high-speed railway.
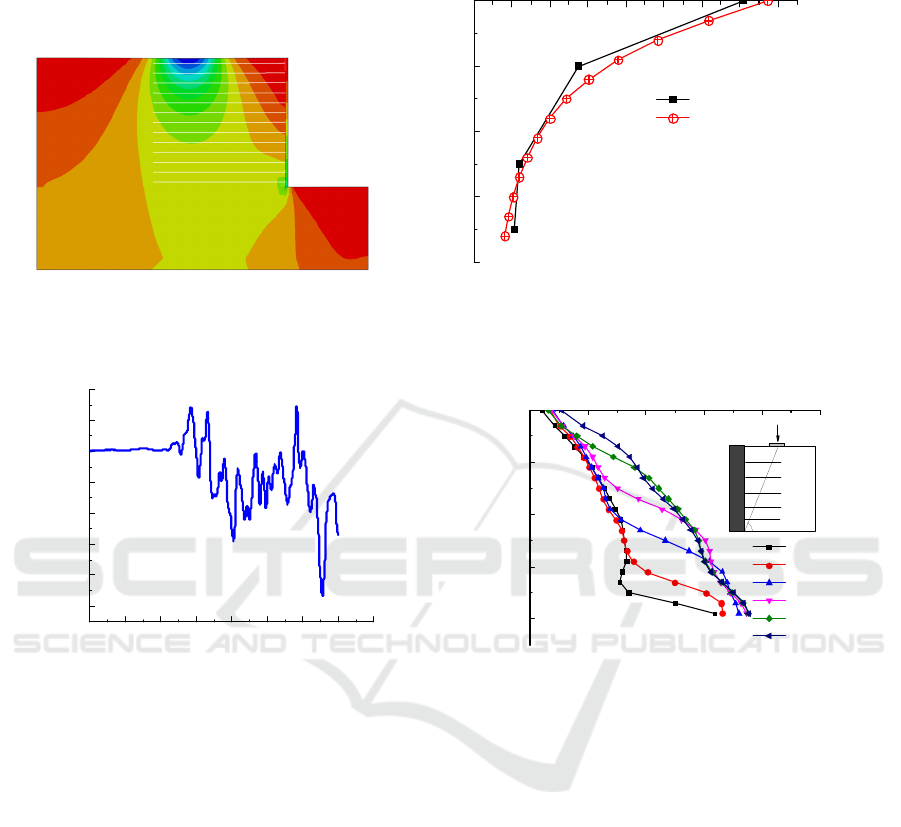
4.2 Model Validation
In the static calculation model, the same load as the
test is taken as 10kPa, 20kPa, 30kPa, 40kPa, 50kPa,
and 54.1kPa, respectively. The vertical soil pressure
cloud map under static loading is shown in Figure 6
(a), and the comparison between the vertical soil
pressure at the top of the retaining wall and the test
results is shown in Figure 6 (b).
In the calculation, the same load as the test is taken
as 10kPa, 20kPa, 30kPa, 40kPa, 50kPa, and 54.1kPa,
respectively. The vertical soil pressure cloud map of
the MSE wall under static loading is shown in Figure
6 (a), and the comparison between the vertical soil
pressure at the top of the wall and the test results is
shown in Figure 6 (b).
From Figure 7 (a), it can be seen that at around 0.3
seconds, the first bogie of the train passes through the
middle of the wall, and at around 0.6 seconds, the
second bogie of the train passes through the middle
of the wall. When the train bogie passes through the
wall, there are two obvious peaks in the vertical soil
pressure. Compared with static soil pressure, the
dynamic soil pressure under the action of a train has
a clear variation with time. At the same time, when
the train pass through the wall, the soil pressure inside
the wall reaches its maximum.
From Figure 7 (b), it can be concluded that under
the high-speed trains load, the distribution of soil
pressure inside the wall shows a non-linear
distribution in the active zone and a linear distribution
in the stable zone. The soil pressure in the stable zone
is consistent with the law calculated by the Coulomb
soil pressure calculation formula. The distribution of
soil pressure under train load is only the same as that
under static load in the stable zone, but different in
the active zone. Therefore, it is recommended to
comprehensively consider the effects of dynamic and
static loads when calculation.
Analysis of Soil Pressure Distribution and Fracture Surface Inside Mechanically Stabilized Earth (MSE) Walls of High-Speed Railways
177
10 15 20 25 30 35 40 45 50
8
6
4
2
0
Wall height(m)
Vertical soil pressure(kPa)
t est result
Simulation results
(a) (b)
Figure 6: Comparison of vertical displacement.
0.0 0.1 0.2 0.3 0.4 0.5 0.6 0.7 0.8
7. 0× 10
4
7. 2× 10
4
7. 4× 10
4
7. 6× 10
4
7. 8× 10
4
8. 0× 10
4
8. 2× 10
4
8. 4× 10
4
Vertical soil pressure(kPa)
Time(s)
5.0×10
4
1.0×10
5
1.5×10
5
2.0×10
5
2.5×10
5
8
6
4
2
0
45°+f /2
1
56
load
7.8
Distance from the wall bottom (m)
Vertical s oil pressure(kPa)
1m
2m
3m
4m
5m
6m
wall
0
(a) Changes in dynamic soil pressure inside the wall
during train operation
(b) Distribution of dynamic soil pressure inside retaining
walls under dynamic loading
Figure 7: Vertical soil pressure inside the wall under dynamic load.
4.3 Failure of Ribs Leads to Changes in
the Soil Pressure Zone and
Fracture Surface
When the intercity railway train runs at a speed of
250km/h, the variation of soil pressure at the middle
position of the wall with the train running time is
shown in Figure 7 (a), and the distribution of soil
pressure inside the wall is shown in Figure 7 (b)
It is generally believed that the location of the
fracture surface of MSE walls will not change, and the
stable and active areas of soil pressure distribution are
also unchanged. However, in practical situations, if a
layer of ribs in the MSE wall fails, will the regional
range change, and how will the corresponding
fracture surface change? To study this problem, the
following different working conditions were
calculated separately.
(1) Firstly, the stress-strain and fracture surface
changes were calculated under the condition of no
failure of the reinforcement within the entire range,
as follows:
ICESCE 2024 - The International Conference on Environmental Science and Civil Engineering
178
(a) Vertical displacement and strain cloud map of
soil inside the retainin
g
wall
(b) Vertical strain cloud map of soil
(
c
)
Stress distribution dia
g
ram of each la
y
er of reinforcement stri
p
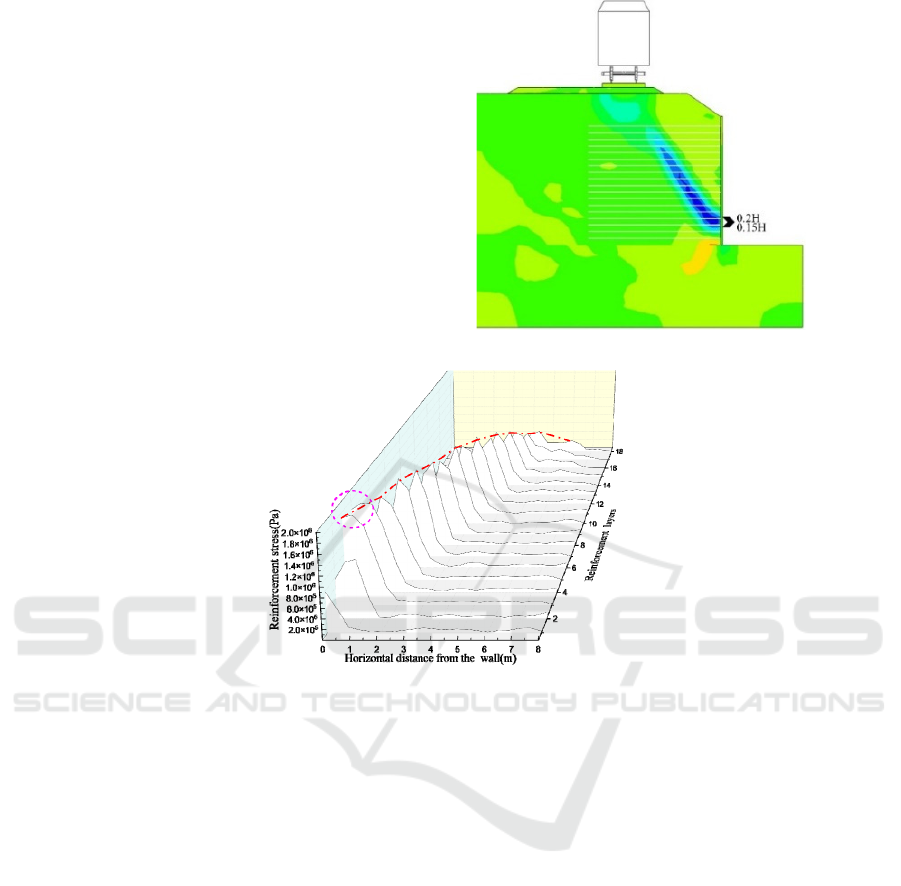
Figure 8: Stress distribution of soil and reinforcement strips when the train passes through the retaining wall.
From Figure 8 (a), it can be observed that when
the train passes through the wall, there are two
obvious areas of vertical soil displacement inside the
wall, one is the inclined downward displacement area,
and the other is the inclined upward area at the bottom
of the wall. When the train passes through the wall, a
shear slip zone will inevitably appear between the two
zones. The position the sliding band is 0.15H at the
bottom of the wall.
From Figure 8 (b), it can be seen that when the
train passes through the wall, a significant strain
concentrated shear slip zone appears in the soil, with
the maximum strain concentrated between 0.15H and
0.2H at the bottom end.
From Figure 8 (c), it can be obtained that when the
train passes through the wall, each layer of ribs shows
a significant peak. The location of the fracture surface
of the wall is determined by connecting the maximum
stress of each layer of ribs with a red line. It can be
observed that the maximum stress in the third and
fourth layers of the red circle is significantly higher
than the others, so the most likely to fracture first is
the third and fourth layers.
It can be seen that the maximum reinforcement
stress of the 3rd and 4th layers plays a crucial role in
the entire ribs layer. In order to study how the stress
distribution of the ribs when two or more layers of
ribs fail, and the changes of the shear slip zone and
fracture surface inside the wall, the stress and soil
strain changes of the ribs were studied when the 3rd,
4th, 5th, and 6th layers fail respectively.
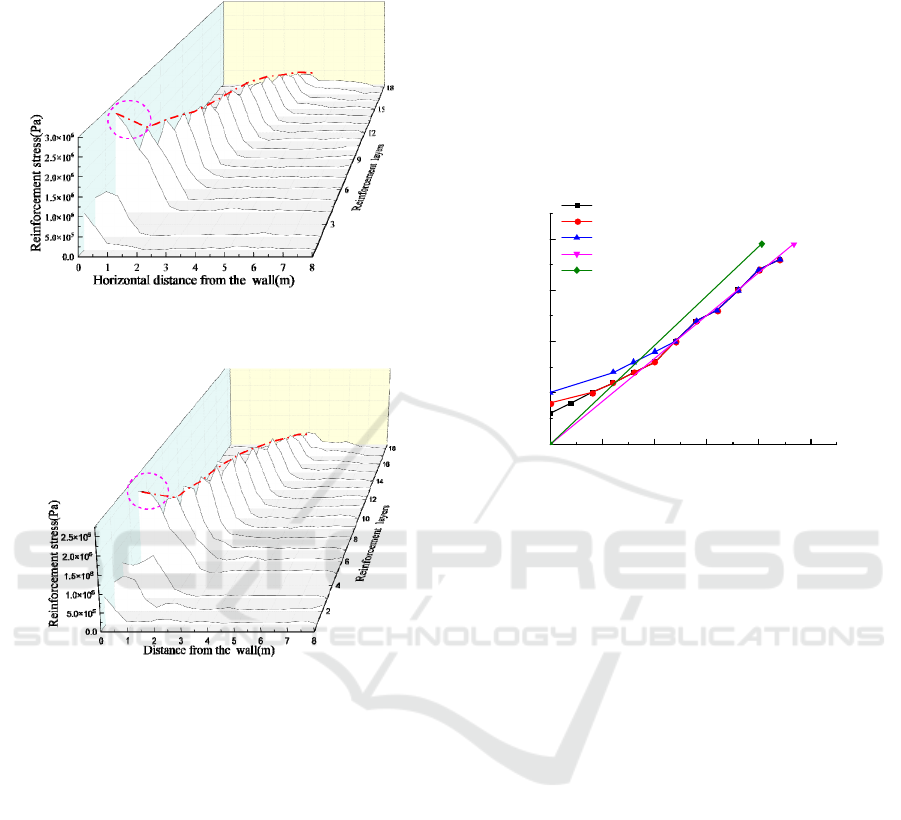
(2) When the third layer of ribs fails, the stress
distribution of the ribs inside the retaining wall is
shown in Figure 9.
From Figure 9, it can be got that when the third
layer ribs fail, the maximum stress of the fourth layer
ribs is significantly higher than that of the other layers,
and the maximum stress increases by 54% compared
to the maximum stress without failure. At the same
time, the position of the fracture surface has also
undergone significant changes, from the original
position of the third layer to the fourth layer, as shown
by the red line.
(3) When the fourth layer of ribs fails, the vertical
Analysis of Soil Pressure Distribution and Fracture Surface Inside Mechanically Stabilized Earth (MSE) Walls of High-Speed Railways
179
displacement, strain, and stress distribution of the soil
are shown in Figure 10.
Figure 9: Stress distribution of the ribs in the wall during
the third layer fail.
Stress distribution of reinforcement when the fourth
layer of reinforcement fails
Figure 10: Stress distribution of soil and reinforcement
when the fourth reinforcement fails.
From Figure 10, it can be seen that when the train
passes through the wall, there are two obvious areas
of vertical dynamic displacement of the soil inside the
wall. When the train passes through the retaining wall,
a shear slip zone will inevitably appear between the
two displacement zones. The position at the bottom of
the sliding band is 0.2H from the bottom of the wall.
From Figure 10, it can be seen that when the train
passes through the wall, there is a clear sliding slip
zone with concentrated strain inside the wall, and the
maximum strain is concentrated between 0.2H and
0.25H at the bottom end.
From Figure 10, it can be seen that when the fourth
layer’s ribs fail, the maximum stress of the fifth ribs
is significantly higher than that of the other layers, and
the maximum stress increases by 39.7% compared to
the maximum stress when without failure. At the same
time, the position of the fracture surface has also
undergone significant changes, from the third layer to
the fifth layer, as shown by the red line.
Draw the fracture surface positions of the 3rd, 4th,
5th, and 6th layers of the reinforcement ribs when
they fail and all layers have no failure in the same
diagram. At the same time, the Rankine fracture
surface and the railway standard 0.3H fracture
surface are also compared and analyzed in the figure,
as shown in Figure 11.
012345
2
4
6
8
Stable zone
Distance from the retaining wall(m)
Distance from the bottom of the wall(m)
No failure or failure in layer 5/6
3rd layer reinforcement failure
4th layer reinforcement failure
0.3H fracture surface
Rankine fracture surface
Active area
Figure 11: Comparison of fracture surfaces under different
layers of reinforcement failure.
From the Figure 11, it can be concluded that when
the third layer of ribs fails, the fracture surface of the
MSE wall will rises from the original 0.15H to 0.2H.
When the fourth layer’s ribs fails, the position of the
fracture surface will rises from the original 0.15H to
0.25H. When the fifth or sixth layer’s ribs fail, the
fracture surface returns to the original 0.15H position.
It can be seen that only when the ribs fail within the
range of 0.15H to 0.25H, the position of the fracture
surface inside the MSE wall will change.
By comparing the location of the fracture surface
calculated in this article with the American Rankine
fracture surface and the 0.3H fracture surface, it can
be concluded that the traditional belief is that the
location of the fracture surface is fixed and
unchanging, and the active and stable areas divided
by the fracture surface are also fixed and unchanging.
But if the ribs in the range of 0.15H to 0.25H fails, it
will change. At the same time, the calculation results
of the Rankine fracture surface are relatively small,
while the results of the 0.3H fracture surface are
relatively conservative.
In the designing of MSE walls for high-speed
railways, the ribs at the bottom of the wall should be
strengthened within the range of 0.15H to 0.25H. The
design principle should ensure that the failure of a
ICESCE 2024 - The International Conference on Environmental Science and Civil Engineering
180

certain layer’s ribs will not cause further failure when
the stress of the previous layer’s increases.
5 CONCLUSION
Model tests were conducted to investigate the soil
pressure changes inside MSE walls under static and
dynamic train loads. A three-dimensional coupled
model of high-speed train track MSE walls was
established, and the soil pressure changes and fracture
surface were analyzed. The conclusions are as follows:
(1) Through static load tests, it has been found that
reducing the spacing and increasing the length of ribs
have a certain effect on reducing the soil pressure.
(2) Under static load, the soil pressure is linearly
distributed along the depth of the wall. However,
under train load, the soil pressure inside the wall is
linearly distributed in the stable zone, but exhibits
nonlinear trend in the active zone. Therefore, when
calculating the soil pressure of the MSE wall, the
effects of train and static loads should be
comprehensively considered.
(3) In existing designs, it is generally believed that
the location of the fracture surface in the active and
stable areas of the MSE wall is fixed and unchanged.
However, when the ribs at the bottom of the wall fails
within the range of 0.15H to 0.25H under the load of
high-speed trains, the fracture surface of the wall will
move upwards along the wall. Therefore, in the design
of high-speed railway MSE walls, it is recommended
to strengthen the designing of the ribs at the bottom
of the retaining wall within the range of 0.15H to
0.25H.
ACKNOWLEDGMENTS
This research was funded by the Guangzhou
Construction Group Technology Plan Project (Grant
no. [2022]-KJ005, [2023]-KJ013, [2023]-KJ014,
[2024]-KJ043, [2024]-KJ106, [2024]-KJ105)
REFERENCES
Jiang, Z. W., Guo, X. Y., Li, W. T., et al. 2016. Self-
shrinkage behaviors of waste paper fiber reinforced
cement paste considering its self-curing effect at early-
ages. International Journal of Polymer Science, 2016:
1-12.
Noike, T., Goo, I. S., Matsumoto, H., et al. 2004.
Development of a new type of anaerobic digestion
process equipped with the function of nitrogen removal.
Water Science & Technology, 49(5/6): 173-179.
Jean, B. P., Alain, C., Emmanuel, B., et al. 2015. Dynamic
behavior of a mechanically stabilized earth wall under
harmonic loading: experimental characterization and
3D finite elements model. Computers and Geotechnics,
65: 199-211.
Alain, C., Emmanuel, B., Jean, B. P., et al. 2017. Numerical
simulation of the response of a reinforced wall to a high
speed train passage. International Journal for
Numerical and Analytical Methods in Geomechanics,
41(11): 1285 -1303.
Fei, S., Liu, H. B., Ma, L. Q., et al. 2018. Numerical
analysis of geocell-reinforced retaining wall failure
modes. Geotextiles and Geomembranes, 46(03): 284-
296.
Ehsan, S. H., Ahoo, A. 2018. Numerical simulation of two-
tier geosynthetic reinforced soil walls using two phase
approach. Computers and Geotechnics, 100:15-29.
Mohammad, R. S., Jie, H., Sazzad, B. S., et al. 2018. Study
of the behavior of mechanically stabilized earth (MSE)
walls subjected to differential settlements. Geotextiles
and Geomembranes, 46(01): 77-90.
Xiao, C. Z., Li, G. Q., Gao, S., et al. 2021. Dynamic
response of tiered geogrid-reinforced soil retaining
walls under traffic loading. Chinese Journal of
Geotechnical Engineering, 43(10): 1789-1797+1961.
Wang, J. Q., Zhong, W. T., Huang, S. B., et al. 2023.
Experimental study on static and dynamic
performances of modular reinforced earth retaining
wall. Rock and Soil Mechanics, 44(05): 1435-1444.
Ren, F. F., Xu, H., Huang, Q. Q. 2021. Study on
deformation and failure mechanisms of reinforced soil
retaining walls subjected to horizontal static/dynamic
loading. Chinese Journal of Rock Mechanics and
Engineering, 40(06): 1248-1257.
Xu, P., Zhong, Y., Ma, H. D., et al. 2023. Upper bound
analysis of bearing capacity of reinforced soil retaining
walls under strip footing load. Journal of Railway
Engineering Society, 40(03): 14-19.
Yang, G. Q., Niu, X. D., Zhou, S. G., et al. 2021.
Experimental study on structural behavior of reinforced
retaining wall with composite full-height rigid facing.
Rock and Soil Mechanics, 42(07): 1794-1802.
Du, Y. X., Liu, H., Zhou, F. 2018. Mechanical properties of
hybrid reinforced soil retaining wall. Journal of Central
South University (Science and Technology), 49(04):
940-948.
National Railway Administration Code for Design of High
Speed Railway: TB 10621-2014. Beijing: China
Railway Publishing House, 2014.
Yang, Y. T. 2015. The research on engineering properties
of QingRong intercity railway reinforced earth
retaining wall. ShiJiaZhuang TieDao University.
College of Civil Engineering, pp. 31-52.
Zhai, W. M. 2007. Vehicle-Track Coupling Dynamics
. 3rd
ed. Science Press, Beijing, pp. 390-400.
National Railway Administration. Code for design on
retaining structures of railway subgrade: TB 10025-
2019. China Railway Publishing House, Beijing. 2019.
Analysis of Soil Pressure Distribution and Fracture Surface Inside Mechanically Stabilized Earth (MSE) Walls of High-Speed Railways
181

Li, L., Zheng, J. J., Cao, W. Z., et al. 2020. Numerical
analysis of widening subgrade using pile-supported
reinforced-earth wall considering rhelogical
characteristics of subsoil. Journal of Civil and
Environmental Engineering, 42(02): 65-72.
ICESCE 2024 - The International Conference on Environmental Science and Civil Engineering
182
