
Machine Learning-Based Prediction of the Course Assessment
Weimin Geng
1a
, Qiuling Li
2,*
and Dian Zhang
2
1
Shanghai Urban Construction Vocational College, 2360 Jungong Road, Shanghai 201999, China
2
Clinbrain Co., Ltd., Shanghai Putian Information Industry Park B2 Building, Shanghai 200233, China
*
Keywords: Machine Learning, Water Supply and Drainage Engineering, Course Assessment Prediction, LightGBM,
Lasso Regression.
Abstract: In order to keep track of the students' learning status and make early warning, the model of predicting the
final course assessment was proposed based on machine learning. Take the course of water supply and
drainage engineering cost as an example, the students’ related information and the historical assessment data
(such as the teaching activities and the stage assessment scores etc.) collection and cleaning were carried out
firstly. Then the features were filtered out by Light Gradient Boosting Machine (LightGBM), and the
prediction model of the final score was built on the basis of Least Absolute Shrinkage and Selection Operator
(Lasso) regression. Phases 1 and 2 forecast were completed and the error statistics were analysed. The
predicted results at different stages of the semester help the teachers and students get the learning situation
and take timely adjustment measures.
1 INTRODUCTION
For the applied colleges, the assessment and
evaluation of the specialized courses usually adopt a
process-based and comprehensive mode and are
distributed throughout the semester. In recent years,
researchers have done various studies on teaching
assessment and evaluation. The processing-
assessment mechanism and reasonable curriculum
assessment method were introduced by Zhou et al.
(2023). Zhou and Liu (2023) studied the evaluation
framework building based on Context, Input, Process,
Product (CIPP). The evaluation index system of
online and offline blended curriculum was
constructed by Huang (2023). And Kou analysed the
problem of a course evaluation based on Outcome
Based Education (OBE) and proposed the
implementation scheme of the diversified course
evaluation system (Kou, 2023). With the
development of Artificial Intelligence (AI), the
researchers began to apply it in the course evaluation,
and AI has formed a discipline system with neural
networks, machine learning, and expert systems etc.
as core algorithms. Maestrales et al. (2021) trained
human raters and compiled a robust training set to
a
https://orcid.org/0009-0004-8404-5114
develop machine algorithmic models and cross-
validate the machine scores in chemistry and physics.
Gao et al. (2023) summarized the advantages of
machine learning in the fields of scoring strategies,
learning assessment and educational intervention. In
addition, Cao et al. (2023) studied the method of
student learning situation early warning.
During the semester, to know the learning
situation of students timely and take measures when
there is an abnormality are very important for the
teachers. The paper suggested the method to forecast
the total final grade of the course according to the
various assessments that have been completed during
the semester. The prediction helps the teachers to
keep track of the learning situation of each student in
a timely manner and make solutions for some
students who have difficulties in passing the final
assessment.
168
Geng, W., Li, Q., Zhang and D.
Machine Learning-Based Prediction of the Course Assessment.
DOI: 10.5220/0013593400004671
In Proceedings of the 7th International Conference on Environmental Science and Civil Engineering (ICESCE 2024), pages 168-172
ISBN: 978-989-758-764-1; ISSN: 3051-701X
Copyright © 2025 by Paper published under CC license (CC BY-NC-ND 4.0)

2 BUILDING THE PREDICTION
MODEL OF THE COURSE
ASSESSMENT
The course assessment is an important teaching
evaluation and feedback. Taking the course of water
supply and drainage engineering cost as an example,
the process assessment includes writing articles,
course comprehensive assignments, course practice,
explanation and presentation, and quality behaviours
(such as attendance, engagement, teamwork) etc.
Therefore, based on the phased assessment results
during the semester, the prediction of the final course
score is possible. The related student’s information
items and the course assessment’s components are
listed in Table 1. And the prediction model is based
on the data in Table 1 except Score 4, with the Final
Score as the target variable and the rest of the
information as the characteristic variables.
Table 1: The related students’ information items and the course assessment’s components.
Numbe
r
Data Name Meaning Types of variables
1 Attribute 1 In high school, the student has learned the basic
knowledge of science or not.
Categorical variables
2 Attribute 2 Gende
r
Categorical variables
3 Activit
y
1 Credits of view online e-resource. Continuit
y
variables
4 Activity 2 Frequency of answering questions in class. Continuity variables
5 Score 1 Quality behaviours (such as attendance, course
p
artici
p
ation, teamwork etc.
)
Continuity variables
6 Score 2 Test of basic concept understanding. Continuity variables
7 Score 3 Inte
g
rated homework. Continuit
y
variables
8 Score 4 Ex
p
lanation and
p
resentation. Continuit
y
variables
9 Final Score Final course assessment. Continuity variables
Since the linear correlation between the input
features (number3-7 in Table 1) and the target
variables was very strong, the prediction model
adopted the combination of LightGBM and Lasso
regression. LightGBM is a type of decision tree, and
it could directly use the characteristics of categorical
features, calculate the importance of features. So, the
features that are meaningful to the target variables are
filtered out. Tree models belong to machine learning
algorithms, which are non-parametric supervised
learning methods. The decision-making process is
represented through a tree structure, where each node
of the tree represents a feature or attribute, and each
leaf node represents a category or numeric value, and
the decision-making rules of the data are presented
through the tree-like structure. LightGBM is an
algorithm that combines Gradient Boosting Decision
Tree and Random Forest to improve prediction
performance by building multiple weak learners
(decision trees) (Meng et al., 2016). Lasso is a linear
model and proposed by Tibshirani for estimation
based on Ridge Regression Theory in 1996
(Tibshirani, 1996). This method minimizes the
residual sum of squares subject to the sum of the
absolute value of the coefficients being less than a
constant. The building of the prediction model mainly
includes the following 3 steps.
2.1 Data Processing
The categorical variables were processed firstly.
Attribute 1 and Attribute 2 generally couldn’t be
directly input into the model, so they need to be
numerically encoded. The data were encoded
according to 0 and 1 respectively. Then the two
variables were converted into category type and
passed to the LightGBM model for screening
features. Secondly, for the continuous variables in the
characteristics, the test score range was 0~100, the
maximum value of activity 1 and activity 2 was not
clear, and the numerical dimensions were different.
So, they were mapped and scaled to the same interval
range. Use maximum-minimum normalization to
scale the data between the intervals [0,1].
𝑥
=
𝑥−𝑥
𝑥
−𝑥
(1)
where 𝑥
is the normalized data, and 𝑥
and
𝑥
represent the maximum and minimum values of
the data respectively (https://scikit-learn.org).
2.2 Feature Selection
LightGBM uses fewer feature fragments, allows for
faster model training, and has better generalization
capabilities (Meng et al., 2016). In addition,
LightGBM can directly use categorical features, and
its high efficiency is mainly reflected in the
Machine Learning-Based Prediction of the Course Assessment
169
processing of multi-sample and multi-features
(Ke et
al., 2017). LightGBM uses the characteristics of
categorical features, calculates the importance of
features, and filter out features that are meaningful to
the target variable.
2.3 Predicting the Final Score
The training samples were cross validated with 5
folds, and 85% of the data was selected as the training
set and 15% as the test set for each fold. Mean
Absolute Error (MAE), Coefficient of Determination
(R2, the closer the value is to 1, the better the model
is trained.), Root Mean Square Error (RMSE) and
Mean Absolute Percentage Error (MAPE) were
adopted to evaluate the model effect to ensure it was
balanced, and the average score of the model was
used as the final model evaluation result. The error
calculation formulas are as follows
(Zhou, 2016).
𝑀𝐴𝐸=
1
𝑛
|y
i
−𝑦
|
(2)
𝑅𝑀𝑆𝐸=
1
𝑛
y
i
−𝑦
(3)
𝑅
= 1−y
i
−𝑦
y
i
−𝑦
(4)
𝑀𝐴𝑃𝐸=
1
𝑛
|y
i
−𝑦
|
𝑦
100%
(5)
where 𝑦
is the measured value, y
i
is the predicted
value, y
i
is the measured mean, and n is the number
of samples.
3 CASE STUDY
Taking the course of water supply and drainage
engineering cost assessment as an example, and there
are a total of 79 students. The Final Score is the object
variable, and number1- number 7 are the feature
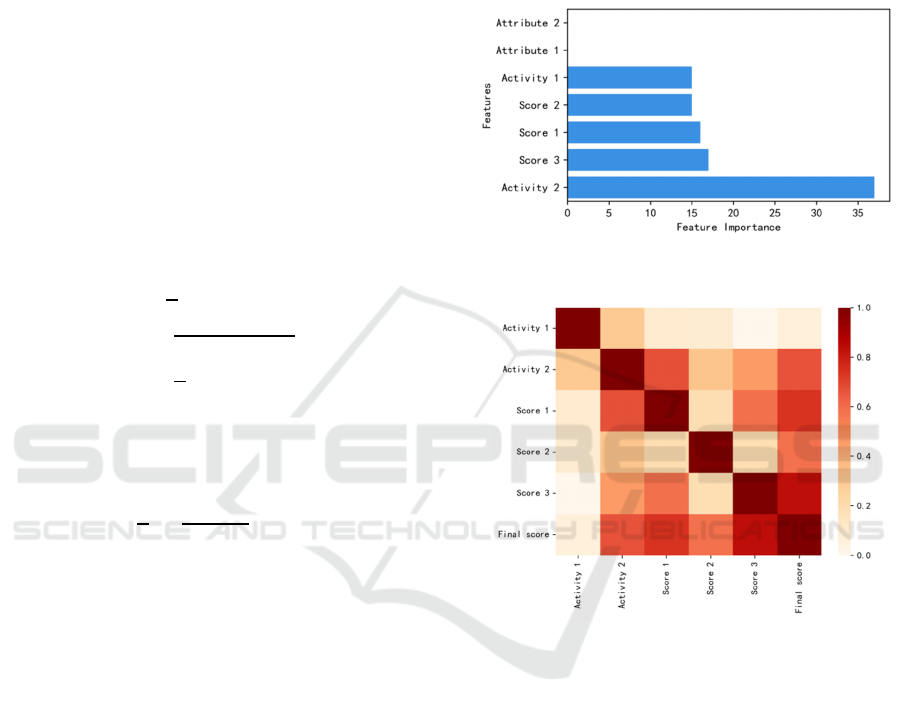
variables. Firstly, the features were screened.
Through the ranking, the importance of Attribute 1
and Attribute 2 to the target in the input features is
almost 0, so these two were not applied as input
features in the prediction model (see Figure 1).
Secondly, the correlation was analysed, and their
linear correlation to the target was calculated. The
correlation heat map is shown in Figure 2.
The prediction of the Final Score was carried out
by Lasso regression. After the Score 2 and Score 3
were obtained during the semester, the Final Score
was predicted respectively and named Phase 1 and
Phase 2 (shown in Figure 3). The coincidence of
Phase 2 prediction is higher than that of phase 1, and
it can also coincide well for some uneven cases.
Figure 4 is the scatter plots of the forecasting results,
and it indicates that the prediction is better when it
falls on the diagonal.
Figure 1: The feature importance ranking graph.
Figure 2: The correlation heat map.
The error statistics of the forecasting model is
listed in Table 2. In addition, the residuals of the
results were calculated. For Phase 1 period, the
residuals of the mean value, the standard deviation,
the minimum value, and the maximum value are -
0.2026, 3.1173, -8.6150, 4.4774 respectively. In
Phase 2, the above values are -0.0842, 1.0752, -
2.7227, 1.8601.
The prediction values of Phase 2 are better than
Phase 1 and could meet the demand to assist the
teaching and at the same time notify the students who
have possibilities not to pass the final course
assessment.
ICESCE 2024 - The International Conference on Environmental Science and Civil Engineering
170
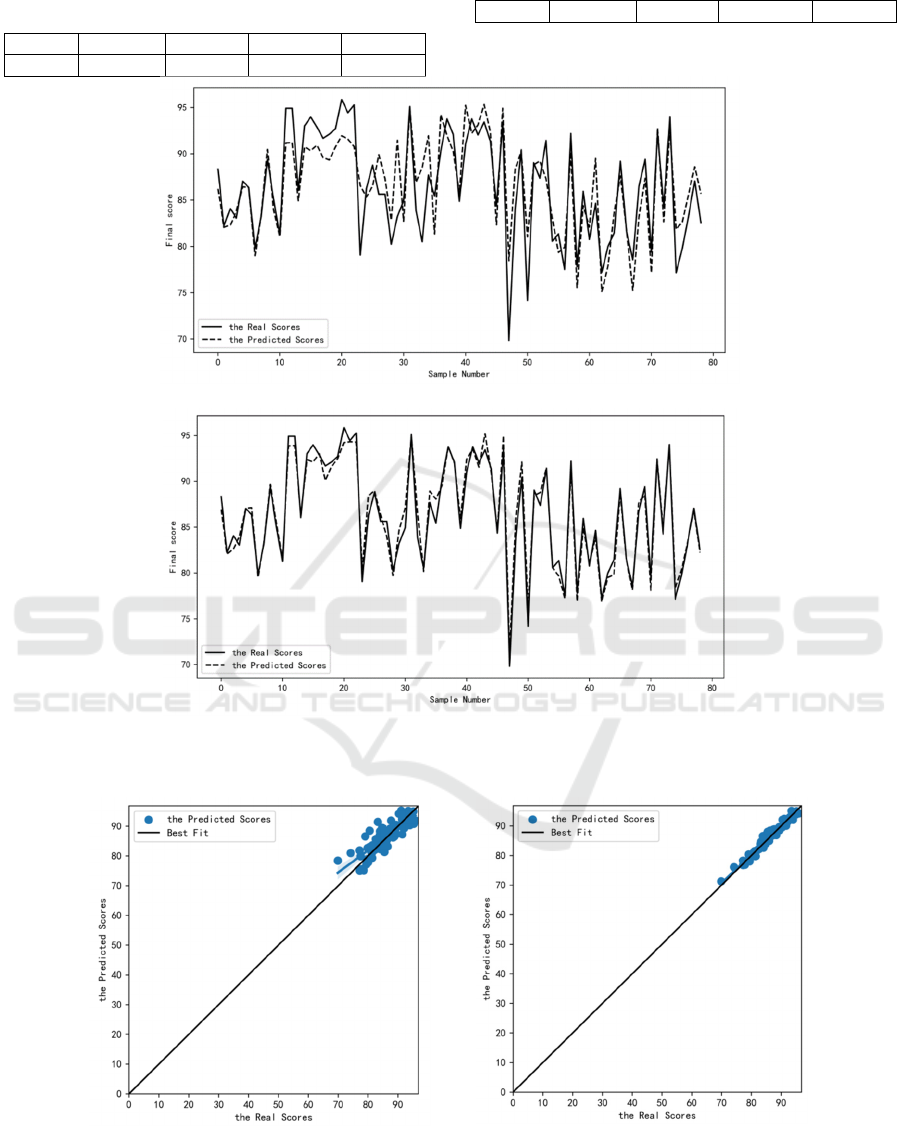
Table 2: The error statistics.
Phase MAE R
2
RMSE MAPE
1 2.48 0.71 3.1 2.93
2 0.83 0.97 1.07 0.97
(a) Phase 1
(b) Phase 2
Figure 3: Comparison of the predicted and actual values.
(a) Phase 1 (b) Phase 2
Figure 4: The fitted scatter plot of the prediction results.
Machine Learning-Based Prediction of the Course Assessment
171

4 CONCLUSION
Based on LightGBM and Lasso regression
algorithms, the prediction model of the course final
assessment was built. The final scores were predicted
by filtering the features and learning the historical
data rules. The course assessment prediction values
can be obtained during the semester, and they remind
some students to adjust their learning status avoid
failing the final assessment. At the same time, it plays
a role in helping the teachers take timely adjustment
measures. Then in the future, with the increasing use
of smart classrooms, their statistics number can also
be included in the prediction model.
REFERENCES
Zhou, Y., Wu, J., Li, Z., Yu, J., Xia, L. 2023. Thinking on
Processing-assessment Mechanism and Reasonable
Curriculum Assessment Method. Higher Education in
Chemical Engineering, 40(1): 70-75.
Zhou, L., Liu, C. 2023 Research on the Evaluation of Labor
Education Courses in Colleges and Universities Based
on CIPP Evaluation Model. Western China Quality
Education, 9(15): 42-45,98.
Huang, R. 2023. Construction and Optimization of Online
and Offline Blended Curriculum Evaluation System.
Journal of Ningbo Polytechnic, 27(5): 102-108.
Kou, J. 2023. Research on Diversified Evaluation System
of "Higher Mathematics" Based on OBE. Innovative
Teaching, 9: 130-132.
Maestrales, S., Zhai, X., Touitou I., Baker, Q., Schneider,
B., Krajcik, J. 2021. Using Machine Learning to Score
Multi‑Dimensional Assessments of Chemistry and
Physics. Journal of Science Education and Technology,
30: 239–254.
Gao, S., Zhang, S., Meng, X., Ding, Y., Wang, J. 2023.
Application of Machine Learning in Science Education
Evaluation: Dimensions, Domains and Laws. Chinese
Journal of ICT in Education, 29(10): 83-92.
Cao, M., Ou, Y., Wu, D., Du, P. 2023. Research on Student
Learning Situation Early Warning Method Based on
Machine Learning. Modern Information Technology
7(19): 142-144,150.
Meng, Q., Ke, G., Wang, T., Wei, C., Ye, Q., Ma, Z., Liu,
T. 2016. A Communication-efficient Parallel
Algorithm for Decision Tree. 30th Conference on
Neural Information Processing Systems (NIPS 2016),
Barcelona, Spain.
Tibshirani, R. 1996. Regression Shrinkage and Selection
Via the Lasso. Journal Of the Royal Statistical Society:
Series B (Methodological), 58(1): 267-288.
https://scikit-learn.org.
Ke, G., Meng, Q., Finley, T., Wang, T., Chen, W., Ma, W.,
Ye, Q., Liu, T. 2017. LightGBM: A Highly Efficient
Gradient Boosting Decision Tree. 31st Conference on
Neural Information Processing Systems (NIPS 2017),
Long Beach, CA, USA.
Zhou, Z. 2016. Machine Learning. Tsinghua University
Press, Beijing. pp. 73-91.
ICESCE 2024 - The International Conference on Environmental Science and Civil Engineering
172
