
Seismic Isolation Analysis of a Multi-Story Frame Structure
Yong Sun
a
, Shaohong Pan and Yanfeng Zhao
*
Yunnan Land and Resources Vocational College, Kunming, Yunnan, China
*
Keywords: Foundation Isolation, FNA Method, ETABS.
Abstract: Taking a nursing home in Yunnan Province as an example, this paper analyzes the isolation control of the
superstructure with the base isolation measures.Using the convenience of YJK modeling, the structural model
is built in YJK, and the YJK-ETABS model is converted through the built-in interface of YJK software.Using
the fast nonlinear analysis FNA method, the nonlinear mode integration method is used to analyze the non-
isolated and isolated structures under forcing-resistant earthquakes and rare earthquakes respectively. The
results show that:Through horizontal deformation, the isolation bearing can effectively dissipate the seismic
force, prolong the basic period of the building structure, increase the damping of the overall structure, greatly
avoid the characteristic period of the site, and play an obvious filtering effect on the high-frequency energy
in the seismic wave.The structural system is changed into a flexible system, and the seismic isolation idea is
changed from the traditional hard seismic resistance to soft seismic isolation, thus isolating the seismic energy
transfer to the superstructure to a large extent, reducing the structural dynamic response, and achieving the
purpose of seismic isolation control.The isolation effect of the superstructure after using the isolation device
is remarkable, which can meet the seismic demand of the structure.
1 INTRODUCTION
With the rapid development of China's society and
national economy, infrastructure construction has
reached a peak period, and the architectural structure
has roughly presented several characteristics, such as
large-scale construction, large area, large number,
structural growth, towering, and complicated.Now
facing a problem, most of the complex buildings in
large and medium-sized cities have not been tested by
large earthquakes, and China is a country with
frequent earthquakes, and there are a lot of
infrastructure construction close to or across the
earthquake fault, there are still a large number of new
and old buildings that do not meet the seismic
requirements.In the past earthquake disasters, the
probability of damage is often low after the
installation of isolation devices, that is, it is more safe
and reliable, the isolation effect is obvious, and it has
a good advantage of earthquake isolation.
Isolation technology is a typical passive control
technology. Since its birth in the 1960s, scholars from
all over the world have carried out in-depth research
a
https://orcid.org/0009-0001-1832-6100
on it, making its application more and more extensive.
At present, isolation technology has become
mature.It was introduced in China in the 1980s. In
1996, Tang Jiaxiang (Tang et al., 1996) described the
design method and principle of foundation isolation
based on the actual isolation engineering, and
compared the final cost of non-isolation engineering
built in the same period. The research shows that the
use of isolation measures can save 10% of the total
cost of the project.In 2001, China wrote the isolation
technology into the seismic code, proposed the
concept of shock absorption coefficient, and
vigorously promoted its use in practical engineering
(GB 50011-2001, 2008), in 2004, Qi Ai (Qi et al.,
2004) deduced the height to width ratio limit of the
foundation isolation structure under different
working conditions. In 2010, Liu Haiqing (Liu et al.,
2010) showed through research that considering the
interaction of soil structure on soft soil foundation
can further improve the isolation effect. In 2013,
based on the actual isolation effect of the outpatient
complex building of Lushan County People's
Hospital, Zhou Yun (Zhou et al., 2013) proposed that
the isolation guidance method in the 2010 edition of
Sun, Y., Pan, S., Zhao and Y.
Seismic Isolation Analysis of a Multi-Story Frame Structure.
DOI: 10.5220/0013581000004671
In Proceedings of the 7th International Conference on Environmental Science and Civil Engineering (ICESCE 2024), pages 145-151
ISBN: 978-989-758-764-1; ISSN: 3051-701X
Copyright © 2025 by Paper published under CC license (CC BY-NC-ND 4.0)
145

the Code for Seismic Design of Buildings is effective
and reasonable. Li Zengxin (Li et al., 2013) studied
the seismic isolation of multi story frame structures,
simplified it into a single point model for theoretical
analysis, and compared the frame structures before
and after seismic isolation using ETABS. Research
has found that in multi-layer seismic isolation
structures, the horizontal stiffness of the isolation
layer decreases, and the upper acceleration response
significantly decreases; As the damping ratio
decreases, the upper acceleration response also
decreases, but the displacement response increases.In
recent years, our country is also vigorously promoting
the isolation of buildings, this paper combined with a
project example, the isolation of a nursing home in
Yunnan was analyzed.
2 ISOLATION DESIGN PROCESS
(1) Initially determine the target of seismic isolation
fortification, usually by reducing the intensity of
fortification by one degree, with the isolation
layer as the boundary, which is divided into three
parts: substructure, superstructure and isolation
layer.
(2) Model conversion: convert YJK model or
PKPM model into ETABS model, and make
model comparison to compare its quality, period,
and floor shear to test the reasonable feasibility
of the model.
(3) The ETABS isolation model is established.
Under the representative value of gravity load,
the isolation model under forced-earthquake is
obtained through the reasonable arrangement of
rubber isolation supports with lead core and
without lead core.
(4) The horizontal damping coefficient is calculated,
7 seismic waves are selected, and elastic time
history analysis and FNA time history analysis
are carried out on the medium earthquake non-
isolation model and the medium earthquake
isolation model respectively.The ratio of shear
force and overturning moment before and after
seismic isolation is calculated. Finally, the
maximum ratio of the two above the seismic
isolation layer is taken as the damping
coefficient.
(5) Judging whether the fortification target is
satisfied by the horizontal damping factor.
(6) Check calculation of isolation support, check
whether the tensile stress, compressive stress
and displacement index of isolation support
meet the requirements of the code, and use the
obtained support reaction force to reinforce the
pier.
3 VERIFICATION OF ETABS
ANALYTICAL MODEL
The project is a multi-storey frame structure nursing
home, a total of 7 floors, of which, six floors above
the ground, an underground basement (isolation layer)
4.2m high, the first layer is 5.4m high, the rest are
3.6m high, building height: 23.70m.The fortification
intensity is 0.3g, the earthquake group is the third
group, the fortification category is the key
fortification category (Class B), the construction site
category is Class III, the characteristic period is 0.65s,
and the earthquake resistance is unfavorable.
In this project, a large finite element software ETABS
is used to establish the model of isolated and non-
isolated structures, and the calculation and analysis
are carried out.The ETABS software has convenient
and flexible modeling functions and powerful linear
and nonlinear dynamic analysis functions, in which
the connection unit can accurately simulate the
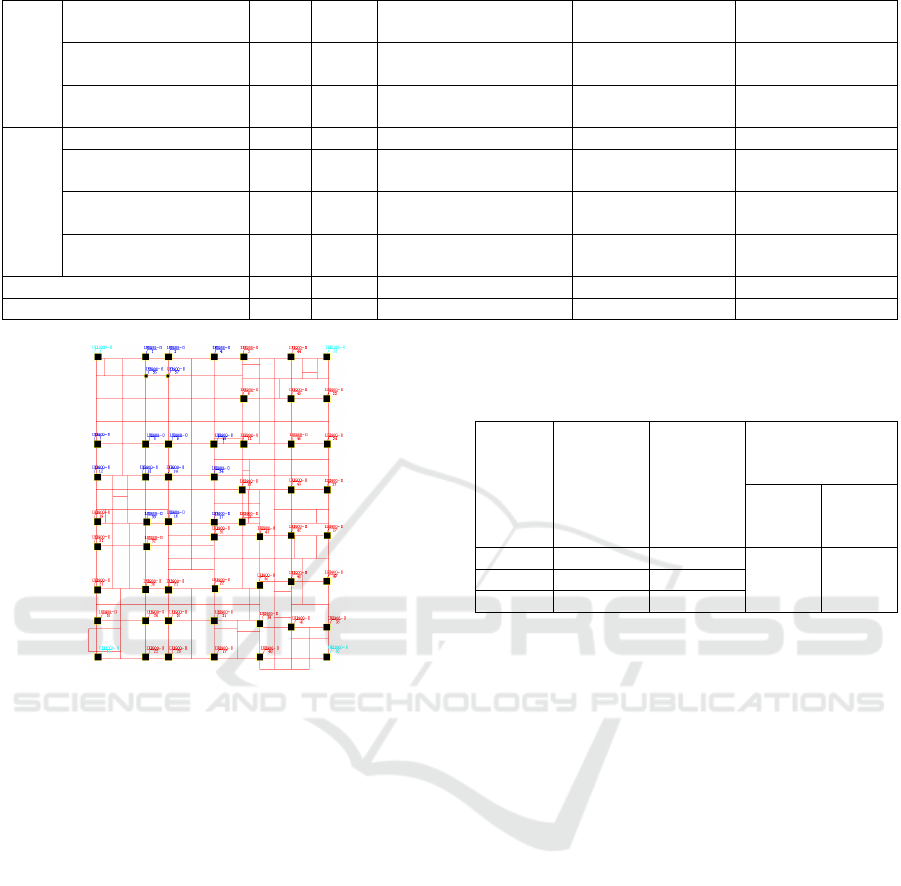
rubber isolation bearing.The structure model is based
on YJK modeling.The ETABS model is shown in
Figure 1.
In order to verify the accuracy of the ETABS
model, the mass, period and seismic shear calculated
by EATBS and YJK non-isolation models are
compared, as shown in the following table (Tables 1-
3). The error algorithm in the table is as follows:
Error = (
|
ETABS-YJK
|
/YJK)*100% (1)
Figure 1: Structure 3D model diagram.
Table 1: Quality comparison of non-isolated structures.
YJK(ton) ETABS(ton) Difference value(%)
16388.797 16267.01 -0.74
ICESCE 2024 - The International Conference on Environmental Science and Civil Engineering
146

Table 2: Cycle comparison of non-isolated structures.
Mode of
vibration
YJK(s) ETABS(s)
Difference
value(%)
1 1.0255 1.0311 0.55
2 0.982 0.9824 0.04
3 0.8418 0.8413 -0.06
Table 3: Comparison of seismic shear forces of non-isolated structures under multiple earthquakes.
Number of floors
YJK(kN) ETABS(kN) Difference value(%)
X Y X Y X Y
7 881.73 889.59 722.46 731.44 -18.06 -17.78
6 3729.07 3855.83 3661.08 3774.89 -1.82 -2.10
5 5939.85 6168.07 5923.98 6133.78 -0.27 -0.56
4 7761.7 8086.79 7802.58 8104.09 0.53 0.21
3 9868.31 10281.25 9960.49 10373.38 0.93 0.90
2 11019.27 11488.77 11138.72 11608.75 1.08 1.04
1 12189.5 12724.01 12291.83 12839.73 0.84 0.91
Isolation layer 12451.38 13000.16 12554.16 13126.99 0.83 0.98
It can be seen from the above table that the
structural mass, calculation period and seismic shear
force (except the top layer) of ETABS non-isolated
structure model and YJK model have little
difference.Therefore, ETABS model, as a finite
element model for seismic isolation analysis of this
project, is accurate and can reflect the basic
characteristics of the structure.
4 SUPPORT ARRANGEMENT
The foundation isolation method is adopted, and the
basement is used as the isolation layer. Considering
the near-field amplification effect, three types of
supports, namely lead core rubber bearing LRB1000,
LRB900 and natural rubber bearing LNR900, are
adopted after repeated trial and calculation from the
aspects of economy, rationality and feasibility. The
mechanical performance parameters of rubber
isolation supports are shown in Table 4. Its support
layout is shown in Figure 2. Among them, the
following principles are mainly followed when the
isolation bearing is arranged:
(1) The Code for Seismic Design of Buildings
(GB50011, 2010) stipulates that the
compressive stress value of the isolation mat
under the representative value of gravity load
should be uniform, and should not exceed the
limit value of 12Mpa for Class B buildings.
(2) In rare cases, the isolation pad should not be in
a tension state, and when it is inevitable, its
tensile stress should be checked to make it less
than the limit value 1.0MPa, so as to control the
isolation support will not be damaged by tension.
(3) In rare cases, the horizontal displacement of the
isolation support should not be too large and
exceed the limit value, the limit value is
min(0.55D, 3Tr), D: the minimum isolation mat,
Tr: the total thickness of the rubber layer).
Table 4: Mechanical property parameters of rubber isolation bearing.
Design parameter
symb
ol
unit
With lead core isolation
su
pp
ort
Lead-free isolation
mount
Lead-free isolation
mount
LRB900 LRB1000 LNR900
Quantity use
d
N
p
iece 37 4 16
First form facto
r
S1 36.9 37.0 35.0
Second form facto
r
S2 5.27 5.49 5.27
Design bearing capacity
(12MPa)
P0 KN 7634 9425 7634
Vertical compression stiffness Kv
KN/
m
m
4450 5150 3850
γ100 Yield force Q
d
KN 141.3 171.1
Seismic Isolation Analysis of a Multi-Story Frame Structure
147
%
Post-yield stiffness K2
KN/
m
m
1.289 1.491
Horizontal equivalent
stiffness
Kh
KN/
m
m
2.116 2.429 1.283
Equivalent damping
ratio
heq % 24.9 24.6
Γ25
%
Yield force Q
d
KN 149.4 180.9
Post-yield stiffness K2
KN/
m
m
1.082 1.252
Horizontal equivalent
stiffness
Kh
KN/
m
m
1.445 1.654
Equivalent damping
ratio
heq % 16.0 15.5
Total thickness of rubber laye
r
T
r
m
m
165 180 165
Total su
pp
ort hei
g
ht H m
m
344.0 380 344.0
Figure 2: Support plane layout.
5 ISOLATION ANALYSIS
5.1 Comparison of Natural Vibration
Period of Structure before and after
Isolation
By comparing the period of the building structure
before and after earthquake isolation, it can be found
from Table 1 that the isolation bearing significantly
amplifies the period of the overall structure and
becomes a flexible system. Among them, the first
period extends from 1.0311s to 2.6081s, enlarging
2.53 times, effectively avoiding the characteristic
period of the site of 0.65s, thereby inhibiting the
dynamic response of the superstructure and isolating
part of the earthquake energy (Table 5).
Table 5: Comparison of structural natural vibration period
before and after isolation.
Mode
of
vibratio
n
non-
isolation(
S)
Shock
isolation(
S)
Difference in X
and Y
directions
(
%
)
non-
isolatio
n
Shock
isolatio
n
1 1.0311 2.6081
4.96% 0.53%
2 0.9824 2.5945
3 0.8413 2.0214
5.2 Isolation Analysis under Multiple
Earthquakes
When using the time-history analysis method, the
actual strong earthquake records and artificial
simulated acceleration time-history curves should be
selected according to the type of building site and the
design earthquake group, in which the number of
actual strong earthquake records should not be less
than 2/3 of the total number, and the average seismic
impact coefficient curves of multiple groups of time
history curves should be statistically consistent with
the seismic impact coefficient curves adopted by the
response spectrum method of vibration mode
decomposition.In this paper, 2 groups of artificial
waves and 5 groups of actual seismic records are
selected. Among them, the comparison between the
response spectrum curve of standard design and 7
time-history wave response spectra and their average
values is shown in Figure 3, and the time-history
curve is shown in Figure 4. By using ETABS
software, the linear modal time-history analysis of the
non-isolated structure is carried out, and the base
shear is compared.
ICESCE 2024 - The International Conference on Environmental Science and Civil Engineering
148
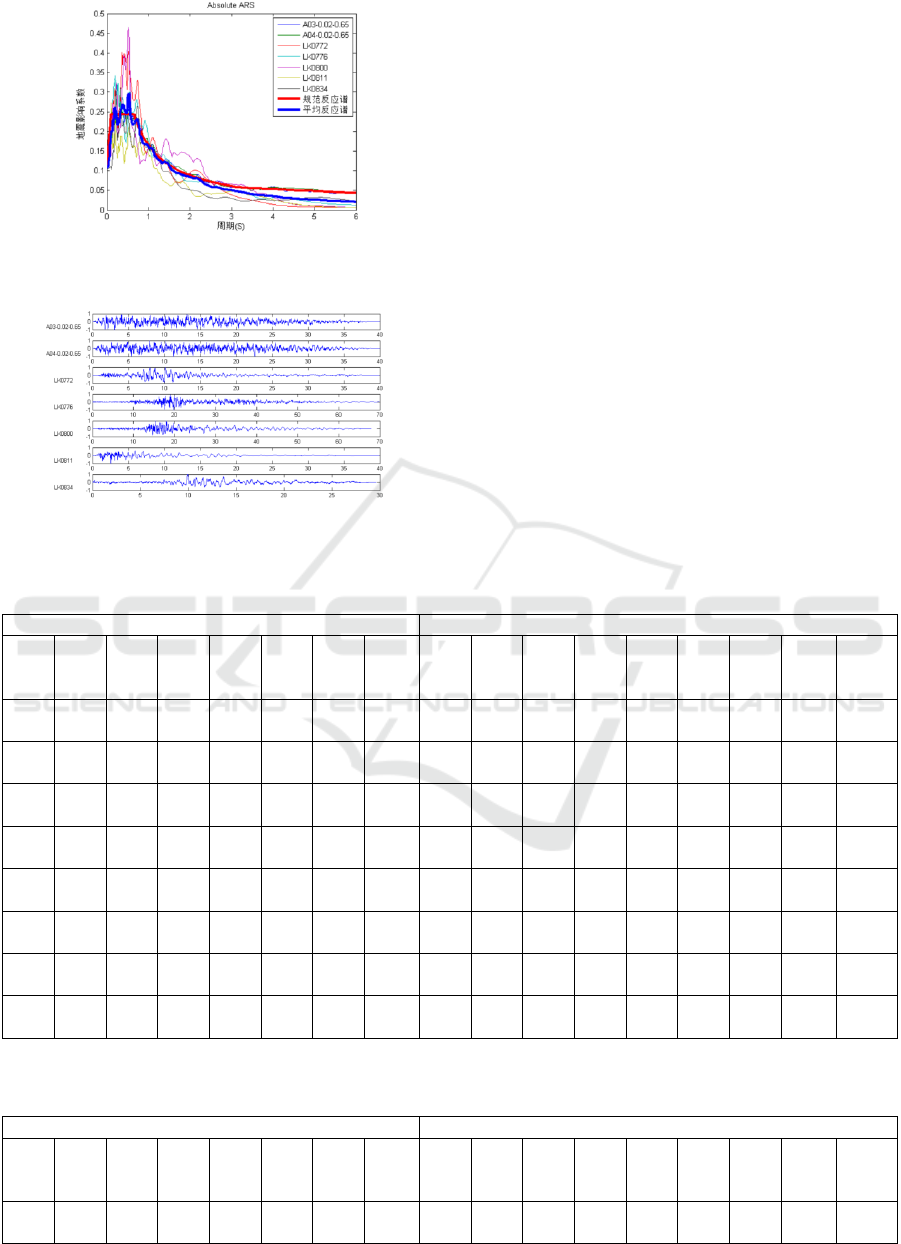
Figure 3: The average of 7 time history response spectra and
the standard response spectrum curve.
Figure 4: Time history curve.
5.3 Analysis of Isolation under
Fortification of Earthquake
In the design of the isolation layer of this project, the
influence of vertical seismic action is considered, and
the isolation supports are arranged according to the
principle of meeting the vertical bearing capacity in
part and as a whole. After review, the isolation
supports meet the relevant requirements of the Code
for Seismic Design of Buildings and the Technical
Regulations for Isolation of Laminated rubber
Supports (CECS 126, 2001). The shear ratio and
bending moment between layers under earthquake
protection are shown in Table 6 and Table 7:
Table 6: The maximum values in the X, Y, and X/Y directions——Inter story shear ratio of non isolated and isolated structures.
Interstory shear force of isolated structure Shear ratio between isolated and non-isolated layers
R1 R2 T1 T2 T3 T4 T5
X-
AV
E
R1 R2 T1 T2 T3 T4 T5
Y-
AV
E
X,Y-
MA
X
0.1
5
0.1
6
0.1
0
0.0
7
0.1
2
0.1
9
0.0
8
0.13
0.1
5
0.1
4
0.1
0
0.0
8
0.1
6
0.2
2
0.0
7
0.13 0.13
0.1
8
0.1
8
0.1
2
0.0
9
0.1
4
0.2
2
0.1
0
0.15
0.1
6
0.1
6
0.1
2
0.0
9
0.1
9
0.2
4
0.0
8
0.15 0.15
0.2
0
0.2
0
0.1
3
0.1
1
0.1
6
0.2
4
0.1
1
0.16
0.1
8
0.1
7
0.1
3
0.1
0
0.2
0
0.2
5
0.0
9
0.16 0.16
0.2
4
0.2
2
0.1
4
0.1
3
0.1
9
0.2
6
0.1
3
0.19
0.2
0
0.2
0
0.1
4
0.1
2
0.2
3
0.2
8
0.1
1
0.18 0.19
0.2
8
0.2
6
0.1
7
0.1
5
0.2
4
0.2
9
0.1
4
0.22
0.2
4
0.2
5
0.1
5
0.1
4
0.2
7
0.3
1
0.1
3
0.21 0.22
0.2
9
0.2
8
0.1
9
0.1
7
0.2
5
0.3
1
0.1
6
0.23
0.2
7
0.2
9
0.1
6
0.1
7
0.2
7
0.3
2
0.1
5
0.23 0.23
0.3
0
0.3
2
0.2
3
0.1
8
0.2
7
0.3
5
0.1
8
0.26
0.3
2
0.3
3
0.1
8
0.2
0
0.2
9
0.3
5
0.1
7
0.26 0.26
0.3
6
0.3
9
0.2
8
0.2
2
0.3
2
0.4
3
0.2
2
0.32
0.3
9
0.3
9
0.2
2
0.2
4
0.3
4
0.4
2
0.2
0
0.32 0.32
Table 7: The maximum values in the X, Y, and X/Y directions——The ratio of interlayer bending moment between non
isolated and isolated structures.
Interla
y
er bendin
g
moment of isolated structure Interla
y
er bendin
g
moment of isolated structure
R1 R2 T1 T2 T3 T4 T5
X-
AV
E
R1 R2 T1 T2 T3 T4 T5
Y-
AV
E
X,Y-
MA
X
0.1
3
0.1
3
0.0
9
0.0
6
0.1
4
0.1
9
0.0
7
0.12
0.1
8
0.1
5
0.1
1
0.0
8
0.1
3
0.2
0
0.0
9
0.13 0.13
Seismic Isolation Analysis of a Multi-Story Frame Structure
149

0.1
6
0.1
6
0.1
2
0.0
9
0.1
8
0.2
4
0.0
9
0.15
0.1
8
0.1
7
0.1
3
0.0
8
0.1
3
0.2
1
0.1
0
0.14 0.15
0.1
7
0.1
7
0.1
3
0.1
0
0.2
0
0.2
5
0.0
9
0.16
0.1
8
0.1
8
0.1
2
0.0
9
0.1
4
0.2
2
0.1
0
0.15 0.16
0.1
9
0.1
8
0.1
4
0.1
1
0.2
1
0.2
6
0.1
0
0.17
0.2
0
0.1
9
0.1
3
0.1
0
0.1
5
0.2
3
0.1
1
0.16 0.17
0.2
1
0.2
0
0.1
5
0.1
2
0.2
4
0.2
9
0.1
2
0.19
0.2
4
0.2
2
0.1
4
0.1
2
0.1
8
0.2
5
0.1
3
0.18 0.19
0.2
3
0.2
3
0.1
5
0.1
3
0.2
7
0.3
1
0.1
3
0.21
0.2
7
0.2
5
0.1
5
0.1
4
0.2
1
0.2
7
0.1
3
0.20 0.21
0.2
6
0.2
7
0.1
7
0.1
5
0.2
8
0.3
3
0.1
5
0.23
0.3
0
0.2
7
0.1
7
0.1
6
0.2
6
0.2
9
0.1
5
0.23 0.23
0.2
7
0.2
9
0.1
7
0.1
6
0.2
9
0.3
4
0.1
6
0.24
0.3
1
0.2
9
0.1
8
0.1
6
0.2
7
0.3
1
0.1
6
0.24 0.24
As can be seen from the above table, the ratio of
shear force before and after isolation of building
structure is mainly calculated under earthquake
prevention, and the ratio of overturning 6 bending
moments is also needed to be calculated for high-rise
building structures.The maximum ratio except the
isolation layer is selected as the final horizontal
damping coefficient 0.26. Considering the effect of
near-field amplification, the horizontal seismic effect
influence coefficient of the building structure can be
obtained by the formula as 1.5×0.24×0.26/0.85 =
0.110.Considering comprehensively, the horizontal
seismic influence coefficient of the structure is 0.12,
which meets the requirement of lowering the
fortification intensity by one degree.
5.4 Analysis of Isolation under Rare
Earthquakes
The vertical seismic force of this project is 0.3 times
the representative value of gravity load.Under rare
earthquakes, the load combinations are selected as
follows:
①Displacement calculation:
1.0×Dead load + 0.5×live load + 1.0×horizontal
seismic action,i.e.1.0D+0.5L+1.0 Fek;
②Tensile stress calculation:
1.0×Dead load±1.0×horizontal seismic action -
0.5×Vertical seismic action,
i.e.1.0D ±1.0 Fek -0.5×0.3×(1.0D+0.5L)=0.85D-
0.075L±1.0Fek。
③Compressive stress calculation:
1.0×Dead load+0.5live load+1.0×horizontal seismic
action+0.5×Vertical seismic action,
i.e.1.0D+0.5L+1.0Fek+0.5×0.3(1.0D+0.5L)=1.15D+
0.575L+1.00Fek;
④Shear force and axial force calculation:
1.2(1.0×Dead load + 0.5×live load) +
1.3×horizontal seismic action+0.5×Vertical seismic
action,
i.e.1.2(1.0D+0.5L)+1.3 Fek
+0.5×0.3×(1.0D+0.5L)=1.35D+0.675L+1.3 Fek;
The calculation results show that under rare
conditions, the most unfavorable horizontal
displacement in both directions (X, Y) of the isolation
support is 480mm, which is less than the horizontal
displacement limit of the isolation mat of this project
of 495mm, and there is a certain safety reserve space
to ensure that the isolation device can isolate and
dissipate most of the seismic energy and achieve the
expected isolation target.
Under rare conditions, some side supports are
strained, and the maximum tensile stress value is
0.33MPa<1MPa.The maximum compressive stress is
13.39MPa<30MPa, that is, both tensile and
compressive stresses meet the specifications,
indicating that the isolation performance of the large-
diameter isolation mat will not be damaged due to
excessive tension.
6 CONCLUSIONS
This paper describes the basic flow and steps of
seismic isolation analysis, and provides some
empirical guidance for the isolation of multi-story
frame structures.The results show that:
(1) After the isolation technology is adopted, the
isolation bearing extends and amplifies the
basic period of the structure, effectively avoids
the high-frequency part of the seismic wave,
weakens the isolation earthquake action, and
thus reduces the structural response.The section
of the component is reduced, the building space
is increased, and the total cost of the project is
saved.
(2) The isolation device dissipates seismic energy
through deformation and isolates seismic
transmission. The upper main structure is in a
ICESCE 2024 - The International Conference on Environmental Science and Civil Engineering
150

flexible working state, and the movement is
mainly translational.
FUNDING RESOURCES
Scientific Research Fund project of Yunnan
Education Department in 2023(2023J1611);
The second batch of vocational education teacher
teaching innovation team in Yunnan Province - Civil
engineering inspection technology professional team
of Yunnan Land and Resources Vocational College.
REFERENCES
Tang, J., Li, L., Li, Y., et al., 1996. Design and Research of
Base-Isolated Building with Laminated Rubber
Bearings[J]. Journal of Building Structures, (02): 37-
47+79.
GB 50011-2001, 2008. Code for Seismic Design of
Buildings[S].
Qi, A., Fan, H., 2004. Research on the height-width ratio of
base isolated structure[J]. Journal of Building
Structures, (06): 52-58.
Liu, H., Sha, Z., 2010. In fluence of soil-structre dynamic
in teraction on isolation effect of lead-rubber bearing[J].
Earthquake Engineering and Engineering Vibration,
30(03): 161-165.
Zhou, Y., Wu, C., Zhang, C., Yang, G., 2013. Analysis and
design of seismic isolation structure in outpatient
building of the Lushan County People's Hospital[J].
Building Structure, 43(24): 23-27.
Li, Z., Dong, Y., 2013. Analysis on frame structure with
base isolation[J]. Building Structure, 43(S2): 395-398.
GB50011, 2010. The 2016 edition of the Code for Seismic
Design of Buildings.
CECS 126, 2001. Technical specification for seismic-
isolation with laminated rubber bearing isolators.
Seismic Isolation Analysis of a Multi-Story Frame Structure
151
