
Analyzing Facility Servers Using Random Forest and XGBoost for
Optimized Job Allocation
Potula Radha Nishant
a
and Beena B M
b
Department of Computer Science and Engineering, Amrita School of Engineering,
Bangalore, Amrita Vishwa Vidyapeetham, India
Keywords: Carbon Emission, XG Boost, Green Computing, Cross-Value, Energy Consumption, Energy Conservation.
Abstract: Computer systems consume huge amount of energy causing higher levels of carbon emissions thus polluting
the environment. This study addresses the issue by developing machine learning algorithms to conserve
resources across datacentres. The machine learning models have been developed to predict a higher level
accuracy focusing job level scheduling. The Random Forest used for job scheduling may result in enhancing
performance of green data centres by reducing the energy consumption. Our future research tries to improve
the existing resource management solutions focusing on job level characteristics.
1 INTRODUCTION
It is mind-boggling in the way data centers are
regularly linked to contemporary computing, they
massively contribute to carbon footprint due to the
enormous energy used in supporting servers, storage,
as well as networking systems (Selin, 2024). This
high electricity demand is generally produced from
fossil fuels hence partnering large amounts of carbon
dioxide ( CO2). Also, the devices that help to keep
equipment at an appropriate temperature to operate,
worsens energy utilization, thereby making the power
of the facility high.
Diesel generators that are used during black out
also release CO2 further stressing the importance of
clean up practices. The misuse of resources is viewed
to worsen the environmental effects hence inefficient
utilization of resources, energy and other resources
get wasted.
Flexible resource management will improve the
use of resources, minimise any likelihood of resource
wastage, and closely monitor energy consumption.
Others are scope 3 emissions which include emissions
from the following infrastructure, the equipment of
data center and other related equipment. This research
can be related to several Sustain-
a
https://orcid.org/0009-0009-8855-1643
b
https://orcid.org/0000-0001-9108-7073
able Development Goals, namely, SDG 3 on clean
air quality, SDG 4 through integrating sustainability
into education curricula and materials, SDG 7 for
affordable and clean energy through green jobs and
innovations in the Cloud technology, as well as SDG
8 and 9 through creation of green jobs and
technological innovations respectively. It also helps
in achieving of sustainable development goal 11
(Sustainable cities and communities), SDG12
(Responsible consumption and production),SDG13
(Climate action), SDG15( Life on land) through the
efficiency of resources and minimizing emissions. In
addition, SDG-17 (Partnerships for the Goals)
implementation is backed by cooperation with
industry and academia. It advances the work by
utilizing XGBoost and Random Forest regression
algorithms for efficient job allocation depending on
rack sensor information. it aims at reducing energy
consumption; reducing carbon footprint; and
enhancing resource allocation efficiency in data
center using machine learning methods. This strategy
looks into several concerns in the environment and
opens doors to improve the sustainability processes
for cloud computing platforms.
74
Nishant, P. R. and B M, B.
Analyzing Facility Servers Using Random Forest and XGBoost for Optimized Job Allocation.
DOI: 10.5220/0013577100004639
In Proceedings of the 2nd International Conference on Intelligent and Sustainable Power and Energy Systems (ISPES 2024), pages 74-81
ISBN: 978-989-758-756-6
Copyright © 2025 by Paper published under CC license (CC BY-NC-ND 4.0)

2 LITERATURE SURVEY
This survey focuses upon some of the current
developments in green computing and many energy-
efficient technologies in different areas with
emphasis on innovative techniques for resource
optimization and reduced environmental impact. The
paper gives a thorough survey of fourteen-
cryptography-relevant studies dealing with the
opportunities and challenges in the fields of data
mining, cloud services, and high-performance
computing. They point out that adaptable algorithms
and frameworks are essential in meeting the varying
demands of heterogeneous computer environments,
which in themselves call for sustainability.
2.1 Related Work
Guo et al. (Guo et al., 2023) undertook initial research
on HPC, which exploited sensor data from large-scale
networks to analyze the workload distribution on
energy efficiency, using two techniques- workload
optimization and dynamic core allocation- to
minimize energy and enhance system utilization.
However, these methodologies have problems
regarding multibody systems with diverse
temperature and energy management requirements.
Abbas et al. (Abbas et al., 2023), like Guo et al.,
propose an energy-efficient architecture that depends
on renewable energy sources and consequently one
that favors green computing. Their approach intends
to optimize resource consumption and encourage
sustainable energy use in computing environments.
However, it was deemed, indeed, that creating robust
algorithms that can adapt dynamically to diverse
energy sources is essential for accomplishing
sustainability as well as optimal performance.
Ahmad et al. (Ahmad et al., 2021) carried out an
encompassing literature review in order to find out
the practices and challenges brought by adopting
green cloud computing, but from a client-centric
point. According to their findings, sustainable
practices have to be incorporated in cloud computing
to help lessen the impacts of energy consumption,
environmental responsibility, and reliability of the
services. The creation of complete frameworks
considering the sustainability of hybrid cloud
services, including qualitative studies to consider
their environmental influence, together with
validation of proposed green techniques, remains
open.
Within the field of mobile cloud computing,
Skourletopoulos et al. (Skourletopoulos et al., 2018)
introduce a model of elasticity debt analytics that
aims to optimize resource provisioning, employing a
game- theoretic approach to reduce elasticity debt.
These techniques remain a real challenge in adapting
the model to changing conditions and integrating ML
technologies for enhanced resource utilization.
Raja (Raja, 2021) explains how green computing
can reduce energy waste in the IT sector and further
other approaches to minimize carbon footprints, such
as through energy-efficient data centers and
renewable energy sources. He discusses the potential
of greening initiatives with respect to environmental
sustainability for the IT sector, while flexible
management and control over varied energy demands
will specifically require adaptive solutions.
Qiu et al. (Qiu et al., 2018) discuses on
exploration of how Cloud Service Brokers might
provide new avenues toward energy efficiency and
quality of service through optimized demand
allocation and pricing strategies. While the work by
these authors shows some improvement over that by
others, they still face challenges with real-world
deployment and scalability issues.
Qiu et al. (Qiu et al., 2015) also give an insight
into PCM optimization in Green Cloud Computing
using genetic algorithms aimed at improving memory
usage and efficient resource allocation.
Tuli et al. (Beloglazov and Buyya, 2014)
proposed an energy-aware combinatorial virtual
machine allocation model for minimizing the power
consumption in data centers. This model works well
in static circumstances but the architecture is hemmed
in by open issues regarding the management of
workloads for real-time contexts and requires
adaptive algorithms to scale up with emerging
technologies such as edge computing and IoT.
Alarifi et al. (Xiao and Li, 2018) suggest an
Energy-Effective Hybrid framework for cloud data
centers that differently consolidate and utilize servers.
However, optimization of migration algorithms and
transition to sustainable energy sources are some
open issues still facing researchers in this area.
Chiaraviglio et al. (Chiaraviglio et al., 2014) put
forth a dynamic methodology for online power and
load computation, whereby the server’s power states
can be dynamically altered. This will result in a very
high saving in energy needs. However, many open
problems relating to scalability and multi-objective
optimization remain open.
Kulkarni et al. (Kulkarni et al., 2024) continue
with innovation and creation of cloud-based mood-
driven music recommendation system combining
personalized recommendations from user profiles,
collaborative filtering, and machine learning. The
system, with its scalable architecture is an apt
Analyzing Facility Servers Using Random Forest and XGBoost for Optimized Job Allocation
75

recommendation-on-demand, where contextual
information and listening habits are indigenously
considered while making recommendations. Future
research will focus on enhancing the system’s
responsiveness to evolving user preferences and fine-
tuning recommendation algorithms for different user
categories.
Reddy et al. (Reddy et al., 2023) present the
challenge of predicting flight delays, especially those
induced by bad weather. Having trained various
machine learning algorithms on an integrated dataset
of weather and flight results from JFK airport, they
determined that XGBoost performed best, achieving
an RMSE with a severity of 0.81. The current
obstacles remain improving the model’s
responsiveness to real-time data and addressing other
factors influencing flight delays.
Pecheti et al. (Pecheti et al., 2024) present the
Drug Information and Recommendation System that
draws on Amazon Web Services (AWS) to support
drug review opinions. Their work shows a design
approach involving data collection, preprocessing,
and prediction on drugs ultimately leading to the
deployment of the Sentiment AI platform. The system
ensures both scalability and software security by
utilizing services provided by AWS such as EC2 and
S3 and IAM. Future improvements are intended to
lead an expansion of data sources regarding the
system and improvement of analytical capacity
within the real-world environment.
Reddy et al. (Reddy et al., 2024), proposed a
sentiment analysis model based on Long Short-Term
Memory (LSTM) and natural language processing
algorithms for evaluating user reactions to YouTube
content. Trained on the IMDB dataset alongside
AWS, the model provides an avenue for further
enhancements to widen the dataset for better
generalization whilst working on the interactive
dashboard to aid forward an even deeper user insight.
Selvi, S. et al. (Selvi and Manimegalai, 2024)
Proposed new optimization techniques [Multiverse
Optimization (MVO)], which enhances the efficiency
for task scheduling taking advantage of neighborhood
structures. This approach brings several benefits,
including significantly reduced energy consumption
and degradation of makespan as it can be verified
through laboratory testbed results with improved
performance metrics in contrast to other scheduling
approaches, which we have outlined above. This
study demonstrates that the proposed scheduler will
be able, through experimental evaluation, to schedule
tasks appropriately resulting in minimization of
operational costs for a green cloud computing
environment. Although the results are impressive,
more research is needed to solve these scalability
challenges. There is much more work to do in this
area and there are no clear answers yet on how
effective resource management should be for the
future of cloud computing.
2.2 Research Gap
An integrated approach shows a huge research gap in
pressure, temperature, and water flow sensors’
behavior among racks in data centers while they are
in operation. Even though behavior of individual
sensors is researched on its own, the application of
machine learning models in supporting prediction and
understanding of the collective behavior of multi-
sensor usage in dynamic and intense workload
environments is not clear. Also, another question to
be answered is the training of machine learning
algorithms for analyzing anomalies or inefficiencies
across different sensors, which are revealed through
discrepancies from normal behavior. Of course, these
projects will make data center operations better,
resource usage optimization, and real-time
monitoring more accurate.
3 METHODOLOGY
This paper presents a clear framework for the
systematic creation of predictive models from sensor
data. It is the data transformation, developing
machine learning models, benchmarking and fine
tuning of the models and the solutions ready for
implementation. It goes through the steps of data
acquisition, data preparation, data transformation and
feature extraction, model building, model assessment
and, model refinement, and concerns of model
deployment. Here’s a detailed breakdown of the steps
involved.
3.1 Data Acquisition and Analysis
The raw data consists of data measured by sensors,
and includes data from 20 racks where each rack had
seventy-two servers. In every server employed, job
execution finds 24 cores at its behest. The dataset
includes readings from eleven sensors for each rack,
monitoring various parameters: The following is a list
of links status, rackcdu liquid level, rackcdu pressure,
facility pressure, facility water flow, rackcdu leak
detection, heat load (sampling rate of 60s),facility
water temperature supply, facility water temperature
return, server liquid temperature supply, and server
liquid temperature return. Some of the recognized
ISPES 2024 - International Conference on Intelligent and Sustainable Power and Energy Systems
76
attributes include; Device, Sensor, Time, Value, and
Units where measurements include pressure,
temperature, and Water flow parameters.
3.2 Preprocessing
This means that preprocessing helps with the quality
of the data that will be fed into a machine learning
algorithm as well as how consistent that data is. The
units are normalized against each other in accordance
with each sensor’s specific type, where each type is
assigned its index. It is in this normalization that
uniformities as well as accurate training models are
made possible. The case when a have missing or
inconsistent values of data points is a typical problem
of preprocessing; such methods as interpolation or
data imputation are applied to complete the gaps as
well as to manage outliers, thus preparing a suitable
data set for the model.
3.3 Feature Selection
Feature engineering is more important, where all
these features are chosen and structured or formatted
in such a way that would take good results on the
predictive models. In this regard, the analysis of the
sensor data leads to the mapping of the values to
particular labels including the facility water flow or
server liquid temperature of the system which serves
as the features in the training model phase.
Feature selection is performed according to the
measures’ importance and relevance to the target
variable, for example, for heat load or water
temperature prediction. There is no doubt that having
domain knowledge is very important in selecting the
most significant features. Furthermore, there could be
literals conducted to achieve new features that are
more suitable for revealing the interdependencies
inside the data to improve the model’s predictability.
In this study, two features were selected. They are:
• Units: The Type of Measurement of sensors in the
datacentres for a particular period of time.
• Value: The Result of measurement of sensors in the
datacentres for a particular period of time.
3.4 Model Training and Evaluation
For the predictive modeling step, the machine
learning algorithms are used, such as regression
models: Random Forest and XGBoost. Both
algorithms are a kind of learning algorithms that are
used to forecast target variable based on the input of
characteristic sensors. Hyperparameter tuning is then
done in each model for better results, all of them have
been trained on the pre-processed and the features
that were engineered.
Before defining the hyperparameters, they have to be
tuned properly by using the grid search or randomized
search, which ensures higher accuracy and model
generalization. Case of Random Forest, other
parameters like number of estimators and tree depth
are tuned while for XGBoost the boosting parameters
such as learning rate and maximum tree depth are
tuned.
The effectiveness of the models is estimated using
Mean Squared Error (MSE), Root Mean Squared
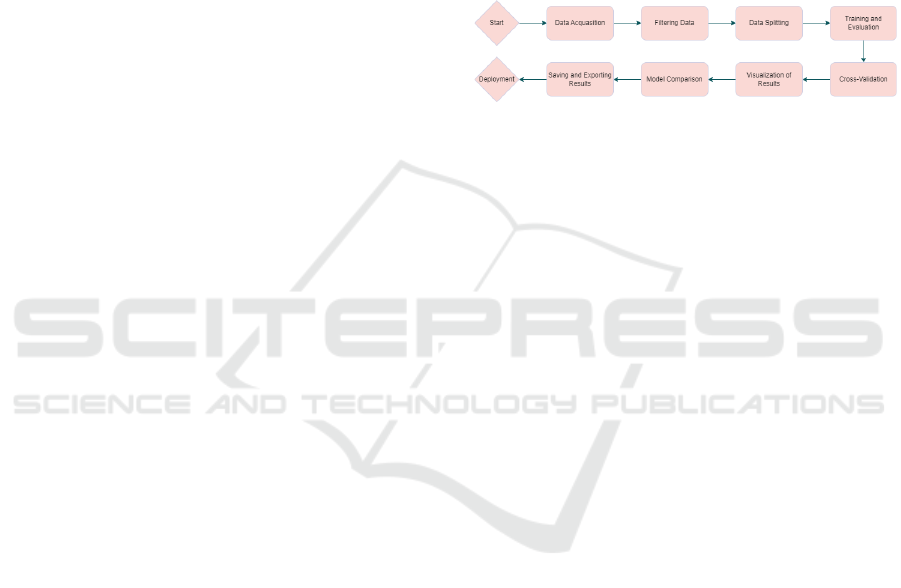
Figure 1: Model Architecture
Error (RMSE), Mean Absolute Error (MAE), and the
Coefficient of Determination (R2). These are
information on the performance of the model and it
capability in predicting on unseen data.
Cross-validation is used to overcome the problem of
overfitting so that inherited property prediction is
made with high reliability. It attempts to divide the
data into the training and the validation part many
times, with each new model acting on a different
division. This approach offers a complete evaluation
of the different model performance on different data
samples and the necessary adjustments are made.
Optimization of a model goes further from the given
training to improve the prediction capability and
reduce computation time. Algorithm-specific
optimizations are the following ones: for example, in
case of Random Forest, the importance of features is
used to prune less important features. In the case of
XGBoost, there are tuning parameters like the
number of iterations boosting the model, learning
rate, and maximum depth are set in detail to optimize
the model’s efficiency.
3.5 Overview
The below Fig. 1 outlines a comprehensive machine
learning workflow, starting with Data Acquisition to
gather relevant data, followed by Filtering Data to
clean and preprocess it. The process continues with
Data Splitting to create training and testing sets, then
moves to Training and Evaluation of models, often
incorporating Cross-Validation to optimize
performance. After training, Visualization of Results
provides insights through graphical representation,
Analyzing Facility Servers Using Random Forest and XGBoost for Optimized Job Allocation
77
followed by Model Comparison to identify the best-
performing model. The results are then Saved and
Exported, and the workflow concludes with
Deployment, where the refined model is implemented
for real-world use.
4 RESULTS AND ANALYSIS
Table 1 also demonstrates the performance of the
model Random Forest Regressor using Mean
Absolute Error (MAE),Mean Squared Error (MSE)
Root Mean Squared Error (RMSE) and R-squared
(R2) of twenty different racks. Both 70/30 and 80/20
splits are provided also with/without cross-validation.
This is demonstrating how cross-validation affects
the prediction by having some cases with increased
R2 than others with a worse performance when cross-
validation is applied. Rear observations are high R2
values-the values literally near or more than 0.95 for
most racks without cross validating and cross
validating has shown much less values that can be
good indicators of overfitting racks. Moreover,
improvements are noticed when cross-validation is
incorporated in some racks especially Rack 16 whose
R2 rises to as high as 0.445 in the loop.
Table 1: Rack Wise Results for RF Regressor only for
Numeric Values
Rack
no.
Split CV MAE MSE R2
Rack 1
70/30 No 58.621 64189.336 0.996
70/30 Yes 2917.325 2756325.59 -0.836
80/20 No 58.472 64661.218 0.996
80/20 Yes 2917.325 2756325.59 -0.836
Rack 2
70/30 No 56.3 48833.29 0.994
70/30 Yes 560.939 1273912.904 0.948
80/20 No 56.39 49663.522 0.993
80/20 Yes 560.939 1273912.904 0.948
Rack 3
70/30 No 35.682 25434.312 0.989
70/30 Yes 699.939 3608070.746 0.69
80/20 No 34.947 23347.428 0.99
80/20 Yes 699.939 3608070.746 0.69
Rack 4
70/30 No 65.503 111249.705 0.973
70/30 Yes 865.975 4039189.745 0.73
80/20 No 62.672 110123.774 0.974
80/20 Yes 865.975 4039189.745 0.73
Rack 5
70/30 No 150.078 439327.808 0.875
70/30 Yes 1656.948 18500900.81 -0.16
80/20 No 49.89 42524.393 0.997
80/20 Yes 1656.948 18500900.81 -0.16
Rack 6
70/30 No 49.423 38197.812 0.992
70/30 Yes 1371.369 5677594.478 -0.143
80/20 No 49.065 38118.672 0.992
80/20 Yes 1371.369 5677594.478 -0.143
70/30 No 33.622 39029.145 0.952
Rack 7
70/30 Yes 1394.243 7975824.019 0.018
80/20 No 34.002 16941.352 0.998
80/20 Yes 1394.243 7975824.019 0.018
Rack 8
70/30 No 35.233 20647.193 0.997
70/30 Yes 1394.243 7975824.019 0.018
80/20 No 34.002 16941.352 0.998
80/20 Yes 1394.243 7975824.019 0.018
Rack 9
70/30 No 113.636 260977.59 0.982
70/30 Yes 1611.013 17412938.19 -0.18
80/20 No 114.719 268206.437 0.982
80/20 Yes 1611.013 17412938.19 -0.18
Rack 10
70/30 No 190.414 433605.361 0.943
70/30 Yes 1719.228 8069397.218 -0.141
80/20 No 185.795 423796.024 0.878
80/20 Yes 1719.228 8069397.218 -0.141
Table 2 illustrates the performance of the XG-Boost
Regressor model on 20 different racks with numeric
test data based on MAE, MSE, RMSE, and R2. We
report results for four splits 70/30 and 80/20 with and
without CV. In general, the R2 values are high (above
0.9) though it does not apply cross-validation but
when applying cross-validation, the vast racks such
as Rack 1 that originally had an R2 of 0.147,
drastically drop hugely to an R2 if -1.643. Even more,
some racks, namely Rack 5 and Rack 6, also
demonstrate the decrease in the value of R2 after the
cross validation, which also points to the overtraining
of models. However, some racks, for instance, Rack
16 have a positive R2 of 0.992 without cross-
validation but a negative value with cross-validation.
The results emerge in terms of the inconsistency of
utilising cross-validation in the XGBoost model,
where the variation of R2 values and errors is large
among different racks.
Table 2: Rack Wise Results using XGBoost Regressor for
Numeric Values Test Data 10 Racks
Rack
No.
Split CV MAE MSE R2
Rack 1
70/30 No 66.783 82676.425 0.994
70/30 Yes 3536.528 39687716.82 -1.643
80/20 No 66.891 86840.584 0.994
80/20 Yes 3536.528 39687716.82 -1.643
Rack 2
70/30 No 70.161 102338.714 0.995
70/30 Yes 576.594 1422092.694 0.943
80/20 No 69.154 98179.045 0.995
80/20 Yes 576.594 1422092.694 0.943
Rack 3
70/30 No 63.298 106335.139 0.991
70/30 Yes 698.085 3545491.34 0.691
80/20 No 62.871 107386.452 0.991
80/20 Yes 698.085 3545491.34 0.691
Rack 4
70/30 No 70.562 157762.494 0.99
70/30 Yes 890.744 14535632.96 -0.607
80/20 No 127.833 1638371.263 0.928
ISPES 2024 - International Conference on Intelligent and Sustainable Power and Energy Systems
78
80/20 Yes 1530.762 2014891.83 -0.212
Rack 5
70/30 No 72.424 104194.679 0.993
70/30 Yes 1655.008 18499826.64 -0.16
80/20 No 71.682 102993.421 0.994
80/20 Yes 1655.008 18499826.64 -0.16
Rack 6
70/30 No 60.03 75719.105 0.985
70/30 Yes 1705.83 8809078.817 0.069
80/20 No 257.811 414063.18 0.93
80/20 Yes 1653.531 9372708.78 0.079
Rack 7
70/30 No 46.446 62130.995 0.986
70/30 Yes 1885.324 16551543.82 -1.038
80/20 No 46.645 55290.557 0.993
80/20 Yes 1885.324 16551543.82 -1.038
Rack 8
70/30 No 70.711 148246.431 0.992
70/30 Yes 2133.422 26405897.6 -0.515
80/20 No 70.766 149922.959 0.992
80/20 Yes 2133.422 26405897.6 -0.515
Rack 9
70/30 No 134.751 408264.553 0.976
70/30 Yes 1639.415 17501719.73 -0.186
80/20 No 136.184 4068378.53 0.976
80/20 Yes 1639.415 17501719.73 -0.186
Rack 10
70/30 No 117.404 308557.061 0.987
70/30 Yes 1540.57 18859281.3 -0.141
80/20 No 115.255 303458.405 0.982
80/20 Yes 1540.57 18859281.3 -0.141
Comparison of Table 1 and Table 2 show that the RF
Regressor has effectively learned from the data and
consistently performs well across rakes and data
splits, as evidenced by the higher R² values, often
approaching or exceeding 0.9; thereby confirming a
strong correlation between predicted and actual
values. For example, in Rack 1 with a 70/30 split and
no cross-validation, the RF Regressor records 0.996
R², while XGBoost gets 0.994. As against the
performance of the RF Regressor, the XGBoost
Regressor shows massive variability in performance-
and wades through the data it learns awfully even
under similar conditions. Many of the R² values are
negative or very close to 0-in particular, for the 80/20
splits-suggesting that XGBoost does not capture the
underlying patterns well. For example, Rack 10’s R²
was -0.141 at an 80/20 split with cross-validation for
XGBoost, while the same scenario for RF Regressor
resulted in 0.968.
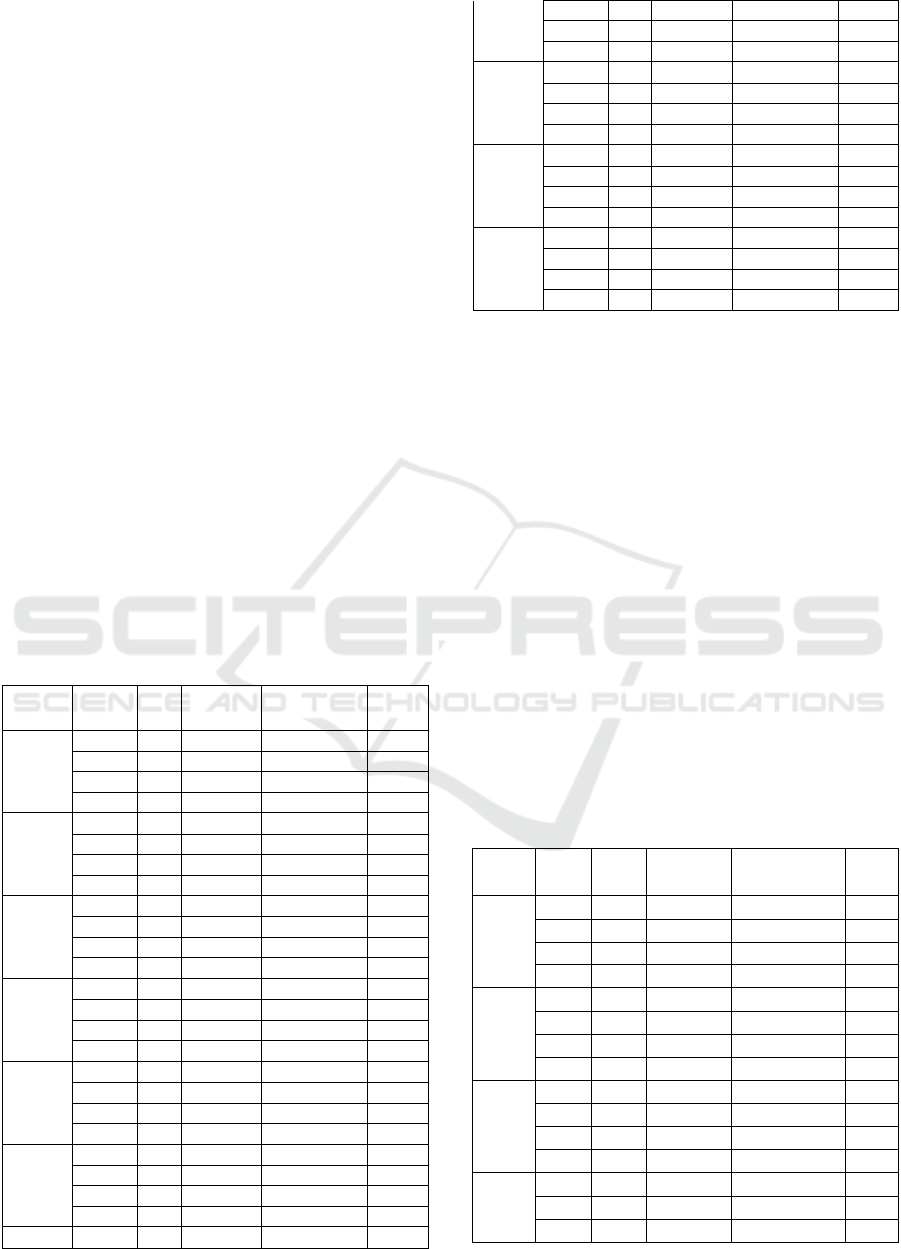
The two graphs shown in Fig. 2 (a), (b) presents the
predicted vs. true values of a Random Forest model,
its performance with and without cross- validation is
highlighted. In the first graph Points are blue and
scattered but their corresponding points seem to lie
near the ideal fit line but not completely perfect as
some of them are a little farther, this is because of
overfitting but not a serious one. In comparison, the
second graph where the residuals were corrected with
cross-validation presents green points away from the
ideal fit line more often and specially at higher values,
which suggests lower reliability and stochasticity in
the validation folds.
(a) Rack 4 in 70:30 Split ratio
(b) Rack 4 in 80:20 split Ratio
Figure 2: Scatter Plot between True Values and Predicted
Values in Random Forest Regressor for Rack 4
(a)
Rack 10 in 70:30 Split ratio
(b) Rack 10 in 80:20 split Ratio
Figure 3: Scatter Plot between True Values and Predicted
Values in Random Forest Regressor for Rack 10
This comparison shows the model’s performance
to cross-validation and the difficulty of maintaining a
stable level of predictive accuracy across different
data splits.
Analyzing Facility Servers Using Random Forest and XGBoost for Optimized Job Allocation
79
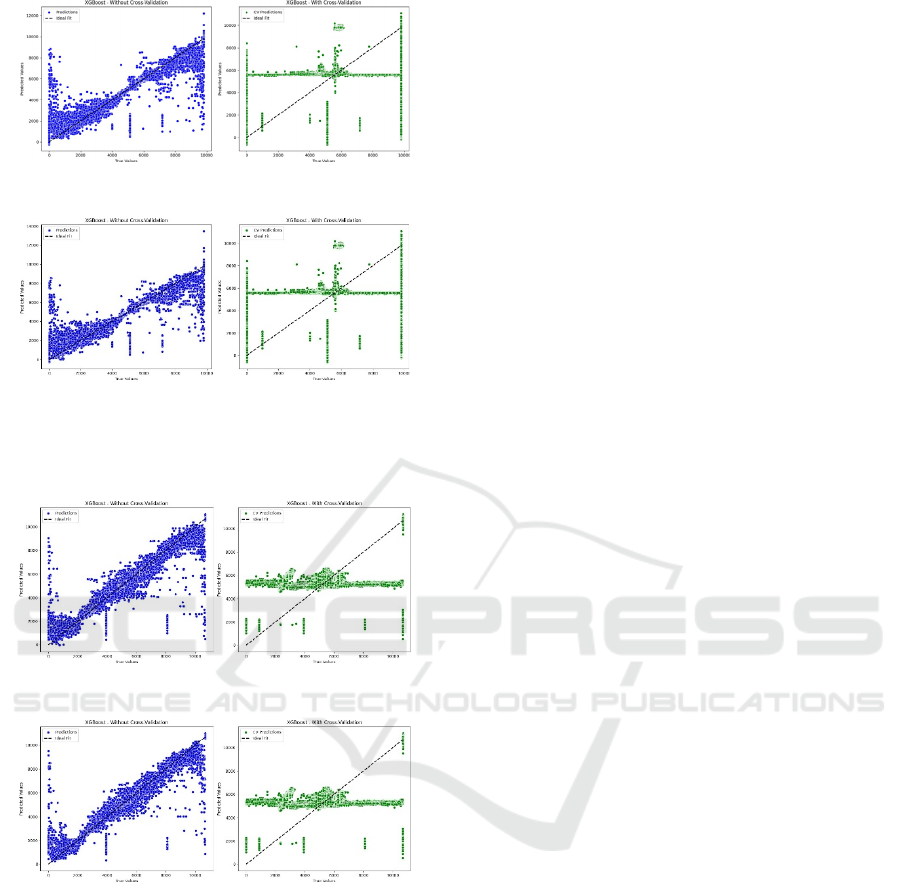
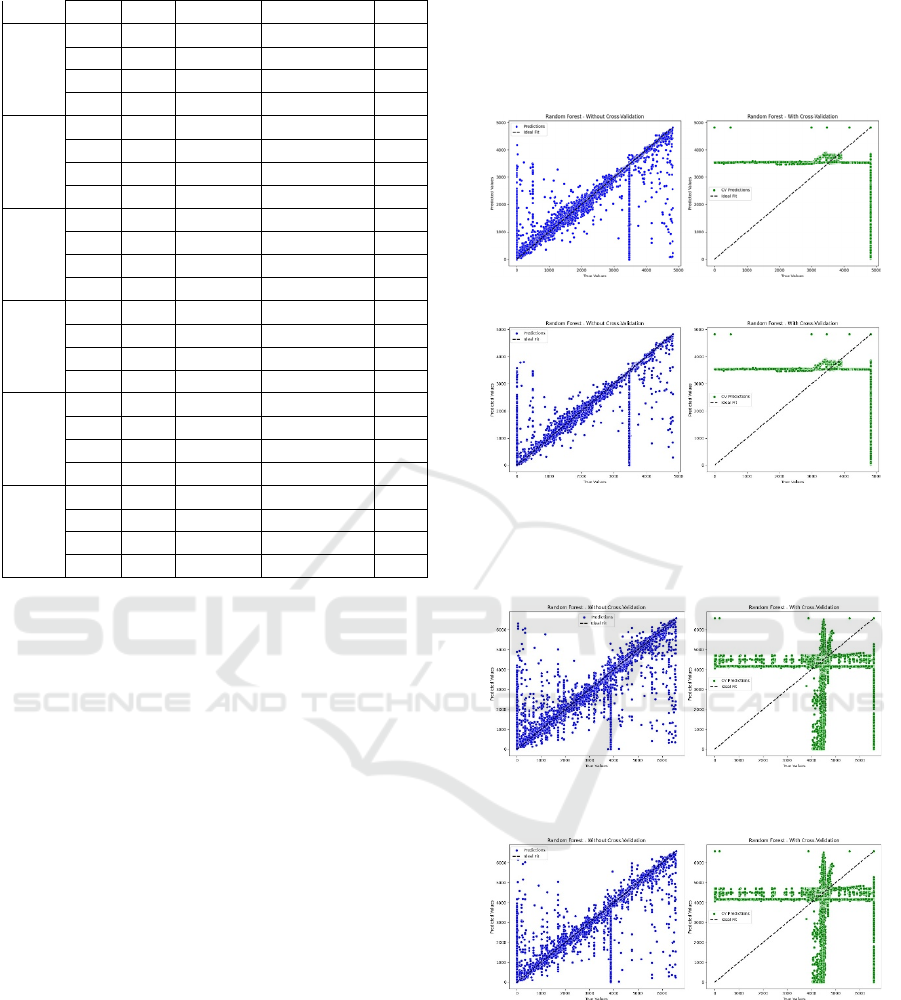
(a) Rack 3 in 70:30 Split ratio
Rack 3 in 80:20 split Ratio
Figure 4: Scatter Plot between True Values and Predicted
Values in XGBoost Regressor for Rack 3
Rack 6 in 70:30 Split ratio
Rack 6 in 80:20 split Ratio
Figure 5: Scatter Plot between True Values and Predicted
Values in XGBoost Regressor for Rack 6
The two plots above Fig. 5 (a), (b) illustrates the
comparison between the XGBoost model
performance with the model which include the cross
Validation for Rack 6. The left plot shows the results
when cross-validation is not done while the
predictions are depicted using blue circles. The
correct plot includes cross-validation check, and
predictions are marked in green dots. PredPol: In both
the plots above, the dotted line line indicates the
Which indicates the true positive or perfect fit line
that equates the true values to the predicted values.
Also, when making predictions without using cross-
validation they seem to be distributed farther and are
a less accurate representation of the ideal line because
of this, the line on the right shows how predictions
with cross-validation look like and demonstrate how
cross-validation affects the consistency and ability to
generalize when making predictions. This
comparative analysis discusses the effect of cross-
validation on the result of the model, in terms of
accuracy and behavior.
5 CONCLUSIONS
This research shows how a Random Forest and XG-
Boost can be used to identify outliers in a data centres.
From regression tasks in these models, meaning- ful
information regarding the performance of different
types of racks was obtained. More work in the future
will be towards the analysis and prediction of patterns
of job assignments using the sensors. Moreover, the
use of these models to create simulation environments
should be the focus of future research because it will
allow better control over data center management.
ACKNOWLEDGEMENTS
Sincere gratitude is expressed to the university,
Amrita Vishwa Vidyapeetham and Dr. Beena B. M.,
for their assistance in writing the paper.
REFERENCES
Abbas, G., Hatatah, M., Ali, A., Touti, E., Alshahir, A., and
Elrashidi, A. M. (2023). A novel energy proficient
computing framework for green computing using
sustainable energy sources. IEEE Access, 11:126542–
126554.
Ahmad, A., Khan, S. U., Khan, H. U., Khan, G. M., and
Ilyas, M. (2021). Challenges and practices
identification via a systematic literature review in the
adoption of green cloud computing: client’s side
approach. IEEE Access, 9:81828– 81840.
Beloglazov, A. and Buyya, R. (2014). An energy- aware
combinatorial virtual machine allocation and placement
model for green cloud computing. In Proceedings of the
International Conference on Cloud Computing and
Technology (Cloud- Com), pages 1–8, Sydney,
Australia.
Chiaraviglio, L., Mellia, M., and Neri, F. (2014). Eco-aware
online power management and load scheduling for
green cloud datacenters. IEEE Transactions on
Networking, 22(1):1–14.
ISPES 2024 - International Conference on Intelligent and Sustainable Power and Energy Systems
80

Guo, Z., Li, J., and Ramesh, R. (2023). Green data analytics
of supercomputing from massive sensor networks:
Does workload distribution matter? Information
Systems Research, 34(4):1664–
1685.
Kulkarni, V. V., Vishal, S., and Beena, B. (2024). Cloud
based music recommendation system. Available at
SSRN 4814206.
Pecheti, S. T., Kodurupaka, N., Basavadeepthi, H. M.,
Tanvi, T., and Beena, B. M. (2024). Leveraging cloud
computing for drug review analysis. In SCI, pages 150–
160.
Qiu, C., Shen, H., and Chen, L. (2018). Towards green
cloud computing: Demand allocation and
pricing policies for cloud service brokerage.
IEEE Transactions on Big Data, 5(2):238–251. Qiu, M.,
Ming, Z., Li, J., Gai, K., and Zong, Z.
(2015). Phase-change memory optimization for
green cloud with genetic algorithm. IEEE Transactions on
Computers, 64(12):3528–3540.
Raja, S. P. (2021). Green computing and carbon footprint
management in the it sectors. IEEE Transactions on
Computational Social Systems, 8(5):1172–1177.
Reddy, P. N., Aswath, S. S., Alapati, R., and Beena,
B. M. (2024). Aws enhanced sentiment analysis using lstm
for online video comments. In SCI, pages 193–205.
Reddy, R. T., Pati, P. B., Deepa, K., and Sangeetha,
S. T. (2023). Flight delay prediction using machine
learning. In IEEE 8th International Conference for
Convergence in Technology (I2CT), Lonavla, India.
Selin, N. E. (2024). Carbon footprint.
Encyclopaedia Britannica. Available:
https://www.britannica.com/science/carbon- footprint.
Selvi, S. and Manimegalai, D. (2024). A neigh- borhood
inspired multi-verse scheduler for energy and
makespan optimized task scheduling for green cloud
computing systems. International Journal of
Information and Computer Security, 16(2):123–145.
Skourletopoulos, G., Mavromoustakis, C. X., Mastorakis,
G., Batalla, J. M., Song, H., Sahalos,
J. N., and Pallis, E. (2018). Elasticity debt analytics
exploitation for green mobile cloud computing: An
equilibrium model. IEEE Transactions on Green
Communications and Networking, 3(1):122–131.
Xiao, Y. and Li, Z. (2018). Energy-efficient hybrid
framework for green cloud computing. IEEE
Transactions on Green Communications and
Networking, 2(2):202–212.
Analyzing Facility Servers Using Random Forest and XGBoost for Optimized Job Allocation
81
