
Study on the Changes in Arable Land Resources and Driving Forces
in the Three Northeastern Provinces of China Based on Urbanization
Yamin Du
1,2,3,4
a
, Qiao Yang
1,2,3,4
b
and Yin Shen
1,2,3,4,*
c
1
Land Consolidation and Rehabilitation Center, Ministry of Natural Resources, Beijing 100035, China
2
Land Science and Technology Innovation Center, Ministry of Natural Resources, Beijing 100035, China
3
Technology Innovation Center for Land Engineering, Ministry of Natural Resources, Beijing 100035, China
4
Key Laboratory of Land Consolidation and Rehabilitation, Ministry of Natural Resources, Beijing 10035, China
*
Keywords: Urbanization, Three Northeastern Provinces, Changes in Arable Land Resources, Driving Forces, Principal
Component Analysis.
Abstract: Urbanization, as a complex interdisciplinary social phenomenon, spans across sociology, economics, and
geography, with its core manifestation being the large-scale aggregation and migration of populations from
rural to urban areas. This study focuses on the northeastern region of China, specifically Liaoning, Jilin, and
Heilongjiang provinces, covering the period from 2000 to 2021. The objective is to examine the impact of
urbanization on the quantity of arable land resources and to explore its relationship with socio-economic
development. Firstly, a comprehensive and detailed analysis of the effects of urbanization on arable land
resources is conducted. Secondly, quantitative methods such as Principal Component Analysis (PCA) and
Multiple Linear Regression (MLR) are employed to systematically investigate the driving factors behind the
changes in arable land resources, revealing the underlying patterns within the urbanization process. The
findings of this research not only provide theoretical support for advancing new urbanization planning in the
three northeastern provinces, promoting urbanization processes, and protecting arable land resources, but also
hold practical significance for guiding related policy formulation and implementation.
1 INTRODUCTION
This study focuses on the three northeastern
provinces of China and employs quantitative research
methods, including Principal Component Analysis
(PCA) and Multiple Linear Regression (MLR), to
thoroughly examine the dynamic driving factors
behind changes in arable land resources from 2000 to
2021. By delving deeply into statistical data, the
research reveals the complex and diverse roles of
various factors in the alteration of arable land
resources (
YU
et al.
, 2022
).
a
https://orcid.org/0009-0001-9505-8947
b
https://orcid.org/0000-0002-9227-7757
c
https://orcid.org/0009-0007-5626-854X
2 STUDY AREA OVERVIEW
Liaoning Province, located to the east of the Bohai
Sea, is a significant coastal region. Its geographic
environment is diverse, featuring both plains and
mountainous areas along with a coastline. Jilin
Province, adjacent to Russia and bordered by North
Korea to the east, holds a strategically important
position. Heilongjiang Province, situated to the east
of Northeast Asia and Russia, boasts abundant natural
resources and a varied topography (
ZHANG
et al.
,
2022
).
78
Du, Y., Yang, Q., Shen and Y.
Study on the Changes in Arable Land Resources and Dr iving Forces in the Three Northeastern Provinces of China Based on Urbanization.
DOI: 10.5220/0013573800004671
In Proceedings of the 7th International Conference on Environmental Science and Civil Engineering (ICESCE 2024), pages 78-84
ISBN: 978-989-758-764-1; ISSN: 3051-701X
Copyright © 2025 by Paper published under CC license (CC BY-NC-ND 4.0)
3 DATA AND METHODS
3.1 Data Sources
This study employs a systematic scientific approach
to ensure the research's rigor, feasibility, and
adherence to data acquisition principles. We
extensively utilized multidimensional data resources
provided by the "Liaoning Statistical Yearbook," the
"Jilin Statistical Yearbook," and the "Heilongjiang
Statistical Yearbook," encompassing a range of data
including population, economic indicators, and arable
land. These data sources are highly reliable and
authoritative, providing a solid foundation for the
study and ensuring the accuracy and credibility of the
results (
WANG et al., 2021).
3.2 Research Content and Methods
The study will employ Principal Component Analysis
(PCA) to develop a model of the driving factors
behind changes in arable land resources in the
research area. Through PCA, correlation analysis, and
regression analysis, we will thoroughly elucidate the
mechanisms driving changes in arable land quantity
(
YE et al., 2019). This research will quantitatively
examine indicators such as population growth,
economic development, and social progress, as
detailed in Table 1.
4 RESULTS AND ANALYSIS
4.1 Changes in Arable Land Resources
Over the past 21 years (2000 to 2021), the total arable
land resources in Northeast China—comprising
Liaoning Province, Jilin Province, and Heilongjiang
Province—have exhibited a consistent upward trend.
According to the research data, from 2000 to 2021,
the total arable land in Liaoning Province increased
from 4.0821 million hectares in 2000 to 5.1594
million hectares in 2021, with an average annual
increase of 51,300 hectares, representing a 26.39%
growth compared to the total arable land at the
beginning of the study period. In Jilin Province,
arable land resources grew from 5.0833 million
hectares in 2000 to 7.4985 million hectares in 2021,
with an average annual increase of 115,000 hectares,
reflecting a 47.51% increase relative to the total
arable land at the start of the period (
HOU et al., 2023).
Heilongjiang Province saw its arable land resources
rise from 11.7731 million hectares to 17.1660 million
hectares, with an average annual growth of 256,800
hectares, demonstrating a notable growth trend and a
45.80% increase from the beginning of the study
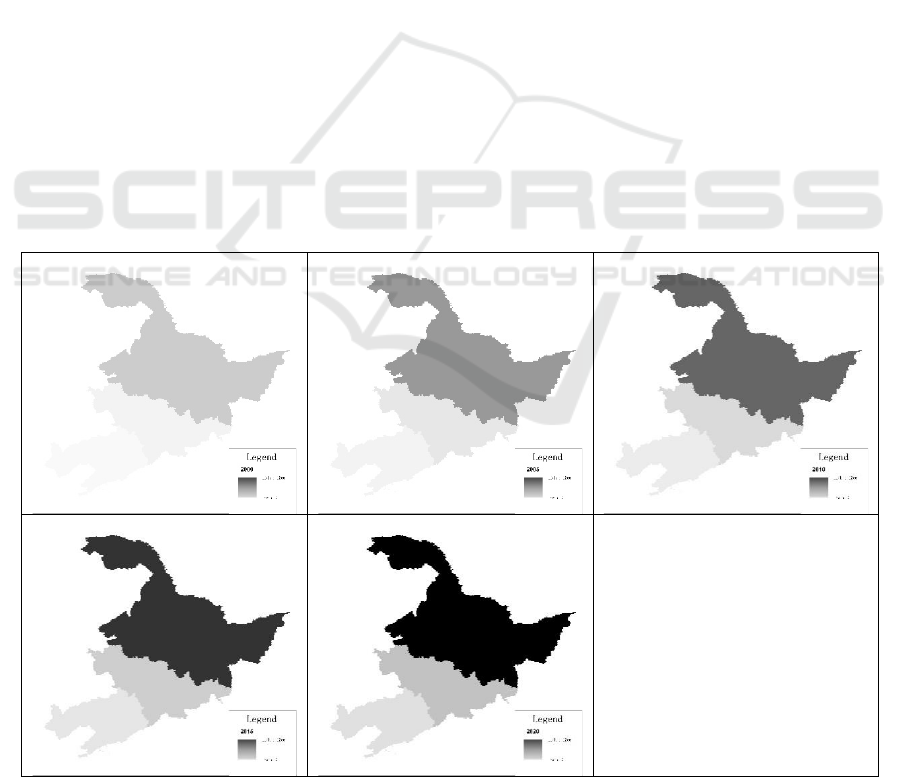
period (Figure 1).
Figure 1: Changes in Arable Land Resources in the Three Northeastern Provinces (2000-2021).
Study on the Changes in Arable Land Resources and Driving Forces in the Three Northeastern Provinces of China Based on Urbanization
79
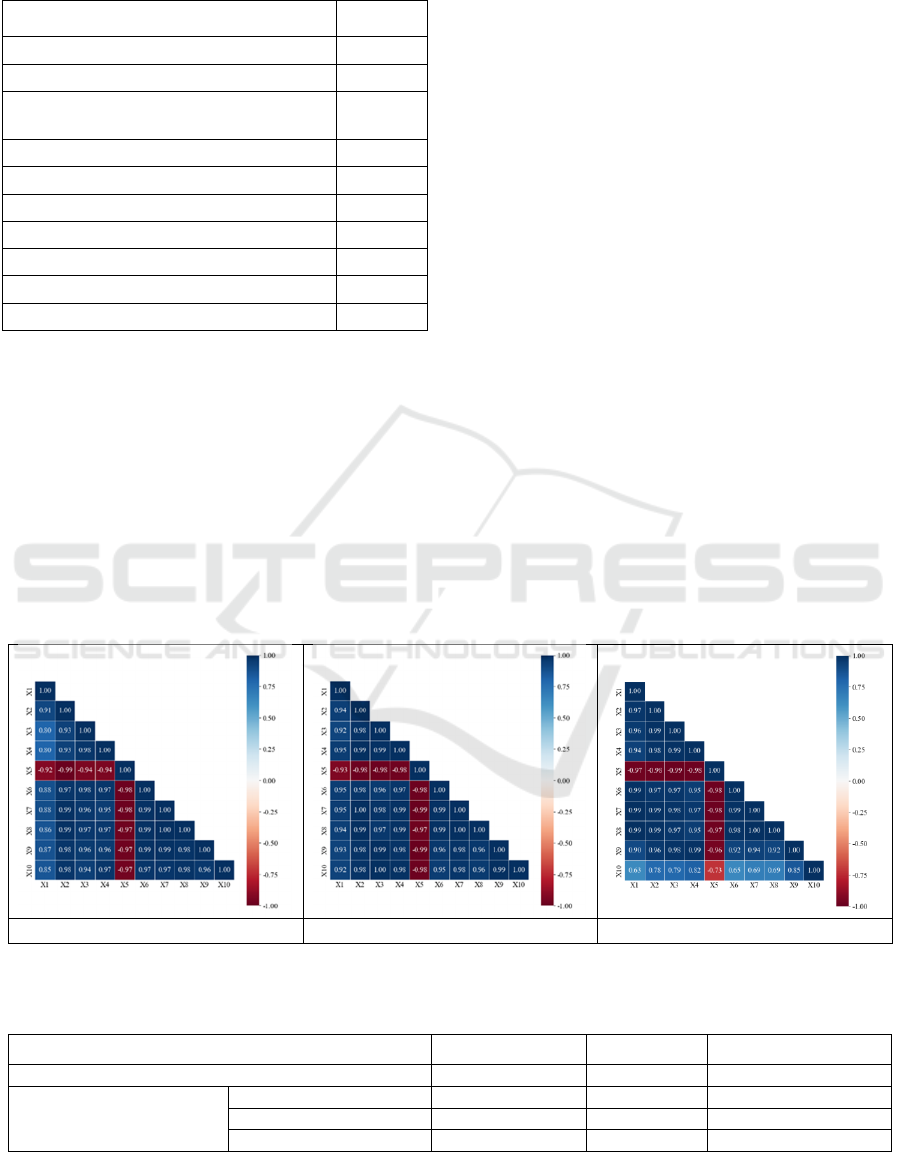
Table 1: Indicator System for Driving Forces of Arable
Land Resource Changes.
Indicator Variable
Urban Po
p
ulation Pro
p
ortion
x
1
Per Capita GDP
x
2
Fixed Asset Investment in Secondary
Industry
x
3
Fixed Asset Investment in Tertiar
y
Industr
y
x
4
Secondary Industry Output Ratio
x
5
Tertiar
y
Industr
y
Out
p
ut Ratio
x
6
Dis
p
osable Income of Urban Residents
x
7
Per Capita Net Income of Rural Residents
x
8
Built-u
p
Area
x
9
Real Estate Development Investment
x
10
4.2 Drivers of Changes in Arable Land
Resources
4.2.1 Indicators and Evaluation
(a) Correlation Test of Initial Variables
Figure 2 presents the correlation coefficient matrix
for the ten indicators affecting arable land resources.
This study aims to analyze the interrelationships
among these indicators to uncover their intrinsic
network of relationships (
XIE
et al.
, 2023
). The
correlation coefficient matrix reveals that in Liaoning
Province, the indicators generally exhibit correlations
above 0.80, in Jilin Province above 0.90, and in
Heilongjiang Province above 0.60, highlighting a
significant degree of correlation among the provinces
in Northeast China.
(b) KMO Test and Bartlett's Test of Sphericity
The statistical results distinctly indicate the
significance of both the KMO test and Bartlett's test
of sphericity, thereby affirming the suitability of
principal component analysis (
Ma
et al.
, 2023
).
Consequently, it can be concluded that the dataset
demonstrates reliability for principal component
analysis, with the potential to effectively extract the
principal factors (Table 2).
4.2.2 Eigenvalues and Contribution Rates
The results of the principal component analysis reveal
the underlying structure of the ten variables and their
associated data (
GUAN
et al.
, 2023
). Notably, the
cumulative contribution rates of the first two principal
components are as high as 98.294% for Liaoning
Province, 98.689% for Jilin Province, and 98.815%
for Heilongjiang Province, all significantly exceeding
the recommended statistical threshold. This indicates
that the primary factors can be effectively represented
by the first two principal components (
YE
et al.
, 2023
),
F
1
and F
2
(Table 3).
Liaoning Province Jilin Province Heilongjiang Province
Figure 2: Correlation Coefficient Matrix of Variables.
Table 2: KMO and Bartlett's Test for Arable Land Resources.
Liaoning Province Jilin Province Heilongjiang Province
KMO Measure of Sam
p
lin
g
Ade
q
uac
y
0.813 0.862 0.87
Bartlett's Test of Sphericity
Approximate Chi-Square 637.807 715.654 674.224
Degrees of Freedom 45 45 45
Si
g
nificance 0 0 0
ICESCE 2024 - The International Conference on Environmental Science and Civil Engineering
80
Table 3: Principal Component Analysis.
province Component
Initial Eigenvalues Extracted Sum of Squares Loadings Rotated Sum of Squares Loadings
Total
Contribution
Rate
Cumulative
Contribution
Rate
Total
Contributio
n Rate
Cumulative
Contribution
Rate
Total
Contribution
Rate
Cumulative
Contribution
Rate
Liaoning
Province
F
1
9.554 95.541 95.541 9.554 95.541 95.541 6.049 60.489 60.489
F
2
0.275 2.753 98.294 0.275 2.753 98.294 3.78 37.805 98.294
F
3
0.065 0.647 98.942
Jilin
Province
F
1
9.747 97.467 97.467 9.747 97.467 97.467 5.4 53.998 53.998
F
2
0.122 1.223 98.689 0.122 1.223 98.689 4.469 44.692 98.689
F
3
0.067 0.668 99.358
Heilongjiang
Province
F
1
9.344 93.438 93.438 9.344 93.438 93.438 6.838 68.38 68.38
F
2
0.538 5.376 98.815 0.538 5.376 98.815 3.043 30.434 98.815
F
3
0.069 0.686 99.5
Table 4: Rotated Component Loadings and Component Score Coefficients Matrix.
Liaoning Province Jilin Province Heilongjiang Province
Rotated
Component
Matrix
Component Score
Coefficients Matrix
Rotated
Component
Matrix
Component Score
Coefficients Matrix
Rotated
Component
Matrix
Component Score
Coefficients Matrix
1 2 1 2 1 2 1 2 1 2 1 2
x
1
0.448 0.888 -0.875 1.276 0.539 0.828 -1.309 1.588 0.938 0.335 0.303 -0.286
x
2
0.731 0.672 -0.099 0.296 0.741 0.664 0.109 0.031 0.848 0.525 0.098 0.045
x
3
0.877 0.45 0.491 -0.465 0.817 0.571 0.768 -0.695 0.831 0.549 0.069 0.09
x
4
0.884 0.443 0.513 -0.493 0.741 0.664 0.11 0.031 0.791 0.6 0.004 0.192
x
5
-0.726 -0.677 0.113 -0.314 -0.763 -0.633 -0.315 0.196 -0.873 -0.47 -0.157 0.051
x
6
0.806 0.583 0.162 -0.038 0.666 0.732 -0.445 0.64 0.928 0.361 0.277 -0.243
x
7
0.788 0.607 0.095 0.047 0.72 0.69 -0.071 0.23 0.908 0.413 0.224 -0.157
x
8
0.819 0.565 0.21 -0.1 0.695 0.706 -0.232 0.407 0.906 0.406 0.228 -0.164
x
9
0.795 0.588 0.137 -0.007 0.805 0.584 0.672 -0.59 0.738 0.656 -0.072 0.309
x
10
0.813 0.556 0.218 -0.112 0.818 0.568 0.784 -0.713 0.334 0.937 -0.539 1.012
4.2.3 Establishment of Principal Component
Linear Models
Based on the principal component score coefficient
tables (Table 4), the final principal component score
formulas for the three northeastern provinces are
derived as follows (Fa represents Liaoning Province,
F
b
represents Jilin Province, and Fc represents
Heilongjiang Province) (Li et al., 2023):
F
a1
=-0.875x
1
-0.099x
2
+0.491x
3
+0.513x
4
+0.113x
5
+0.1
62x
6
+0.095x
7
+0.210x
8
+0.137x
9
+0.218x
10
(1)
F
a2
=1.276x
1
+0.296x
2
-0.465x
3
-0.493x
4
-0.314x
5
-0.038
x
6
+0.047x
7
-0.100x
8
-0.007x
9
-0.112x
10
(2)
F
b1
=-1.309x
1
+0.109x
2
+0.768x
3
+0.110x
4
-0.315x
5
-0.4
45x
6
-0.071x
7
-0.232x
8
+0.672x
9
+0.784x
10
(3)
F
b2
=1.588x
1
+0.031x
2
-0.695x
3
+0.031x
4
+0.196x
5
+0.64
0x
6
+0.230x
7
+0.407x
8
-0.590x
9
-0.713x
10
(4)
F
c1
=0.303x
1
+0.098x
2
+0.069x
3
+0.004x
4
-0.157x
5
+0.27
7x
6
+0.224x
7
+0.228x
8
-0.072x
9
-0.539x
10
(5)
F
c2
=-0.286x
1
+0.045x
2
+0.090x
3
+0.192x
4
+0.051x
5
-0.2
43x
6
-0.157x
7
-0.164x
8
+0.309x
9
+1.012x
10
(6)
4.2.4 Comprehensive Score
Based on the findings of this study, the
comprehensive evaluation model for principal
components is calculated using the proportion of each
principal component's eigenvalue relative to the sum
of the eigenvalues of the extracted principal
components as weights (
Zhang et al., 2022):
F=
∑
𝜆
𝐹
=𝜆
𝐹
+𝜆
𝐹
(7)
In the equation above, F represents the
comprehensive score for the variation in arable land
resources across the northeastern provinces; 𝜆
denotes the eigenvalue of the k-th principal
component (where k=1,2).
Study on the Changes in Arable Land Resources and Driving Forces in the Three Northeastern Provinces of China Based on Urbanization
81
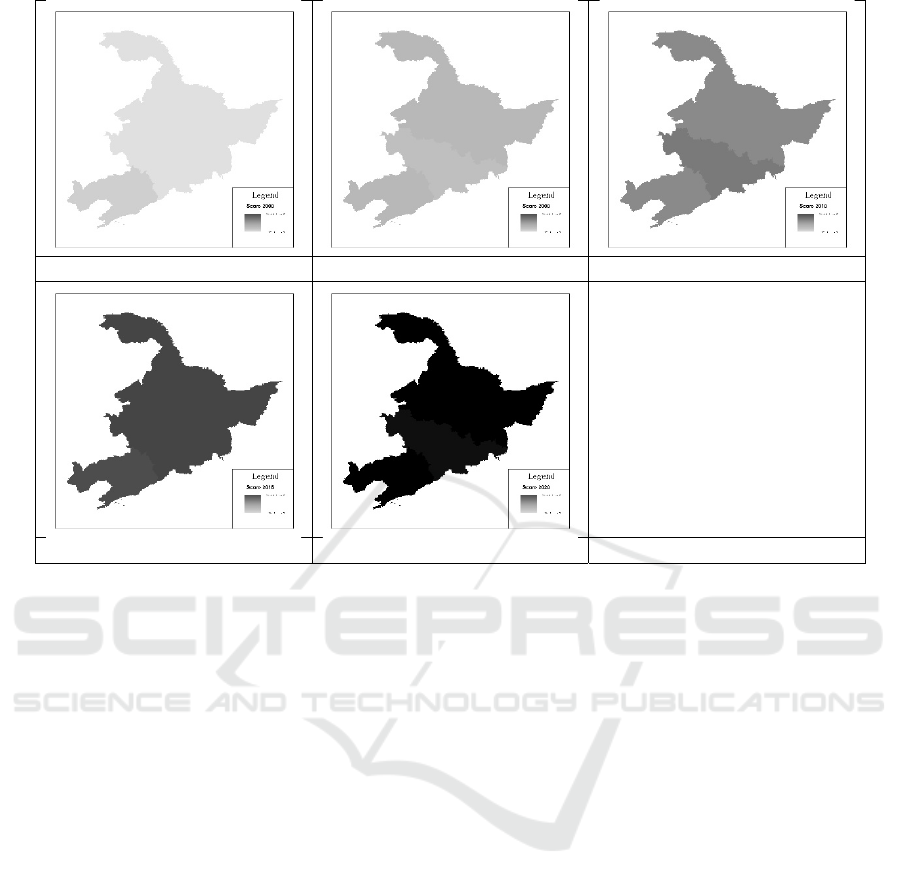
2000 2005 2010
2015 2020
Figure 3: Changes in the Comprehensive Driving Force Score for Arable Land Resources in the Three Northeastern Provinces.
This study employs Principal Component
Analysis (PCA) to systematically investigate the
underlying causes of changes in arable land resources
in Liaoning, Jilin, and Heilongjiang provinces. By
aggregating the weighted coefficients of the primary
influencing factors, data from 2000 to 2021 were
analyzed. The overall trend indicates that from 2000
to 2021 (
Xu et al., 2023), the driving forces behind
changes in arable land resources in the three
northeastern provinces exhibited a continuous
upward trajectory. Prior to 2011, the comprehensive
driving force scores were negative; starting in 2012,
these scores gradually became positive, suggesting an
increasing influence of factors affecting the variation
in arable land resources in these provinces from 2012
to 2021 (Figure 3).
4.3 Evaluation of Driving Factors for
Changes in Arable Land Resources
in the Three Northeastern
Provinces
The study reveals that the variation in arable land
resources across the three northeastern provinces is
correlated with several selected factors. These factors
include the proportion of urban population (x
1
), per
capita GDP (x
2
), fixed asset investment in the
secondary industry (x
3
), fixed asset investment in the
tertiary industry (x
4
), output value ratio of the
secondary industry (x
5
), output value ratio of the
tertiary industry (x
6
), disposable income of urban
residents (x
7
), per capita net income of rural residents
(x
8
), built-up area (x
9
), and investment in real estate
development (x
10
).
The coefficient of determination R
2
for Liaoning,
Jilin, and Heilongjiang are 0.906, 0.922, and 0.923,
respectively. This indicates that the two principal
component factors included in the regression model
account for 90.6%, 92.2%, and 92.3% of the variance
in the dependent variable, demonstrating an excellent
fit of the model. This model proves highly valuable
for evaluating changes in arable land resources across
the three northeastern provinces. The principal
component regression equations established in this
study are as follows (Table 5):
Y
a
=428.712+31.562x
1
+5.766x
2
(8)
Y
b
=620.823+71.683x
1
+59.162x
2
(9)
Y
c
=1396.729+183.609x
1
+115.355x
2
(10)
ICESCE 2024 - The International Conference on Environmental Science and Civil Engineering
82
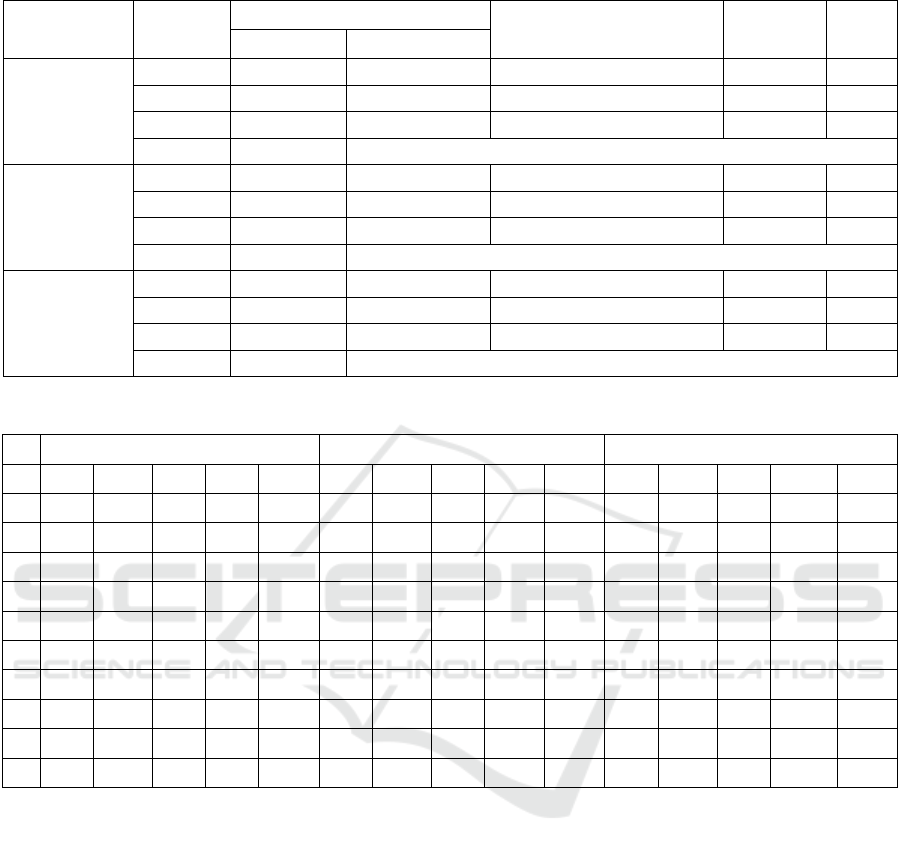
Table 5: Regression Analysis Results of Principal Components.
Unstandardized Coefficients
Standardized Coefficients t-Statistic Sig
Coefficient Standard Error
Liaoning
Constant 428.712 2.311 185.549 0
F
1
31.562 2.365 0.937 13.346 0
F
2
5.766 2.365 0.171 2.438 0.025
R² 0.906
Jilin
Constant 620.823 6.046 102.675 0
F
1
71.683 6.189 0.741 11.583 0
F
2
59.162 6.189 0.611 9.56 0
R² 0.922
Heilongjiang
Constant 1396.729 14.043 99.463 0
F
1
183.609 14.373 0.813 12.774 0
F
2
115.355 14.373 0.511 8.026 0
R² 0.923
Table 6: Regression Coefficients for Each Original Variable.
Liaoning Jilin Heilongjiang
F
1
μ
1
F
1
F
2
μ
2
F
2
μ
n
F
n
F
1
μ
1
F
1
F
2
μ
2
F
2
μ
n
F
n
F
1
μ
1
F
1
F
2
μ
2
F
2
μ
n
F
n
x
1
-0.875 -27.616 1.276 7.358 -20.258 -1.309 -93.836 1.588 93.962 0.127 0.303 55.682 -0.286 -32.986 22.696
x
2
-0.099 -3.131 0.296 1.706 -1.425 0.109 7.847 0.031 1.849 9.696 0.098 17.99 0.045 5.155 23.144
x
3
0.491 15.485 -0.465 -2.679 12.806 0.768 55.049 -0.695 -41.13 13.919 0.069 12.718 0.09 10.374 23.092
x
4
0.513 16.178 -0.493 -2.841 13.337 0.11 7.89 0.031 1.81 9.7 0.004 0.777 0.192 22.121 22.897
x
5
0.113 3.582 -0.314 -1.811 1.771 -0.315 -22.593 0.196 11.602 -10.992 -0.157 -28.871 0.051 5.867 -23.004
x
6
0.162 5.103 -0.038 -0.22 4.883 -0.445 -31.875 0.64 37.886 6.011 0.277 50.895 -0.243 -28.082 22.813
x
7
0.095 3.004 0.047 0.272 3.276 -0.071 -5.076 0.23 13.62 8.544 0.224 41.093 -0.157 -18.068 23.026
x
8
0.21 6.626 -0.1 -0.578 6.048 -0.232 -16.623 0.407 24.05 7.427 0.228 41.868 -0.164 -18.964 22.903
x
9
0.137 4.31 -0.007 -0.04 4.271 0.672 48.205 -0.59 -34.905 13.301 -0.072 -13.159 0.309 35.641 22.482
x
10
0.218 6.876 -0.112 -0.647 6.229 0.784 56.215 -0.713 -42.203 14.012 -0.539 -98.993 1.012 116.717 17.724
Substitute the ten principal component factors into
the principal component regression model to
calculate the corresponding parameters in the original
regression model (see Table 6), thereby obtaining the
standard regression model that eliminates
multicollinearity:
Y
a
=428.712-20.258x
1
-1.425x
2
+12.806x
3
+13.337x
4
+1.
771x
5
+4.883x
6
+3.276x
7
+6.048x
8
+4.271x
9
+
6.229x
10
(11)
Y
b
=620.823+0.127x
1
+9.696x
2
+13.919x
3
+9.700x
4
-10.
992x
5
+6.011x
6
+8.544x
7
+7.427x
8
+13.301x
9
+
14.012x
10
(12)
Y
c
=1396.729+22.696x
1
+23.144x
2
+23.092x
3
+22.897x
4
-23.004x
5
+22.813x
6
+23.026x
7
+22.903x
8
+
22.482x
9
+17.724x
10
(13)
5 CONCLUSION
Between 2000 and 2021, the quantity of arable land
resources in the three northeastern provinces
exhibited a gradual upward trend, influenced by a
confluence of interacting factors. Research indicates
that the driving force behind the changes in arable
land resources in these provinces has progressively
strengthened. Specifically, the composite score for
the northeastern provinces remained negative until
2011, but began to turn positive from 2012 onwards,
indicating a significant intensification of the forces
driving changes in arable land resources during this
period.
Study on the Changes in Arable Land Resources and Driving Forces in the Three Northeastern Provinces of China Based on Urbanization
83

ACKNOWLEDGMENTS
Correspondence should be addressed Shen Ying
(shenying1996@163.com)
REFERENCES
Yu Y. 2022. Applications of 3 D laser scanning technology
in the extraction of vegetation parameters , Journal of
Henan Polytechnic University (Natural Science),
41(04): 51-57. DOI: 10.16186/j.cnki.1673-
9787.2020090105.
Zhang Z Q. 2022. The evolution pattern and influence of
human activities of landslide driving factors in Wulong
section of the Three Gorges Reservoir area, The
Chinese Journal of Geological Hazard and Control,
33(03): 39-50. DOI: 10.16031/j.cnki.issn.1003-
8035.2022.03-05.
Wang N. 2021. Mine Environment Investigation and
Research Based on Remote Sensing Technology:A
Case Study of the Jidong Iron Mine, Metal Mine, (10):
192-198. DOI:10.19614/j.cnki.jsks.202110026.
YE S S. 2019. Ecological Environmental Cost Accounting
of Mining Area Based on the Green Mine: A Case from
a Mining Area in the North China Plain , Metal Mine,
(04): 168-174. DOI: 10.19614/j.cnki.jsks.201904031.
Hou J W. 2023. Discourse on scientific advancements in
mining ecological restoration, Mining Safety &
Environmental Protection, 50(06): 1-6, 15.
DOI:10.19835/j.issn.1008-4495.2023.06.001.
Xie Y. 2023. Analysis of land use change and influencing
factors based on GIS and RS:A case of Hefei, Natural
Resources Informatization, (04): 18-23. DOI:
10.3969/j.issn.1674-3695.2023.04.003
Ma J X. 2023. Spatio-temporal change characteristics of
water conservation function in the Zhang-Cheng
district based on the InVEST model, Hydrogeology &
Engineering Geology, 50(03): 54-64.
DOI:10.16030/j.cnki.issn.1000-3665.202208084.
Guan D J. 2023. Study on the Spatial-temporal Coupling
Relationship between New Urbanization and Logistics
Industry: Based on the Panel Data of Anhui Province ,
Journal of Cangzhou Normal University, 39(01): 51-55.
DOI:10.13834/j.cnki.czsfxyxb.2023.01.012.
Ye S S. 2023. Comprehensive Management of Ecological
Protection and Restoration Funds, Finance and
Accounting for International Commerce, (20): 54-58.
DOI: 10.3969/j.issn.1673-8594.2023.20.009
Li X L. 2023. Theoretical analysis and engineering practice
of dynamic pre-reclamation in coal mining subsidence
area, Mining Safety & Environmental Protection,
50(01): 86-91. DOI: 10.19835/j.issn.1008-
4495.2023.01.015.
Zhang Y. 2022. Selection of pioneer plants for repairing
limestone high and steep slopes in North China, The
Chinese Journal of Geological Hazard and Control,
33(05): 109-118. DOI: 10.16031/j.cnki.issn.1003-
8035.202110012.
Xu L. 2023. Carbon Storage Change in Xishuangbanna
Based on PLUS and InVEST Model , Ecology and
Environmental Monitoring of Three Gorges, 8(02): 75-
87. DOI: 10.19478/j.cnki.2096-2347.2023.02.10.
ICESCE 2024 - The International Conference on Environmental Science and Civil Engineering
84
