
Estimation of Ultimate Soil Resistance for Laterally Loaded Piles
Using a Coupled Eulerian-Lagrangian Model
Shuanglong Li
1,* a
, Min Gong
2
, Limin Wei
3
, Yang Zhang
1
, Zengxiang Jiao
1
and
Qiaoxiong Chen
4
1
School of Hydraulic Engineering, Nanchang Institute of Technology, Nanchang 330099, China
2
School of Foreign Languages, Nanchang Institute of Technology, Nanchang 330099, China
3
School of Civil Engineering, Central South University, Changsha 410075, China
4
Teacher Development and Service Centre, Nanchang Institute of Technology, Nanchang 330099, China
*
Keywords: Laterally Loaded Piles, Soil Resistance, Eulerian-Lagrangian Model.
Abstract: In the numerical analysis of laterally loaded pile-soil interaction, the classical Lagrangian model under the
large soil deformation or rough pile-soil interface will cause convergence problems due to soil plastic
damage and great mesh distortion, which leads to a large discrepancy between the calculation results and the
actual situation. In this paper, a numerical model based on the coupled Eulerian-Lagrangian (CEL) method
was proposed to investigate the laterally loaded pile-soil interaction and the variation of ultimate soil
resistance (USR) acting on the pile side. The results show that the USR calculated by the CEL model was
consistent with the theoretical values and the Lagrangian model results in the literature, which indicates that
it is appropriate to study the laterally loaded pile-soil interaction behavior using the CEL model. In pile-soil
interaction problems involving large deformations, the CEL model describes well the soil flow behavior
around the pile and has significant advantages in the application.
a
https://orcid.org/0000-0001-9298-5561
1 INTRODUCTION
For laterally loaded piles (see Figure 1), the
deformation behavior of piles is mainly affected by
the distribution of ultimate soil resistance (USR) on
the pile side (Guo, 2006). Different assessment
results are inevitably obtained by using different
USR distributions. Therefore, accurate
determination of the USR on the pile side is essential
for the accurate design of the pile foundation.
To obtain the real USR, Abdrabbo et al. (2012)
and Kim et al. (2004) carried out a large number of
laboratory or field tests to investigate the
relationship between pile displacement and soil
resistance. Furthermore, Randolph and Houlsby
(1984) derived an upper-limit solution for the USR
of circular piles by considering the friction at the
pile-soil interface. Based on this theory, the USR
can be determined to be approximately 9.14c
u
D and
11.94c
u
D (where c
u
is the undrained shear strength
of the soil and D is the pile diameter) for smooth and
rough conditions at the pile-soil interface,
respectively.
Numerical simulation can be used to
quantitatively analyze the variation of the USR
under different conditions. Georgiadis et al. 0
adopted a finite element model to analyze the USR
in clay considering the effect of side-by-side piles.
Yang et al. (2002) developed an LPILE model to
study the deformation behavior of piles in
homogeneous sands and clays and obtained the pile
displacement-soil resistance curves. Zhao et al.
(2019) established an Abaqus 3D finite element
model to study the interaction characteristics
between laterally loaded piles and soil.
66
Li, S., Gong, M., Wei, L., Zhang, Y., Jiao, Z., Chen and Q.
Estimation of Ultimate Soil Resistance for Laterally Loaded Piles Using a Coupled Eulerian-Lagrangian Model.
DOI: 10.5220/0013573500004671
In Proceedings of the 7th International Conference on Environmental Science and Civil Engineering (ICESCE 2024), pages 66-70
ISBN: 978-989-758-764-1; ISSN: 3051-701X
Copyright © 2025 by Paper published under CC license (CC BY-NC-ND 4.0)
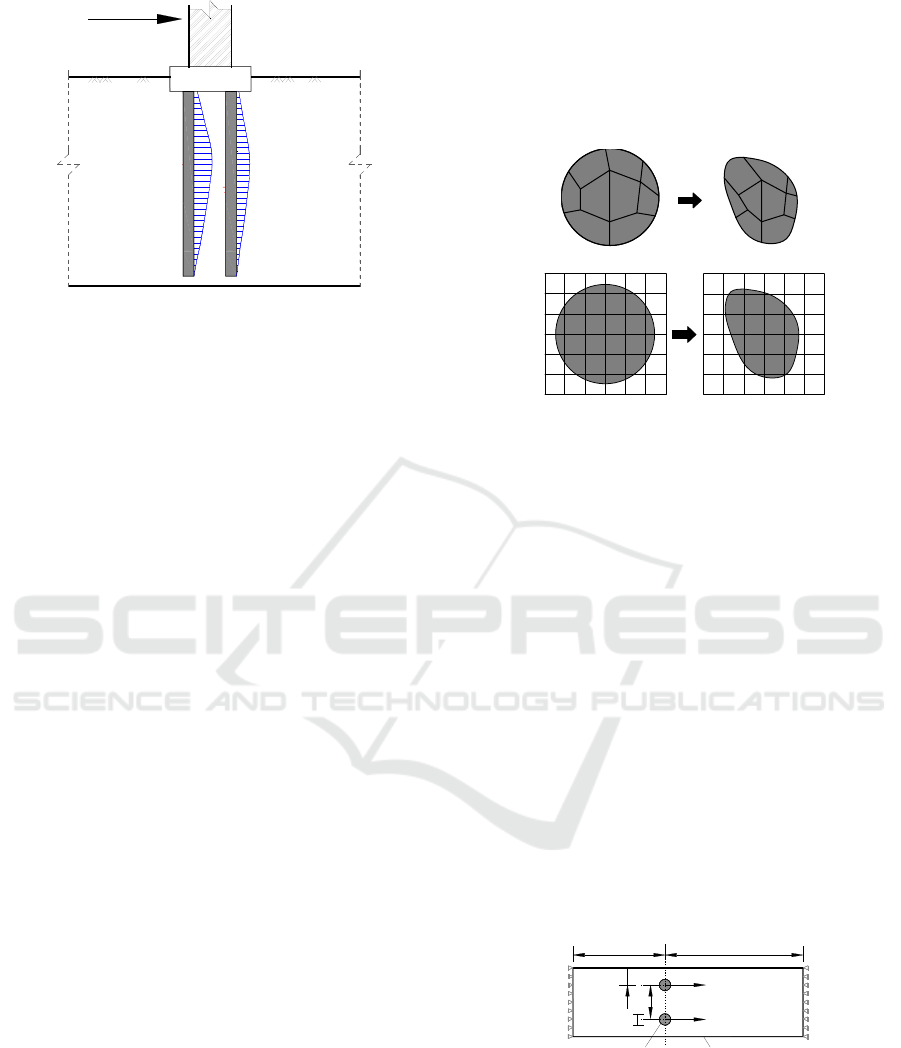
Figure 1: Schematic diagram of laterally loaded piles.
However, the numerical models adopted in the above
literature are quite different from the actual situation
when the soil deformation is large or the pile-soil
interface is rough. The reason is that the Lagrangian
model used in the above literature has convergence
problems due to the extreme plastic damage of the soil
and the great distortion of the mesh (Sheng et al., 2005).
Therefore, to further reveal the laterally loaded pile-soil
interaction mechanism and estimate the USR acting on
the pile side, this study aims to investigate this issue by
using a coupled Eulerian-Lagrangian (CEL) finite
element method considering large deformation
characteristics and to provide new ideas for the research
and engineering design of laterally loaded piles.
2 COUPLED EULERIAN-
LAGRANGIAN METHOD
CONSIDERING LARGE
DEFORMATIONS
The methods of describing material motion are classified
as Lagrangian or Eulerian, as shown in Figure 2. In the
Lagrangian method, the material is tightly connected to
the mesh and moves only with the deformation of the
mesh, whereas in the Eulerian method, the material can
flow freely in the Eulerian domain mesh but the mesh
always remains motionless. Since there is no need to
consider mesh quality issues (e.g. mesh distortion), the
Eulerian method has significant advantages for analyzing
problems involving large deformations and material
damage.
Combining Eulerian and Lagrangian methods to
form an advanced numerical analysis technique, i.e.,
the CEL method (Luke et al., 2021), which is
particularly suitable for the analysis of the
interaction between materials with large relative
stiffness and easy to yield by establishing the
Eulerian and Lagrangian bodies and allowing the
two to come into contact. For the pile-soil
interaction problem involved in this paper, the CEL
analysis will have a significant advantage due to the
large difference in pile-soil stiffness and the ease of
destruction of the soil.
Figure 2: Methods for describing the motion of materials.
3 ANALYSIS OF ULTIMATE SOIL
RESISTANCE FOR
LATERALLY LOADED PILES
3.1 Laterally Loaded Pile Model Based
on the CEL Method
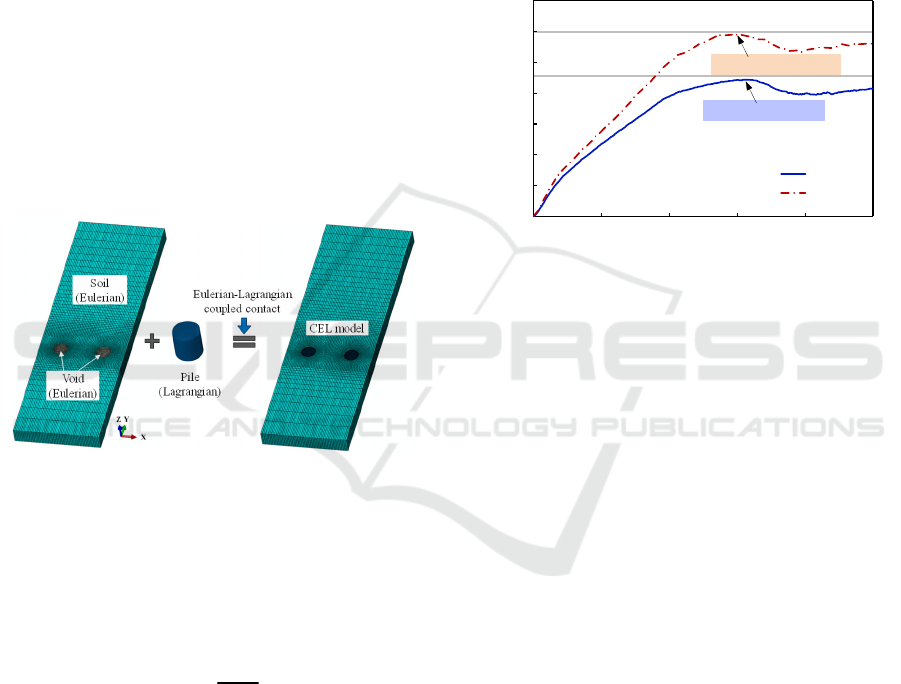
Considering the side-by-side effect, the unit-length
laterally loaded pile-soil interaction model was
established, see Figure 3, where the pile diameter D
was 1.0 m, the s was the pile spacing, and the
boundary distance was s/2 from the pile axis.
Concerning the Lagrangian model adopted by Chen
and Martin (2002), the distance of the right
boundary from the pile axis was 12.0 m and the
distance of the left boundary from the pile axis was
8.0 m.
Figure 3: Numerical conceptual model for laterally loaded
piles.
The established CEL finite element model is
shown in Figure 4. The soil region was modeled by
Eulerian material and the reserved pile region was
set as a void. The soil was described by the Mohr-
Pier
Cap
Soil
resistance
Pile
foundation
Lateral loads
Lagrangian method
Eulerian method
Soil
12.0 m8.0 m
s
s/2
Symmetric boundary
Pile
D
Pile velocity (v)
Fixed boundary
of velocity
Fixed boundary
of velocity
Estimation of Ultimate Soil Resistance for Laterally Loaded Piles Using a Coupled Eulerian-Lagrangian Model
67
Coulomb material model, with a density of 1642
kg/m
3
, and an elastic modulus of 6.0 MPa, and the
pile-soil interaction process was regarded as an
undrained process under rapid loading, then
Poisson's ratio was set to be the value of 0.495
(Georgiadis et al., 2013; Tho et al., 2014). The
friction angle was 0.1°, and the undrained shear
strength c
u
was 15.6 kPa. The unit-length pile was
modeled by Lagrangian material, which was
regarded as a linear material, with an elastic
modulus of 33.6 GPa, and a Poisson's ratio of 0.17.
The Eulerian-Lagrangian coupled contact was
established, and the friction factor at the pile-soil
interface was set to be f (the interface is represented
to be smooth when f=0, and the interface is
represented to be rough when f=1.0). The pile was
moved horizontally laterally at a speed of 0.001 m/s
for a calculation time of 100 s, and the variation in
pile reaction force (whose magnitude is equal to the
soil resistance p) was recorded through a reference
point.
Figure 4: The establishment process of the CEL model.
3.2 Variation in the USR
Figure 5 shows the development of soil resistance of
a monopile for friction factors of 0 and 1.0,
respectively. The soil resistance is normalized in the
figure in the following way
p
u
p
N
cD
=
(1)
where N
p
is the soil resistance factor.
As can be seen from the figure, with the increase
of pile horizontal displacement, the soil resistance
gradually increases and tends to stabilize after
reaching the limit. The whole development process
can be divided into three stages: (i) the soil is in the
elastic stage, the pile displacement is from 0 to 6.0
mm, and the soil resistance increases linearly; (ii)
the soil is in the elastic-plastic stage, the pile
displacement is from 6 to 60.0 mm, the soil
resistance increases to the limiting value, and the
increase decreases gradually; (iii) the soil is in the
plastic stage, the pile displacement is larger than
60.0 mm, the soil resistance reaches the limiting
value and then tends to stabilize.
In addition, the USR was 8.87 c
u
D and 11.86 c
u
D
under f=0 and f=1.0, respectively, which were in
good agreement with the theoretical results of
Randolph and Houlsby (1984), with a difference of
3.0% and 0.7%, respectively, indicating that it is
appropriate to study the laterally loaded pile-soil
interaction behavior using the CEL model.
Figure 5: Comparison of CEL model calculated results
with theoretical results from the literature.
Figure 6 shows the equivalent plastic strain
distribution when the soil resistance reaches the limit
value. When f=0, the pile-soil interface is smooth,
the soil undergoes bypassing along the pile surface,
the soil equivalent plastic strain region is overall
narrow, the maximum equivalent plastic strain is
small, and the distribution area of the triangular
wedge elastic zone is small. When f=1.0, the soil
cannot produce relative sliding along the pile
surface, resulting in the soil providing a greater
resistance, and the triangular wedge elastic zone
distribution area is larger.
0 20406080100
0
2
4
6
8
10
12
14
Limiting value=8.87
Limiting value=11.86
Theoretical value=11.94
N
p
Pile displacement (mm)
f=0
f=1.0
Theoretical value=9.14
ICESCE 2024 - The International Conference on Environmental Science and Civil Engineering
68
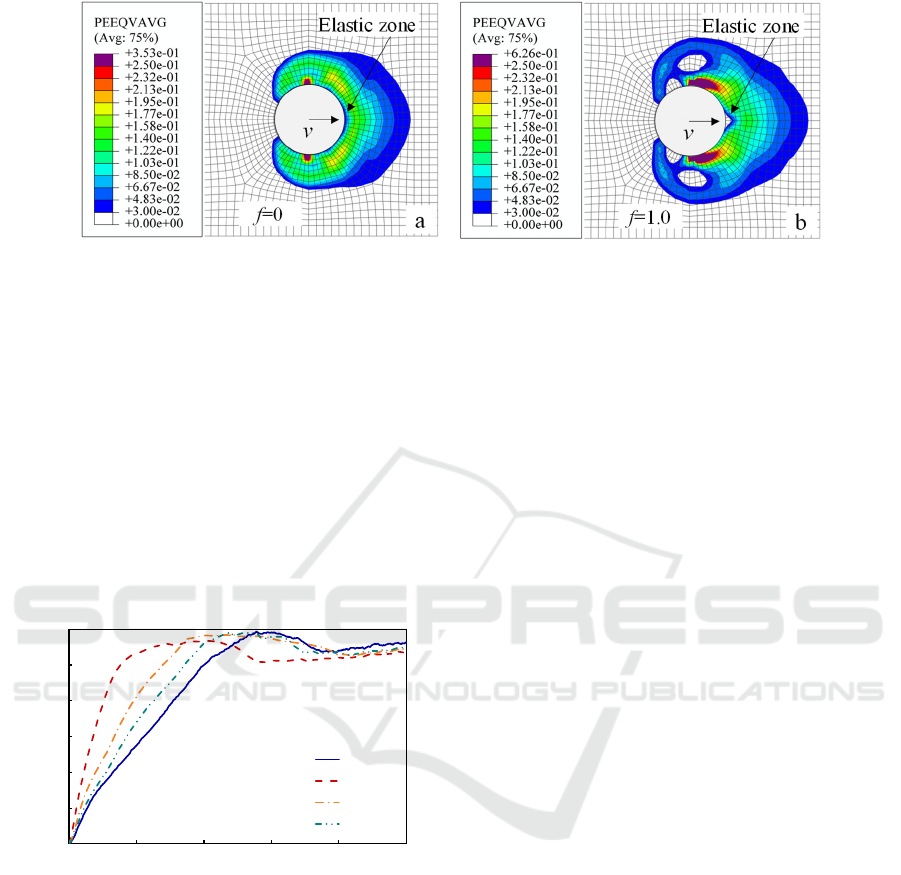
Figure 6: Equivalent plastic strain distribution of soil on the pile side.
Figure 7 shows the development of soil
resistance for different pile spacings at f=1.0. As the
pile spacing increases, the ‘stiffness’ of the soil
resistance development curve increases, and the
USR also increases, and gradually converges to the
USR under a single pile. Comparing these results
with those of Georgiadis et al. (2013), it can be seen
that the results of the CEL model are very close to
those of the literature, but the results of this paper
are overall small. The reason is that the CEL method
fully considers the large deformation effect of soil
flow around the pile, resulting in a relatively weaker
resistance given by the soil.
Figure 7: Development of soil resistance at different pile
spacings (f=1.0).
4 CONCLUSIONS
A CEL model was proposed to investigate the
mechanism of laterally loaded pile-soil interaction
and the variation of USR, and the following
conclusions were obtained:
(1) The USR calculated by the CEL model was
very close to the theoretical results and the
Lagrangian model results in the literature, which
indicated that it is reliable to analyze the laterally
loaded pile-soil interaction using the CEL method.
(2) The CEL method can overcome the
convergence problems caused by plastic yielding
and mesh twisting in the Lagrangian model and is
more applicable in pile-soil interaction problems
involving large deformation. Compared with the
Lagrangian model, the CEL model can well describe
the soil flow behavior around the pile.
ACKNOWLEDGMENTS
This paper reports research developed under
financial support provided by the Natural Science
Foundation of Jiangxi Province (Grant No.
20242BAB20230), the Science and Technology
Research Project of Jiangxi Education Department
(Grant No. GJJ2201509), and the National Natural
Science Foundation of China (Grant No. 51878671).
REFERENCES
Guo, W. D. 2006. On limiting force profile, slip depth and
response of lateral piles. Computers & Geotechnics,
33(1): 47-67.
Abdrabbo, F. M., Gaaver, K. E. 2012. Simplified analysis
of laterally loaded pile groups. Alexandria
Engineering Journal, 51(2): 121-127.
Tak Kim, B., Kim, N. K., Jin Lee, W., Su Kim, Y. 2004.
Experimental load-transfer curves of laterally loaded
piles in nak-dong river sand. Journal of Geotechnical
& Geoenvironmental Engineering, 130(4): 416-425.
Randolph, M. F., Houlsby, G. T. 1984. The limiting
pressure on a circular pile loaded laterally in cohesive
soil. Geotechnique, 34(4): 613-623.
Georgiadis, K., Sloan, S. W., Lyamin, A. V. 2013.
Ultimate lateral pressure of two side-by-side piles in
clay. Geotechnique, 63(13): 1170-1175.
0 20406080100
0.0
2.0
4.0
6.0
8.0
10.0
12.0
N
p
Pile displacement (mm)
Single
s/D=2
s/D=4
s/D=6
Estimation of Ultimate Soil Resistance for Laterally Loaded Piles Using a Coupled Eulerian-Lagrangian Model
69

Yang, Z., Jeremic, B. 2002. Numerical analysis of pile
behavior under lateral loads in layered elastic-plastic
soils. International Journal for Numerical and
Analytical Methods in Geomechanics, 26: 1385-1406.
Zhao, M., Peng, W., Yang, C., Xiao, Y. 2019. Analysis of
strain wedge for laterally loaded pile based on
ABAQUS. Journal of Railway Science and
Engineering, 16(09): 2199-2206.
Sheng, D., Eigenbrod, K. D., Wriggers, P. 2005. Finite
element analysis of pile installation using large-slip
frictional contact. Computers and Geotechnics, 32(1):
17-26.
Luke, T., Ashley, P., Ali, T. 2021. Coupled Eulerian-
Lagrangian simulation of a modified direct shear
apparatus for the measurement of residual shear
strengths. Journal of Rock Mechanics and
Geotechnical Engineering, 13(05): 1113-1123.
Chen, C. Y., Martin, G. R. 2002. Soil–structure interaction
for landslide stabilizing piles. Computers &
Geotechnics, 29(5): 363-386.
Tho, K. K., Chen, Z., Leung, C. F., Chow, Y. 2014.
Enhanced analysis of pile flexural behavior due to
installation of adjacent pile. Canadian Geotechnical
Journal, 51(6): 705-711.
ICESCE 2024 - The International Conference on Environmental Science and Civil Engineering
70
