
Analysis of Population Spatial Distribution in Counties of Guangdong
Province Based on Spatial Autocorrelation
Yang Yu
1,2 a
, Boyuan Liu
3b
and Wei Feng
1,2,* c
1
China Institute of Geo-Environment Monitoring, Beijing 100081, China
2
Key Laboratory of Mine Ecological Effects and Systematic Restoration, Ministry of Natural Resources,
Beijing 100081, China
3
No.1 Institute of Geology and Mineral Resource Exploration of Shandong Province, Jinan 250100, China
Keywords: Population Spatial Distribution, Spatial Autocorrelation, Population Density, County-Level Regions of
Guangdong Province.
Abstract: A comprehensive examination of the characteristics and patterns of population spatial distribution is
imperative for achieving a balanced dispersal of population, fair allocation of resources, and harmonised
socio-economic development. This paper employs spatial autocorrelation analysis, complemented by
population density and range methodologies, to scrutinise the county-level permanent population figures of
Guangdong Province for the years 2010, 2015, and 2020. The focus lies in exploring the spatial distribution
features of the population across Guangdong Province. The findings indicate that the population in
Guangdong Province predominantly congregates along the coastal regions, exhibiting a discernible gradient
in population density from north to south, accompanied by notable disparities in spatial distribution. A
conspicuous clustering tendency is observed in the population spatial distribution, characterised chiefly by
high-high and low-low agglomerations, which tend to be concentrated and contiguous, displaying an
escalating clustering intensity. High-high agglomerations are predominantly concentrated in the developed
zones of the Pearl River Delta, whereas low-low agglomerations are primarily situated in the northern and
eastern regions of Guangdong.
1 INTRODUCTION
Population distribution refers to the aggregation and
dispersion of the population within specific
geographical spaces at a given time. It reflects the
spatial manifestation of population activities, which
is influenced by various factors such as modes of
social production, economic development levels, and
natural conditions, resulting in different distribution
patterns across regions. Currently, with regional
economic development being uneven, there is a clear
spatial concentration and distribution difference in
population, where economically developed central
cities and urban clusters become major agglomeration
areas, while regions with relatively lagging
economies face severe population loss and economic
development dilemmas. An in-depth study of the
a
https://orcid.org/0000-0001-6584-4050
b
https://orcid.org/0009-0008-5078-9958
c
https://orcid.org/0009-0009-1917-8769
characteristics and laws of population spatial
distribution is of great significance for achieving
reasonable population distribution, balanced
allocation of resources, and coordinated socio-
economic development (Ju, 2022; Yu, 2022; Zhang, Z. Q.,
2022; Yin, 2022; Li, B., 2022; Jin, 2022).
Guangdong Province holds a prominent position
on China's economic landscape, serving as a pioneer
in the nation's economic advancement, with its
overall economy and populace ranking at the
forefront nationwide. In 2020, Guangdong Province,
representing 8.73% of the country's population,
contributed 10.90% to China's GDP. In 2017, the
Guangdong-Hong Kong-Macao Greater Bay Area
was integrated into the national development strategy,
aiming to establish a world-class urban cluster and
bolster global competitiveness. The Pearl River Delta
24
Yu, Y., Liu, B., Feng and W.
Analysis of Population Spatial Distribution in Counties of Guangdong Province Based on Spatial Autocorrelation.
DOI: 10.5220/0013572900004671
In Proceedings of the 7th International Conference on Environmental Science and Civil Engineering (ICESCE 2024), pages 24-30
ISBN: 978-989-758-764-1; ISSN: 3051-701X
Copyright © 2025 by Paper published under CC license (CC BY-NC-ND 4.0)
in Guangdong, as a major component of the
Guangdong-Hong Kong-Macao Greater Bay Area,
plays a pivotal role. The execution of this strategy is
anticipated to attract more external talents, further
stimulating significant population concentration in
the region. Thus, the distinctive economic backdrop
and geographical location determine the
distinctiveness of population spatial distribution in
Guangdong Province. A survey of existing literature
underscores substantial progress in the exploration of
population issues in Guangdong, encompassing
focused investigations on migrant populations, labor
demographics, and aging trends. While some scholars
have employed population density and gravity
models to scrutinize the temporal and spatial
distribution patterns of the population across
Guangdong Province as a whole, few have delved
into the inherent connections within the province's
population spatial distribution (Shi, 2022; Zhou, 2022;
Bao, 2022; Gao, 2022; Wang, 2021; Dang, 2022; Liao,
2022; Ye, 2019; Hou, 2023).
Building upon the aforementioned points, this
paper will employ the permanent population data
from 2010, 2015, and 2020, utilising counties as the
focal research units. It will apply the spatial
autocorrelation method to investigate the prevailing
characteristics of population spatial distribution in
Guangdong Province and unveil the inherent
correlations within population distribution
phenomena. This endeavour aims to furnish insights
for governmental policymakers to craft strategies for
enhancing population distribution, resource
allocation, and fostering coordinated economic
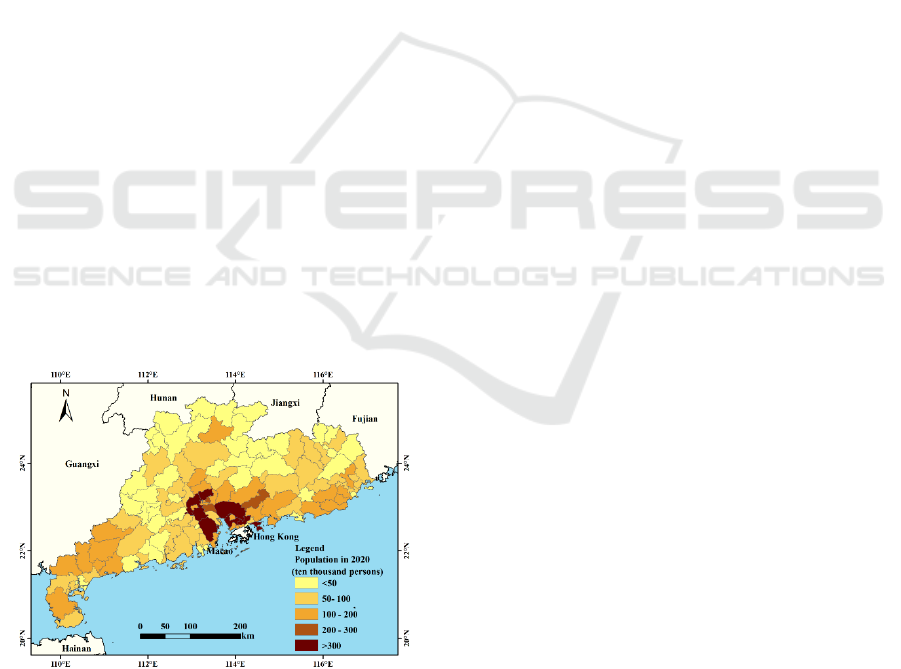
growth (Figure 1).
Figure 1: Study Area Map.
2 STUDY AREA OVERVIEW
Guangdong Province is located at the southernmost
tip of mainland China, between east longitude 109°45′
and 117°20′ and north latitude 20°09′ and 25°31′,
adjacent to Fujian, Jiangxi, Hunan, and Guangxi, with
the South China Sea to the south, and Hong Kong and
Macao on either side of the Pearl River estuary. The
province falls within the East Asian monsoon climate
zone, maintaining an average annual temperature
above 20℃, with an average annual precipitation
between 1333 and 2254mm. Guangdong features a
complex and varied topography, including mountains,
hills, and plains, generally showing a high north to
low south trend, with the north dominated by
mountains and high hills, while the south is mainly
plains. In 2020, the total permanent population of the
province was 126.0125 million, with Dongguan City
having the highest population distribution of 10.4666
million people, and the least populated county being
Nanao District of Shantou City, with 64,400 people.
3 DATA SOURCES
This paper centres on the enduring populace figures
of the county-level administrative regions in
Guangdong Province for the years 2010, 2015, and
2020. The population data originates from the
"Seventh National Population Census Bulletin" and
"Sixth National Population Census Bulletin" of
Guangdong Province and its cities, along with the
2016 Statistical Yearbook. To enable longitudinal
scrutiny, the population statistics for all years are
harmonised with the county-level administrative
divisions as of 2010. These administrative regions
encompass counties, county-level cities, municipal
districts within prefecture-level cities (e.g.,
Shaoguan's municipal districts), and prefecture-level
cities devoid of subordinate counties (e.g., Dongguan
City, Zhongshan City). GDP and additional economic
metrics are extrapolated from the 2021 China
Statistical Yearbook and the Guangdong Provincial
Statistical Yearbook. Regional area information is
acquired from the National Administrative Division
Information Query Platform (Xie, 2023; Ma, 2023;
Guan, 2023; Kang, 2023; Ye, 2023; Li, 2023; Zhang,
Y., 2022; Xu, 2023; Li, X. R., 2022).
4 RESEARCH METHODS
4.1 Population Density
Population density is defined as the ratio of the
number of people in a region to its area. It is one of
the important indicators reflecting the form of
Analysis of Population Spatial Distribution in Counties of Guangdong Province Based on Spatial Autocorrelation
25

population distribution and differences between
regions.
d
i
=
x
i
/
s
i
(1)
In the formula, d
i
represents the population
density of the i
th
county,x
i
represents the population
number of the i
th
county;s
i
represents the area of the
i
th
county region.
4.2 Range Method
The range method is a simple and intuitive statistical
analysis method used to describe the range of
variation or difference in a dataset. It can be used to
quantify the degree of difference in population
distribution within a region.
R =
x
max
-
x
min
(2)
In the formula, R is the range of population
density within the counties of Guangdong Province,
x
max
is the maximum value of county population
density, and x
min
is the minimum value of county
population density.
4.3 Spatial Autocorrelation
4.3.1 Global Autocorrelation
Global autocorrelation analysis can determine
whether there is significant spatial clustering or
dispersion of population distribution within the study
area, measured by the Global Moran's I index. The
Global Moran's I index values range between [-1,1].
When the index value is greater than 0, the regional
population distribution shows a positive spatial
correlation, indicating a certain trend of clustering in
space; when the index value equals 0 or is close to 0,
the distribution of the population across different
areas is random, or there is no spatial autocorrelation;
when the index value is less than 0, the regional
population distribution shows a negative spatial
correlation, indicating a tendency to disperse in space.
The formula for calculating the Global Moran's I
index is as follows:
𝐼
=
𝑛
∑∑
𝑊
𝑋
−𝑋
𝑋
−𝑋
∑∑
𝑊
∑
𝑋
−𝑋
(3)
In the formula, I
g
is the Global Moran's I index, n
is the total number of regions, x
i
,x
j
are the population
numbers of regions i and j respectively, represents any
element of the spatial weight matrix, defining the
adjacency relationship between spatial objects. In this
study, the adjacency rule is used to construct the
weight matrix, where w
ij
=1 if regions i and j are
adjacent, and w
ij
=0 if not.
4.3.2 Local Spatial Autocorrelation
Global spatial autocorrelation can only indicate
whether there is spatial association in the distribution
of population on a global scale but cannot explain the
characteristics of local spatial association. Local
autocorrelation allows for the analysis of spatial
correlations between local areas within the study
region, measured by the Local Moran's I index. The
Local Moran's I index is calculated using the
following formula:
𝐼
=
𝑛
𝑋
−𝑋
∑
𝑋
−𝑋
𝑊
𝑋
−𝑋
(4)
In the formula, I
i
represents the Local Moran's
Index, with the meanings of the other variables
consistent with Equation (3).
5 RESULTS ANALYSIS
5.1 Characteristics of Population
Density Distribution
The range of population density in Guangdong
Province for the years 2010, 2015, and 2020 were
33,964, 33,947, and 30,470 persons/km
2
, respectively,
indicating significant differences in the distribution of
population density. Over time, the disparity in
population density has slightly decreased, but the
differences remain pronounced.
Utilizing ArcGIS software for spatial
visualization of population density in Guangdong
Province over these three years allowed for an
intuitive display of the distribution of population. The
distribution maps of population density across three
periods (Figure 2) reveal significant spatial variations
in population density within the province. Regions
with higher population numbers are concentrated
along the coastal areas, with population density
decreasing towards the northern regions. There is a
clear gradation in population density from north to
south across the province. High-density areas (more
than 1,000 persons/km
2
) are primarily located in the
Pearl River Delta, western Guangdong, and parts of
eastern Guangdong. The extent of these high-density
areas, such as the Pearl River Delta, has gradually
expanded over time; low-density areas (less than 200
persons/km
2
) are steadily distributed in the northern
parts of Guangdong (Table 1).
ICESCE 2024 - The International Conference on Environmental Science and Civil Engineering
26
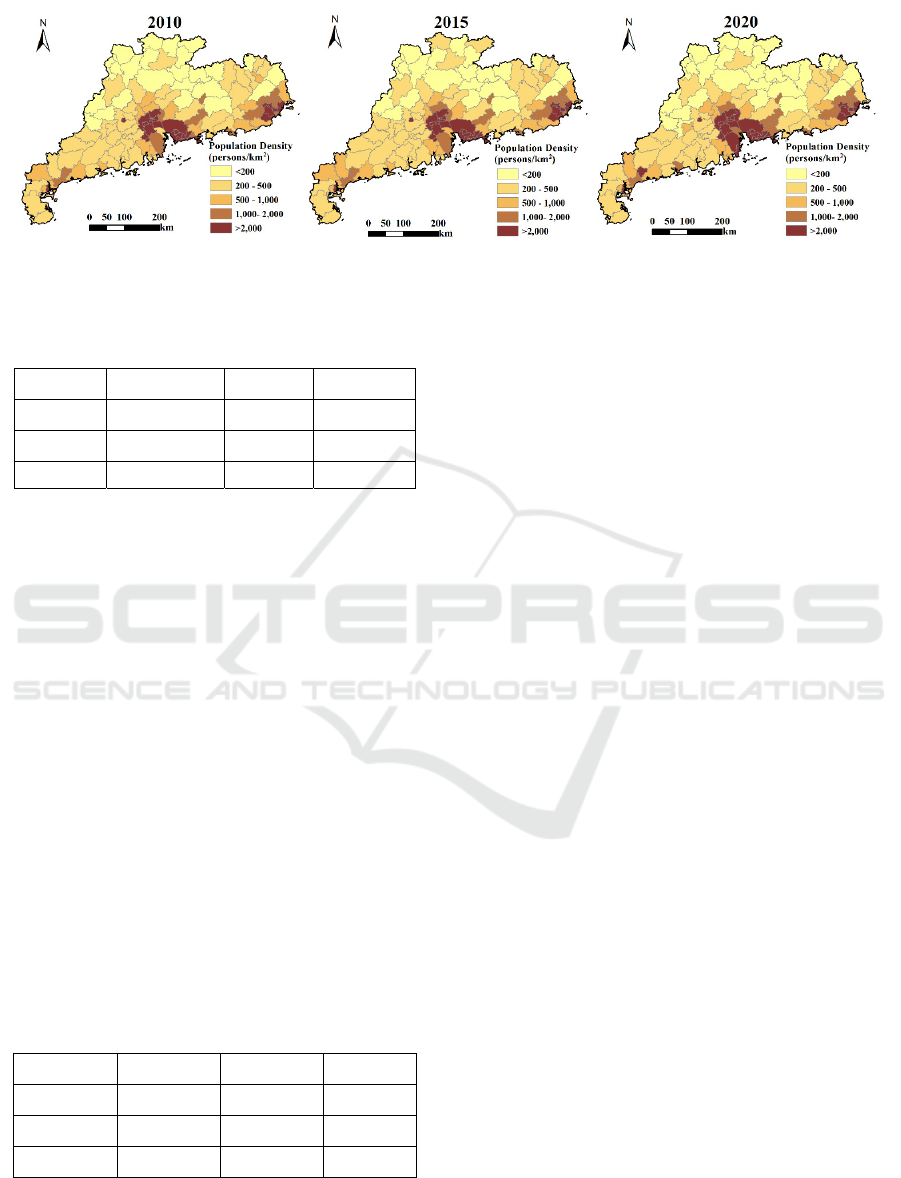
Figure 2: Map of Population Density Distribution in Guangdong Province Range.
Table 1: Population Density Statistics by Year
(persons/km
2
).
Year Max Min Range
2010 34,038 74 33,964
2015 34,024 77 33,947
2020 30,548 78 30,470
5.2 Global Spatial Autocorrelation
Analysis
Global spatial autocorrelation analysis reflects the
overall characteristics of population distribution
across the entire spatial region. Utilizing GeoDa
software and a weight matrix based on adjacency
rules, the global Moran's I for the population
distribution of Guangdong Province's counties in
2010, 2015, and 2020 was calculated, with the results
presented in Table 2. For all three periods, Moran's I
and Z-value were positive, and P-values were less
than 0.05. At a significance level of α=0.05, the
spatial distribution of population in Guangdong
Province shows a positive correlation, indicating
significant clustering characteristics of population
spatial distribution. Observing the trend, the global
Moran's I indicates an increasing trend, suggesting
that the clustering of population spatial distribution in
Guangdong Province is becoming more pronounced.
Table 2: Global Spatial Autocorrelation Parameters of
Population Distribution.
2010 2015 2020
Moran'I 0.1302 0.1523 0.2691
Z-value 2.8243 3.2369 5.332
P-value 0.009 0.006 0.001
5.3 Local Spatial Autocorrelation
Analysis
Local spatial autocorrelation analysis facilitates a
thorough exploration of the spatial relationships
between local geographic entities and their
neighbouring regions. Utilising GeoDa software,
local autocorrelation analysis was conducted on
county population counts in Guangdong Province for
the years 2010, 2015, and 2020, generating local
Moran’s I scatter plots and LISA (Local Indicators of
Spatial Association) cluster maps for each year. The
Moran’s I scatter plots are segmented into four
quadrants, representing distinct types of local spatial
associations: High-High clusters, High-Low outliers,
Low-Low clusters, and Low-High outliers. High-
High and Low-Low clusters denote positive spatial
correlation, while High-Low and Low-High outliers
indicate negative spatial correlation. As depicted by
the Moran’s I scatter plots across the three periods,
the majority of data points fall within the first and
third quadrants, indicating that the population spatial
distribution in Guangdong Province predominantly
exhibits High-High and Low-Low clustering
tendencies. The local Moran's I values for 2010, 2015,
and 2020 stood at 0.1302, 0.1523, and 0.2691,
correspondingly, all positive and demonstrating an
upward trajectory. This indicates a strengthening
positive spatial correlation among neighbouring
county units over time, signifying an augmentation in
clustering.
The LISA (Local Indicators of Spatial Association)
cluster map visually represents the local spatial
relationships depicted by the local Moran's I scatter
plot, showcasing the distribution and location of
spatial clustering types. From Figure 3 and Figure 4, it
is observed that High-High clusters are predominantly
located in the Pearl River Delta region and parts of
eastern
Guangdong, exhibiting a contiguous
Analysis of Population Spatial Distribution in Counties of Guangdong Province Based on Spatial Autocorrelation
27
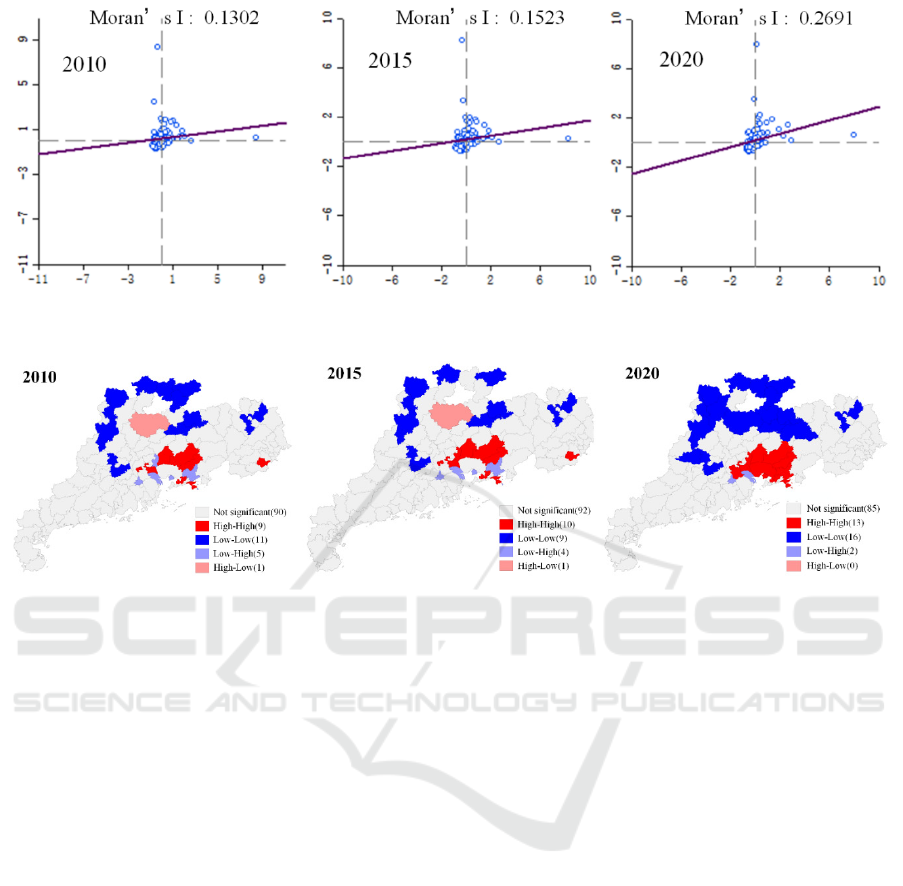
Figure 3: Local Moran’s I Scatter Plot.
Figure 4: LISA Cluster Map of Population Distribution in Guangdong Province.
distribution. High-High clusters in the Pearl River
Delta are influenced by the radiating effect of urban
agglomerations, expanding outward and increasing in
clustering intensity. However, the clustering trend in
parts of eastern Guangdong weakens, with the spatial
distribution correlation becoming insignificant by
2020. Low-Low clusters mainly occur in northern and
eastern Guangdong, also showing a contiguous
distribution characteristic. The number of Low-Low
clusters exhibits a fluctuating growth trend.
Influenced by natural geographical conditions and
slow economic development, counties within this
clustering type have a stable but sparse population
distribution. Low-High clusters are found surrounding
population core areas, affected by the "population
siphon" effect from nearby economically developed
regions. These areas have relatively fewer inhabitants.
As the surrounding economically developed areas
continue to grow, their economic influence and
radiating effects strengthen, gradually attracting
population inflow. This dynamic causes some areas
initially classified as Low-High clusters to gradually
evolve towards High-High clustering. High-Low
clusters, observed in Yingde city from 2010 to 2015,
became less significant by 2020.
6 CONCLUSION
This study, based on spatial autocorrelation analysis
combined with population density, has analyzed the
spatial distribution characteristics of Guangdong
Province's population over the past decade, yielding
the following conclusions:
Analysis of population density across three
periods in Guangdong Province reveals significant
spatial distribution differences. High population
density areas are concentrated along the coastal
regions, with density decreasing progressively
towards the northern regions, indicating a clear
gradation in population distribution levels.
The global Moran's I indices for population
distribution in Guangdong Province across three
periods exhibit positive values. Statistical tests
confirm a significant positive spatial correlation in
population distribution, indicative of spatial
clustering characteristics with an escalating
clustering intensity over time.
Distinct local clustering traits are discernible in
population distribution across the three periods, with
High-High and Low-Low clusters predominating.
These clusters demonstrate a pattern of concentrated
ICESCE 2024 - The International Conference on Environmental Science and Civil Engineering
28

and contiguous distribution, with clustering intensity
strengthening over time. High-High clusters are
chiefly situated in the developed areas of the Pearl
River Delta, while Low-Low clusters are primarily
observed in the northern and eastern regions of
Guangdong.
The spatial distribution of population to some
extent mirrors the level of economic development and
resource allocation within a region. The noticeable
disparities in population distribution across
Guangdong underscore the imbalance in regional
economic development and resource allocation levels.
To address this, Guangdong should bolster policy
support for relatively underdeveloped areas in terms
of population and economy, harnessing the radiating
effect of the Pearl River Delta urban agglomeration to
propel swift development in other regions. However,
in the pursuit of economic advancement, it is
imperative to comprehensively consider
enhancements in population quantity, quality, and
productivity levels to foster a balanced population
distribution. Such an approach will ensure
coordinated development among population
dynamics, natural environment, and socio-economic
facets.
ACKNOWLEDGMENTS
Correspondence should be addressed FENG Wei;
ecorestoration2023@163.com.
REFERENCES
Ju, X. 2022. Advances in remote sensing monitoring of key
elements of cultivated land ecological environment.
Natural Resources Informatization, (03): 59-65.
DOI:10.3969/j.issn.1674-3695.2022.03.010.
Yu, Y. 2022. Applications of 3 D laser scanning technology
in the extraction of vegetation parameters. Journal of
Henan Polytechnic University (Natural Science),
41(04): 51-57. DOI:10.16186/j.cnki.1673-97
87.2020090105.
Zhang, Z. Q. 2022. The evolution pattern and influence of
human activities of landslide driving factors in Wulong
section of the Three Gorges Reservoir area. The
Chinese Journal of Geological Hazard and Control,
33(03): 39-50. DOI:10.16031/j.cnki.issn.1003
-8035.2022.03-05.
Yin, Y. 2022. A Quantitative Study on Cultivated Land
Compensation Based on Ecological Value
Accounting—Taking Shenyang City As an Example.
Natural Resource Economics of China, 35(11): 18-24.
DOI:10.19676/j.cnki.1672-6995.000750.
Li, B. 2022. The Coordination and temporal-spacial
evolution pattern between population urbanization and
land urbanization——A case study on 18 cities in
Sichuan. Natural Resources Information, (09): 29-36.
Jin, S. Z. 2022. Prediction of Carbon Emission in
Chongqing Based on Support Vector Regression.
Journal of Chongqing University of Science and
Technology (Natural Sciences Edition), 24(01): 110-114.
DOI:10.19406/j.cnki.cqkjxyxbzkb.2022.01.018.
Shi, S. H. 2022. Heavy Metal Migration and Soil Pollution
Assessment in an Intensive Mining Area in the
Southwest China. Metal Mine, (02): 194-200.
DOI:10.19614/j.cnki.jsks.202202026.
Zhou, X. 2022. Analysis on spatio-temporal measure and
evolution characteristics of information entropy of land
use structure in the Yangtze River Delta urban
agglomeration. Natural Resources Informatization, (01):
44-51. DOI: 10.3969/j.issn.1674-3695.2022.01.008.
Bao, J. J. 2022. Temporal and spatial evolution of
coordinated development between new urbanization
and intensive use of cultivated land in Gansu. Natural
Resources Information, (08): 42-50. DOI:10.3969/j.is
sn.1674-3709.2022.08.007.
Gao, M. M. 2022. Spatial and temporal variations in
vegetation index and its impact factors in the West
Liaohe Plain in Inner Mongolia. Hydrogeology &
Engineering Geology, 49(01): 175-182. DOI:10.16030
/j.cnki.issn.1000-3665.202104046.
Wang, N. 2021. Mine Environment Investigation and
Research Based on Remote Sensing Technology:A
Case Study of the Jidong Iron Mine. Metal Mine, (10):
192-198. DOI:10.19614/j.cnki.jsks.202110026.
Dang, Y. G. 2022. Discussion on the Top-level Design and
Optimization of the System of Cultivated Land
Requisition-Compensation Balance. Natural Resource
Economics of China, 35(06): 43-48, 88. DOI:
10.19676/j.cnki.1672-6995.000669.
Liao, Z. M. 2022. Habitat Quality Assessment Based on
InVEST Model in Dianchi Basin. Ecology and
Environmental Monitoring of Three Gorges, 7(02): 42-
52. DOI:10.19478/j.cnki.2096-2347.2022.02.05.
Ye, S. S. 2019. Ecological Environmental Cost Accounting
of Mining Area Based on the Green Mine: A Case from
a Mining Area in the North China Plain. Metal Mine, (04):
168-174. DOI:10.19614/j.cnki.jsks.201904031.
Hou, J. W. 2023. Discourse on scientific advancements in
mining ecological restoration. Mining Safety &
Environmental Protection, 50(06): 1-6,15. DOI:
10.19835/j.issn.1008-4495.2023.06.001.
Xie, Y. 2023. Analysis of land use change and influencing
factors based on GIS and RS:A case of Hefei. Natural
Resources Informatization, (04): 18-23. DOI:
10.3969/j.issn.1674-3695.2023.04.003.
Ma, J. X. 2023. Spatio-temporal change characteristics of
water conservation function in the Zhang-Cheng
district based on the InVEST model. Hydrogeology &
Engineering Geology, 50(03): 54-64. DOI:
10.16030/j.cnki.issn.1000-3665.202208084.
Guan, D. J. 2023. Study on the Spatial-temporal Coupling
Relationship between New Urbanization and Logistics
Analysis of Population Spatial Distribution in Counties of Guangdong Province Based on Spatial Autocorrelation
29

Industry: Based on the Panel Data of Anhui Province.
Journal of Cangzhou Normal University, 39(01): 51-55.
DOI:10.13834/j.cnki.czsfxyxb.2023.01.012.
Kang, S. Y. 2023. Analysis of land use change and driving
factors in Chengdu from 2010 to 2020. Natural
Resources Information, (03): 43-50.
DOI:10.3969/j.issn.1674-3709.2023.03.006.
Ye, S. S. 2023. Comprehensive Management of Ecological
Protection and Restoration Funds. Finance and
Accounting for International Commerce, (20): 54-58.
DOI:10.3969/j.issn.1673-8594.2023.20.009.
Li, X. L. 2023. Theoretical analysis and engineering
practice of dynamic pre-reclamation in coal mining
subsidence area. Mining Safety & Environmental
Protection, 50(01): 86-91. DOI:10.19835/j.issn.1008-
4495.2023.01.015.
Zhang, Y. 2022. Selection of pioneer plants for repairing
limestone high and steep slopes in North China. The
Chinese Journal of Geological Hazard and Control, 33(05):
109-118. DOI:10.16031/j.cnki.issn.1003-8035.202110012.
Xu, L. 2023. Carbon Storage Change in Xishuangbanna
Based on PLUS and InVEST Model. Ecology and
Environmental Monitoring of Three Gorges, 8(02): 75-
87. DOI:10.19478/j.cnki.2096-2347.2023.02.10.
Li, X. R. 2022. Study on the development situation and
countermeasures of non-grain utilization of cultivated
land in China. Natural Resources Information, (08): 29-
35. DOI:10.3969/j.issn.1674-3709.2022.08.005.
ICESCE 2024 - The International Conference on Environmental Science and Civil Engineering
30
