
Study on the Changes in Arable Land Resources and Driving Forces
in the North China Region Based on Urbanization
Yang Yu
1,2 a
, Yilun Lin
3b
and Guowei Liu
1,2,* c
1
China Institute of Geo-Environment Monitoring, Beijing 100081, China
2
Key Laboratory of Mine Ecological Effects and Systematic Restoration, Ministry of Natural Resources,
Beijing 100081, China
3
Shandong Taishan Resources Exploration Co., Ltd, Jinan 250100, China
*
Keywords: Urbanization, Arable Land Resources, Driving Forces, Principal Component Analysis.
Abstract: Urbanization is a multifaceted and interdisciplinary social phenomenon, encompassing a broad range of
research fields including, but not limited to, sociology, economics, and geography. The fundamental
characteristic of urbanization is the large-scale migration and concentration of populations from rural to
urban areas. As the urbanization process continues to deepen, its impact on the quantity of arable land
resources and its interaction with socio-economic development have emerged as focal points of concern for
both academia and policymakers. This study selects Hebei Province as a case study, aiming to explore the
effects of urbanization on arable land resource quantity and to analyze the intrinsic connections between
these changes and socio-economic development by examining time series data from 2000 to 2021. Initially,
a comprehensive qualitative analysis is conducted to assess the potential impacts of urbanization on arable
land resources. Subsequently, quantitative research methods such as Principal Component Analysis (PCA)
and Multiple Linear Regression (MLR) are employed to systematically identify and quantify the key driving
factors influencing variations in arable land resources.
a
https://orcid.org/0000-0001-6584-4050
b
https://orcid.org/0009-0003-1487-6046
c
https://orcid.org/0000-0001-6917-2773
1 INTRODUCTION
This study focuses on the North China region,
encompassing Hebei Province, Beijing, and Tianjin,
and employs quantitative research methods such as
Principal Component Analysis (PCA) and Multiple
Linear Regression (MLR) to comprehensively
investigate the dynamic driving factors behind
changes in arable land resources from 2000 to 2021.
By delving deeply into statistical data, the research
reveals the complex and diverse roles played by
various factors in the fluctuations of arable land
resources (Yu, 2022; Zhang, 2022; Wang, 2021; Ye,
2019; Hou, 2023).
2 STUDY AREA OVERVIEW
Hebei Province is situated in the North China Plain,
bordered by the Bohai Sea to the east, Henan
Province to the south, Shanxi Province to the west,
and the Inner Mongolia Autonomous Region to the
north, with Hebei Province to the northeast. The
province features a complex and diverse topography
that includes expansive plains, mountainous regions,
plateaus, and basins. Beijing, located in northern
China, occupies a position of significant geopolitical
importance. It lies in the northern part of the North
China Plain and serves as the political, cultural, and
transportation center of the nation. Tianjin, one of
China's directly administered municipalities, is
located in the northeastern part of the North China
Plain, bordering the Bohai Sea to the east, the
Yanshan Mountains to the north, Hebei Province to
Yu, Y., Lin, Y., Liu and G.
Study on the Changes in Arable Land Resources and Driving Forces in the North China Region Based on Urbanization.
DOI: 10.5220/0013572800004671
In Proceedings of the 7th International Conference on Environmental Science and Civil Engineering (ICESCE 2024), pages 17-23
ISBN: 978-989-758-764-1; ISSN: 3051-701X
Copyright © 2025 by Paper published under CC license (CC BY-NC-ND 4.0)
17
the south, and Beijing to the west. Tianjin is a
critical industrial base and commercial hub in China,
boasting advanced sectors such as manufacturing,
petrochemicals, shipping, and more, while also
being a key center for finance, education, and
research in northern China.
3 DATA AND METHODS
3.1 Data Sources
This study adheres to a rigorous scientific research
methodology, aiming to ensure the scientific
integrity of the research design, the feasibility of
empirical analysis, and the standardization of the
data collection process. The research team utilized
the multidimensional data resources provided by the
"Statistical Yearbook of Hebei Province," the
"Statistical Yearbook of Beijing," and the "Statistical
Yearbook of Tianjin," thereby establishing a robust
data foundation for the investigation.
3.2 Research Content and Methods
The study will employ Principal Component
Analysis (PCA) to develop a model of the driving
factors behind changes in arable land resources in
the research area (Xie, 2023; Ma, 2023; Guan, 2023;
Ye, 2023; Li, 2023). Through PCA, correlation
analysis, and regression analysis, we will thoroughly
elucidate the mechanisms driving changes in arable
land quantity (Zhang, 2022; Xu, 2023). This
research will quantitatively examine indicators such
as population growth, economic development, and
social progress, as detailed in Table 1.
Table 1: Indicator System for Driving Forces of Arable
Land Resource Changes.
Indicator Variable
Urban Po
p
ulation Pro
p
ortion
x
1
Per Capita GDP
x
2
Fixed Asset Investment in Secondary
Industr
y
x
3
Fixed Asset Investment in Tertiary Industr
y
x
4
Secondary Industry Output Ratio
x
5
Tertiary Industry Output Ratio
x
6
Dis
p
osable Income of Urban Residents
x
7
Per Ca
p
ita Net Income of Rural Residents
x
8
Built-u
p
Area
x
9
Real Estate Development Investment
x
10
4 RESULTS AND ANALYSIS
4.1 Changes in Arable Land Resources
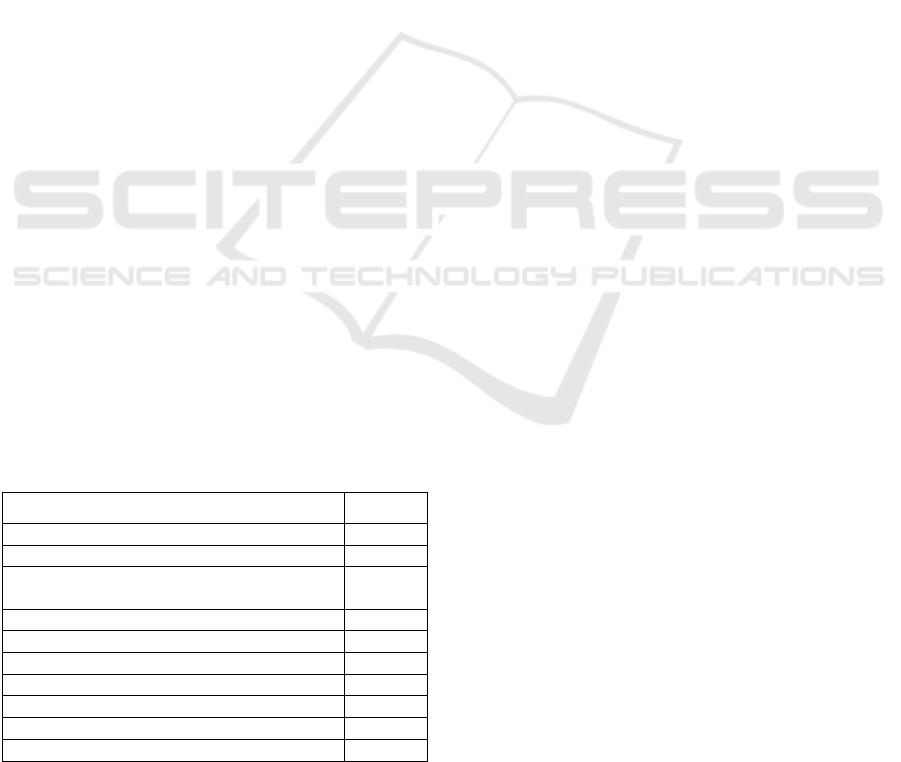
During the extensive research period from 2000 to
2021, significant reductions in agricultural land
resources were observed in Hebei Province, Beijing,
and Tianjin. The analysis reveals that the total area
of arable land in Hebei Province decreased from
6.88326 million hectares in 2000 to 5.90144 million
hectares in 2021, indicating an average annual
reduction rate of 46,700 hectares. In Beijing, the
total area of arable land markedly diminished from
329,000 hectares in 2000 to 127,860 hectares in
2021. Similarly, Tianjin's arable land area declined
from 483,430 hectares in 2000 to 366,250 hectares
in 2021, reflecting a significant contraction.
Moreover, further statistical analysis indicates that,
compared to the initial year of the study period,
Hebei Province experienced a total decline of 0.67%
in arable land resources, while Beijing's annual
average reduction was approximately 9,570 hectares,
and Tianjin's average annual reduction rate was
about 5,580 hectares.
4.2 Drivers of Changes in Arable Land
Resources
4.2.1 Indicators and Evaluation
(a) Correlation Test of Initial Variables
Figure 2 presents the correlation coefficient matrix
of ten initial explanatory variables influencing the
quantity of arable land resources. This study aims to
conduct a thorough analysis of the interactions
among these variables and the intricate network of
relationships they form. The correlation coefficient
matrix reveals a pervasive correlation exceeding
0.95 among these indicators in Hebei Province,
above 0.80 in Beijing, and greater than 0.80 in
Tianjin, underscoring a degree of interrelatedness
among the provinces in North China, which may
result in partial information redundancy.
(b) KMO Test and Bartlett's Test of Sphericity
To assess the suitability of the dataset for Principal
Component Analysis (PCA), this study employed
the Kaiser-Meyer-Olkin (KMO) test and Bartlett's
Test of Sphericity as statistical tools. The statistical
results presented in Table 2 clearly indicate the
significance of both the KMO test and Bartlett's test,
thereby further validating the appropriateness of
conducting PCA. Consequently, it can be concluded
ICESCE 2024 - The International Conference on Environmental Science and Civil Engineering
18
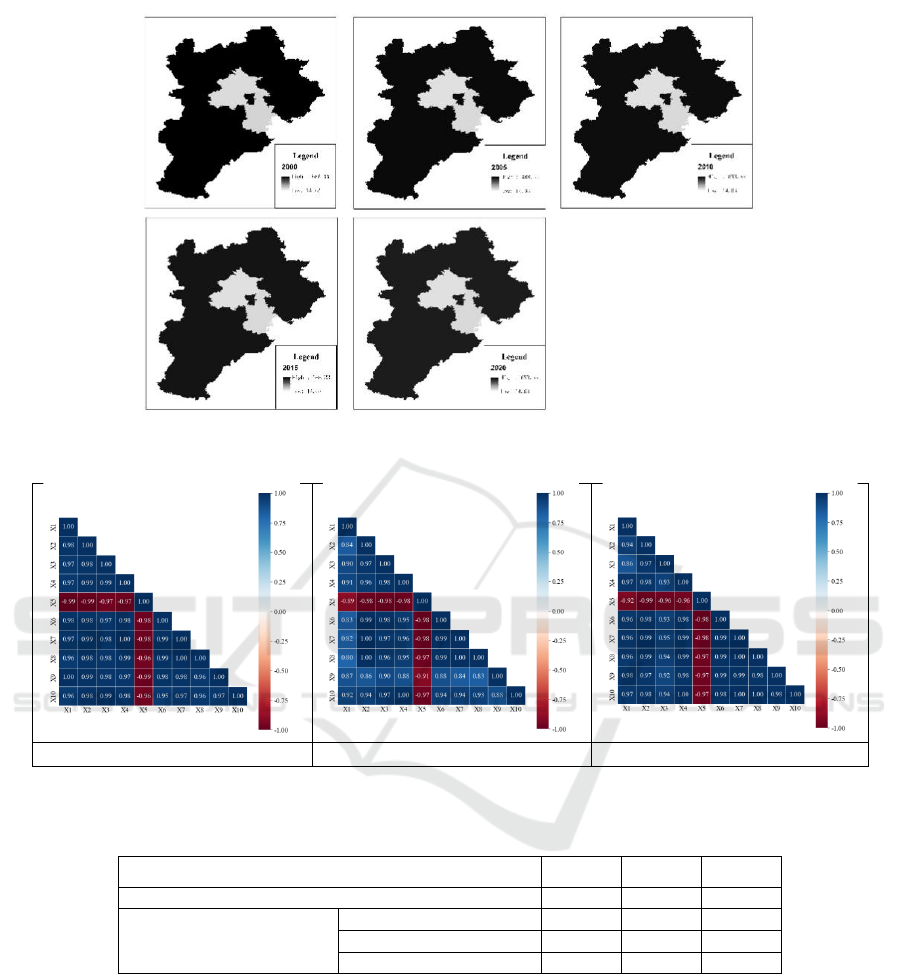
Figure 1: Changes in the Quantity of Arable Land Resources in North China.
Hebei Bei
j
in
g
Tian
j
in
Figure 2: Correlation Coefficient Matrix of Variables.
Table 2: KMO and Bartlett's Test for Arable Land Resources.
Hebei Beijing Tianjin
KMO Measure of Sam
p
lin
g
Ade
q
uac
y
0.774 0.873 0.857
Bartlett's Test of Sphericity
A
pp
roximate Chi-S
q
uare 782.514 658.461 729.733
Degrees of Freedom 45 45 45
Significance 0 0 0
that the dataset exhibits reliability for PCA,
demonstrating the potential to effectively extract
principal factors (Figure 1).
4.2.2 Eigenvalues and Contribution Rates
In this study, the results of the Principal Component
Analysis (PCA) presented in Table 3 reveal the
underlying structure of the observed variable set.
The cumulative contribution rate of the first two
principal components in Hebei Province reaches an
impressive 99.025%, while in Beijing, it is 97.552%,
and in Tianjin, it stands at 98.048%. All these
figures significantly exceed the recommended
statistical threshold, indicating that the analysis
effectively captures the variance through the first
two principal components, F1 and F2.
Study on the Changes in Arable Land Resources and Driving Forces in the North China Region Based on Urbanization
19
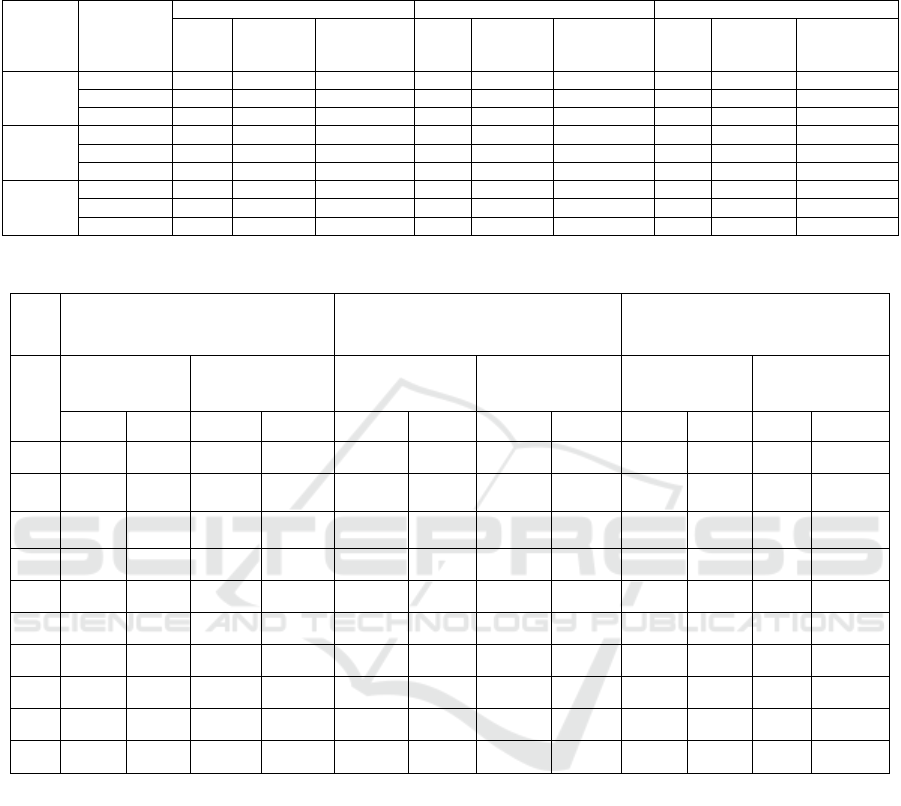
Table 3: Principal Component Analysis.
province Component
Initial Eigenvalues Extracted Sum of Squares Loadings Rotated Sum of Squares Loadings
Total
Contributio
n Rate
Cumulative
Contribution
Rate
Total
Contributio
n Rate
Cumulative
Contribution
Rate
Total
Contributio
n Rate
Cumulative
Contribution
Rate
Hebei
F
1
9.811 98.111 98.111 9.811 98.111 98.111 5.109 51.095 51.095
F
2
0.091 0.914 99.025 0.091 0.914 99.025 4.793 47.931 99.025
F
3
0.064 0.644 99.670
Beijing
F
1
9.406 94.055 94.055 9.406 94.055 94.055 5.534 55.342 55.342
F
2
0.350 3.497 97.552 0.350 3.497 97.552 4.221 42.211 97.552
F
3
0.154 1.536 99.088
Tianjin
F
1
9.732 97.320 97.320 9.732 97.320 97.320 5.203 52.033 52.033
F
2
0.173 1.728 99.048 0.173 1.728 99.048 4.701 47.015 99.048
F
3
0.047 0.475 99.523
Table 4: Rotated Component Loadings and Component Score Coefficients Matrix.
Hebei Beijing Tianjin
Rotated
Component
Matrix
Component Score
Coefficients
Matrix
Rotated
Component
Matrix
Component Score
Coefficients
Matrix
Rotated
Component
Matrix
Component Score
Coefficients
Matrix
1 2 1 2 1 2 1 2 1 2 1 2
x
1
0.603 0.797 -1.091 1.272 0.439 0.874 -0.627 0.872 0.868 0.490 1.036 -0.948
x
2
0.718 0.691 0.097 0.046 0.848 0.524 0.375 -0.274 0.654 0.753
-
0.307
0.472
x
3
0.771 0.628 0.717 -0.596 0.743 0.658 0.057 0.095 0.502 0.859
-
1.033
1.232
x
4
0.778 0.626 0.767 -0.647 0.717 0.679 -0.004 0.165 0.764 0.635 0.332 -0.202
x
5
-0.633 -0.770 0.788 -0.959 -0.765 -0.637 -0.114 -0.030 -0.633 -0.762 0.391 -0.559
x
6
0.679 0.723 -0.288 0.443 0.836 0.539 0.339 -0.232 0.741 0.661 0.195 -0.058
x
7
0.747 0.660 0.419 -0.287 0.867 0.496 0.437 -0.346 0.726 0.686 0.082 0.063
x
8
0.773 0.621 0.770 -0.651 0.883 0.468 0.496 -0.415 0.740 0.668 0.174 -0.034
x
9
0.630 0.774 -0.823 0.996 0.518 0.795 -0.419 0.633 0.779 0.617 0.425 -0.300
x
10
0.785 0.601 0.945 -0.832 0.687 0.705 -0.078 0.250 0.745 0.662 0.203 -0.066
4.2.3 Establishment of Principal Component
Linear Models
Based on the principal component score coefficient
tables (Table 4), the final principal component score
formulas for the North China Region are derived as
follows(Fa represents Hebei Province, F
b
represents
Beijing, and Fc represents Tianjin):
F
a1
=-1.091x
1
+0.097x
2
+0.717x
3
+0.767x
4
+0.788x
5
-0.2
88x
6
+0.419x
7
+0.770x
8
-0.823x
9
+0.945x
10
(1)
F
a2
=1.272x
1
+0.046x
2
-0.596x
3
-0.647x
4
-0.959x
5
+0.44
3x
6
-0.287x
7
-0.651x
8
+0.996x
9
-0.832x
10
(2)
F
b1
=-0.627x
1
+0.375x
2
+0.057x
3
-0.004x
4
-0.114x
5
+0.3
39x
6
+0.437x
7
+0.496x
8
-0.419x
9
-0.078x
10
(3)
F
b2
=0.872x
1
-0.274x
2
+0.095x
3
+0.165x
4
-0.030x
5
-0.23
2x
6
-0.346x
7
-0.415x
8
+0.633x
9
+0.250x
10
(4)
F
c1
=1.036x
1
-0.307x
2
-1.033x
3
+0.332x
4
+0.391x
5
+0.19
5x
6
+0.082x
7
+0.174x
8
+0.425x
9
+0.203x
10
(5)
F
c2
=-0.948x
1
+0.472x
2
+1.232x
3
-0.202x
4
-0.559x
5
-0.05
8x
6
+0.063x
7
-0.034x
8
-0.300x
9
-0.066x
10
(6)
4.2.4 Comprehensive Score
Based on the findings of this study, the
comprehensive evaluation model for principal
components is calculated using the proportion of
each principal component's eigenvalue relative to the
sum of the eigenvalues of the extracted principal
components as weights:
ICESCE 2024 - The International Conference on Environmental Science and Civil Engineering
20
F=
∑
𝜆
𝐹
=𝜆
𝐹
+𝜆
𝐹
(7)
In the equation above, F represents the
comprehensive score for the variation in arable land
resources across the north China Region; 𝜆
denotes
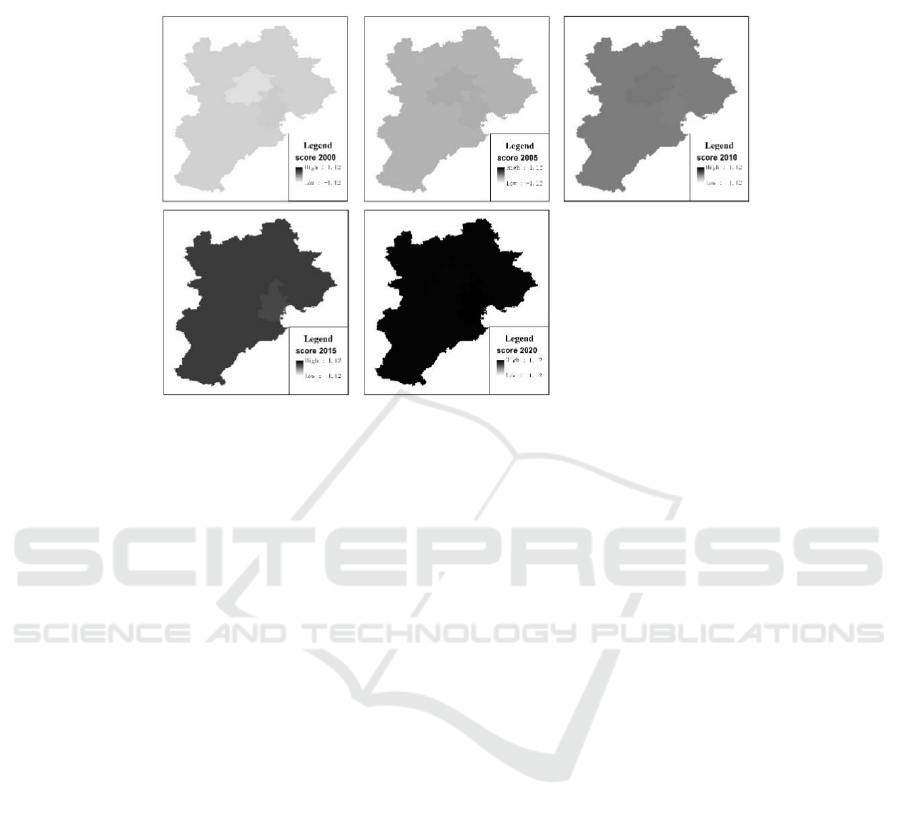
Figure 3: Changes in the composite driving force score of arable land resource quantity in North China.
the eigenvalue of the k-th principal component
(where k=1,2).
This research team adopted Principal Component
Analysis (PCA) as a quantitative methodology to
investigate the underlying dynamics of changes in
arable land resources in Hebei Province, Beijing,
and Tianjin. By constructing a weighted coefficient
matrix, the PCA method provided a comprehensive
analysis of time series data from 2000 to 2021. This
integrated assessment model elucidated the overall
trend in changes to arable land resources over this
period. Notably, prior to 2012, the composite driving
force score was negative, indicating that arable land
resources were predominantly influenced by
constraining factors. However, beginning in 2012,
the score shifted to positive, suggesting a trend of
positive enhancement in the factors affecting arable
land resources in subsequent years (Figure 3).
4.3 Evaluation of Driving Factors for
Changes in Arable Land Resources
in the North China Region
The study reveals that the variation in arable land
resources across the North China Region is
correlated with several selected factors. These
factors include the proportion of urban population
(x
1
), per capita GDP (x
2
), fixed asset investment in
the secondary industry (x
3
), fixed asset investment in
the tertiary industry (x
4
), output value ratio of the
secondary industry (x
5
), output value ratio of the
tertiary industry (x
6
), disposable income of urban
residents (x
7
), per capita net income of rural
residents (x
8
), built-up area (x
9
), and investment in
real estate development (x
10
).
The coefficient of determination R
2
for Hebei
Province, Beijing, and Tianjin in North China are
0.980, 0.830, and 0.785, respectively. These values
indicate that the two independent variables included
in the regression models account for 98.0%, 83.0%,
and 78.5% of the variance in the dependent variable,
demonstrating an excellent fit of the equations. This
provides substantial reference value for assessing
changes in arable land resources in North China. The
principal component regression equations
established in this study are as follows (Table 5):
Y
a
=634.209-15.833x
1
-21.000x
2
(8)
Y
b
=22.497-2.645x
1
-2.877x
2
(9)
Y
c
=43.754-2.135x
1
-1.765x
2
(10)
Substitute the ten principal component factors
into the principal component regression model to
calculate the corresponding parameters in the
original regression model (see Table 6), thereby
obtaining the standard regression model that
eliminates multicollinearity :
Y
a
=634.209-9.433x
1
-2.499x
2
+1.155x
3
+1.438x
4
+
7.663x
5
-4.736x
6
-0.606x
7
+1.478x
8
-7.876x
9
+
2.514x
10
(11)
Y
b
=22.497-0.852x
1
-0.204x
2
-0.425x
3
-0.464x
4
+0.388x
5
Study on the Changes in Arable Land Resources and Driving Forces in the North China Region Based on Urbanization
21

-0.229x
6
-0.160x
7
-0.116x
8
-0.713x
9
-0.512x
10
(12)
Y
c
=43.754-0.539x
1
-0.177x
2
+0.032x
3
-0.353x
4
+0.152x
5
-0.315x
6
-0.286x
7
-0.310x
8
-0.378x
9
-0.318x
10
(13)
Table 5: Regression Analysis Results of Principal Components.
Unstandardized Coefficients
Standardized Coefficients t-Statistic Sig
Coefficient Standard Error
Hebei
Constant 634.209 0.848 748.182 0.000
F
1
-15.833 0.868 -0.596 -18.249 0.000
F
2
-21.000 0.868 -0.790 -24.205 0.000
R² 0.980
Beijing
Constant 22.497 0.397 56.673 0.000
F
1
-2.645 0.406 -0.616 -6.510 0.000
F
2
-2.877 0.406 -0.671 -7.081 0.000
R² 0.830
Tianjin
Constant 43.754 0.325 134.804 0.000
F
1
-2.135 0.332 -0.683 -6.427 0.000
F
2
-1.765 0.332 -0.565 -5.313 0.000
R² 0.785
Table 6: Regression Coefficients for Each Original Variable.
Hebei Beijing Tianjin
F
1
μ
1
F
1
F
2
μ
2
F
2
μ
n
F
n
F
1
μ
1
F
1
F
2
μ
2
F
2
μ
n
F
n
F
1
μ
1
F
1
F
2
μ
2
F
2
μ
n
F
n
x
1
-
1.091
1.272 17.270
-
26.702
-9.433
-
0.627
0.872 1.658 -2.509 -0.852 1.036 -0.948
-
2.212
1.673 -0.539
x
2
0.097 0.046 -1.532 -0.966 -2.499 0.375 -0.274
-
0.993
0.789 -0.204
-
0.307
0.472 0.656 -0.833 -0.177
x
3
0.717 -0.596
-
11.357
12.512 1.155 0.057 0.095
-
0.151
-0.274 -0.425
-
1.033
1.232 2.207 -2.174 0.032
x
4
0.767 -0.647
-
12.148
13.586 1.438
-
0.004
0.165 0.011 -0.475 -0.464 0.332 -0.202
-
0.709
0.357 -0.353
x
5
0.788 -0.959
-
12.469
20.131 7.663
-
0.114
-0.030 0.302 0.086 0.388 0.391 -0.559
-
0.834
0.986 0.152
x
6
-
0.288
0.443 4.557 -9.293 -4.736 0.339 -0.232
-
0.897
0.669 -0.229 0.195 -0.058
-
0.417
0.102 -0.315
x
7
0.419 -0.287 -6.641 6.036 -0.606 0.437 -0.346
-
1.156
0.997 -0.160 0.082 0.063
-
0.174
-0.111 -0.286
x
8
0.770 -0.651
-
12.196
13.674 1.478 0.496 -0.415
-
1.311
1.195 -0.116 0.174 -0.034
-
0.370
0.060 -0.310
x
9
-
0.823
0.996 13.036
-
20.912
-7.876
-
0.419
0.633 1.107 -1.820 -0.713 0.425 -0.300
-
0.908
0.530 -0.378
x
10
0.945 -0.832
-
14.955
17.469 2.514
-
0.078
0.250 0.207 -0.719 -0.512 0.203 -0.066
-
0.434
0.116 -0.318
5 CONCLUSION
Between 2000 and 2021, the urbanization process in
Hebei Province, Beijing, and Tianjin in North China
exhibited a significant upward trend, a phenomenon
resulting from the complex interplay of various
factors. The findings indicate that prior to 2012, the
composite impact score for arable land resources in
North China was negative, suggesting that during
this period, the quantity of arable land was
predominantly influenced by inhibiting factors.
After 2012, the composite score shifted to a positive
value, indicating a gradual strengthening of the
drivers affecting changes in the quantity of arable
land resources in North China.
ICESCE 2024 - The International Conference on Environmental Science and Civil Engineering
22

ACKNOWLEDGMENTS
Correspondence should be addressed LIU Guowei;
ecorestoration2023@163.com.
REFERENCES
Yu, Y. 2022. Applications of 3 D laser scanning
technology in the extraction of vegetation parameters .
Journal of Henan Polytechnic University (Natural
Science), 41(04): 51-57. DOI:10.16186/j.cnki.1673-
9787.2020090105.
Zhang, Z. Q. 2022. The evolution pattern and influence of
human activities of landslide driving factors in
Wulong section of the Three Gorges Reservoir area.
The Chinese Journal of Geological Hazard and
Control, 33(03): 39-50.
DOI:10.16031/j.cnki.issn.1003-8035.2022.03-05.
Wang, N. 2021. Mine Environment Investigation and
Research Based on Remote Sensing Technology:A
Case Study of the Jidong Iron Mine. Metal Mine, (10):
192-198. DOI:10.19614/j.cnki.jsks.202110026.
Ye, S. S. 2019. Ecological Environmental Cost
Accounting of Mining Area Based on the Green Mine:
A Case from a Mining Area in the North China Plain .
Metal Mine, (04): 168-174.
DOI:10.19614/j.cnki.jsks.201904031.
Hou, J. W. 2023. Discourse on scientific advancements in
mining ecological restoration.Mining Safety &
Environmental Protection, 50(06): 1-6,15.
DOI:10.19835/j.issn.1008-4495.2023.06.001.
Xie, Y. 2023. Analysis of land use change and influencing
factors based on GIS and RS:A case of Hefei. Natural
Resources Informatization, (04): 18-23. DOI:
10.3969/j.issn.1674-3695.2023.04.003.
Ma, J. X. 2023. Spatio-temporal change characteristics of
water conservation function in the Zhang-Cheng
district based on the InVEST model. Hydrogeology &
Engineering Geology, 50(03): 54-64.
DOI:10.16030/j.cnki.issn.1000-3665.202208084.
Guan, D. J. 2023. Study on the Spatial-temporal Coupling
Relationship between New Urbanization and Logistics
Industry: Based on the Panel Data of Anhui Province .
Journal of Cangzhou Normal University, 39(01): 51-
55. DOI:10.13834/j.cnki.czsfxyxb.2023.01.012.
Ye, S. S. 2023. Comprehensive Management of
Ecological Protection and Restoration Funds . Finance
and Accounting for International Commerce, (20): 54-
58. DOI: 10.3969/j.issn.1673-8594.2023.20.009
Li, X. L. 2023. Theoretical analysis and engineering
practice of dynamic pre-reclamation in coal mining
subsidence area. Mining Safety & Environmental
Protection, 50(01): 86-91. DOI:10.19835/j.issn.1008-
4495.2023.01.015.
Zhang, Y. 2022. Selection of pioneer plants for repairing
limestone high and steep slopes in North China. The
Chinese Journal of Geological Hazard and Control,
33(05): 109-118. DOI:10.16031/j.cnki.issn.1003-
8035.202110012.
Xu, L. 2023. Carbon Storage Change in Xishuangbanna
Based on PLUS and InVEST Model . Ecology and
Environmental Monitoring of Three Gorges, 8(02):
75-87. DOI:10.19478/j.cnki.2096-2347.2023.02.10.
Study on the Changes in Arable Land Resources and Driving Forces in the North China Region Based on Urbanization
23
