
Research on Vegetation Cover Change in Sanmenxia City Based on
NDVI from 1990 to 2020
Yaqiu Yin
1,2,3,4 a
, Tingting Wang
5b
and Peiyong He
6,* c
1
Land Consolidation and Rehabilitation Center, Ministry of Natural Resources, Beijing 100035, China
2
Land Science and Technology Innovation Center, Ministry of Natural Resources, Beijing 100035, China
3
Technology Innovation Center for Land Engineering, Ministry of Natural Resources, Beijing 100035, China
4
Key Laboratory of Land Consolidation and Rehabilitation, Ministry of Natural Resources, Beijing 10035, China
5
Shandong Yellow River Ecological Development Group Co., Ltd., Jinan 250014, Shandong, China
6
China Academy of Natural Resources Economics, Beijing 101149, China
*
Keywords: NDVI, Vegetation Cover, Spatiotemporal Change Characteristics, Sanmenxia City.
Abstract: This study examines the spatiotemporal distribution and change characteristics of forest and grassland
vegetation cover in Sanmenxia City from 1990 to 2020, predicting the future trend of forest and grassland
vegetation cover to provide a reference for the establishment of a reference system for ecological restoration
in bauxite mining in Sanmenxia City. Utilizing NDVI time series data from 1990 to 2020, the study employs
annual mean, Theil-Sen median trend analysis, and Mann-Kendall test methods to investigate the
spatiotemporal distribution characteristics of forest and grassland vegetation cover in Sanmenxia City. The
Hurst index is used for predicting the future changes in vegetation cover in the area. Overall, the vegetation
cover in Sanmenxia City mainly shows a pattern of being higher in the south and lower in the north, with the
area of vegetation cover improvement significantly exceeding the area of degradation from 1990 to 2020. The
future outlook for vegetation cover in Sanmenxia City is promising, with areas predicted to have positive
development trends exceeding those with negative trends. Regions with negative trends are primarily located
in the central and northern parts of Sanmenxia City along the Yellow River, expected to shift from
improvement to degradation trends. This calls for significant attention in ecological protection and
management processes.
1 INTRODUCTION
Research on vegetation cover change is an important
aspect of mine ecological restoration studies (Ju,
2022; Yu, 2022; Zhang, Z. Q., 2022; Yin, 2022; Li,
B., 2022; Jin, 2022; Shi, 2022; Zhou, 2022).
Degradation of surface vegetation cover can lead to a
series of severe issues, such as soil erosion,
desertification, shrinkage of lakes and rivers, and
imbalance of carbon sink functions. Currently,
remote sensing technology has become the main
means of monitoring vegetation changes in mining
areas and watersheds during the ecological
restoration process, allowing for macro-scale
acquisition of vegetation change data caused by
a
https://orcid.org/0009-0008-1270-153X
b
https://orcid.org/0009-0006-7683-189X
c
https://orcid.org/0009-0004-6504-0449
mining. Vegetation cover change is usually
characterized by vegetation cover degree and rate.
Vegetation cover (NDVI) generally refers to the ratio
of forest area to total land area, reflecting the area
ratio of vegetation cover. It is an important indicator
for measuring surface vegetation, an essential basis
for describing ecosystems, and a significant
manifestation of regional ecosystem environmental
changes (Bao, 2022; Gao, 2022; Wang, 2021; Dang,
2022; Guan, 2023; Kang, 2023; Ye, 2023; Li, 2023).
Sanmenxia City, rich in mineral resources, serves
as an important base for high-quality bauxite
resources in Henan Province. Due to previous intense
and disorderly mining activities, widespread surface
vegetation cover damage has occurred, necessitating
10
Yin, Y., Wang, T., He and P.
Research on Vegetation Cover Change in Sanmenxia City Based on NDVI from 1990 to 2020.
DOI: 10.5220/0013572700004671
In Proceedings of the 7th International Conference on Environmental Science and Civil Engineering (ICESCE 2024), pages 10-16
ISBN: 978-989-758-764-1; ISSN: 3051-701X
Copyright © 2025 by Paper published under CC license (CC BY-NC-ND 4.0)
urgent resolution. Protecting and restoring surface
vegetation cover has become a current research
hotspot. The changes in vegetation cover and the
resulting ecological environment changes in
Sanmenxia City have a significant impact on regional
sustainable development (Zhang, Y., 2022; Xu, 2023;
Li, X. R., 2022; Liao, 2022; Ye, 2019; Hou, 2023; Xie,
2023; Ma, 2023). Therefore, it is necessary to study
the spatiotemporal change characteristics of
vegetation cover in Sanmenxia City. Accordingly,
this study uses GEE NDVI time series data from 1980
to 2020, employing Theil-Sen median trend analysis
and Mann-Kendall test methods to only research the
spatiotemporal distribution and change
characteristics of forest and grassland vegetation
cover, and uses the Hurst index method to analyze
and predict future development trends, aiming to
provide references for scientific protection and
ecological restoration of bauxite mining in
Sanmenxia City and promote positive succession of
the ecosystem.
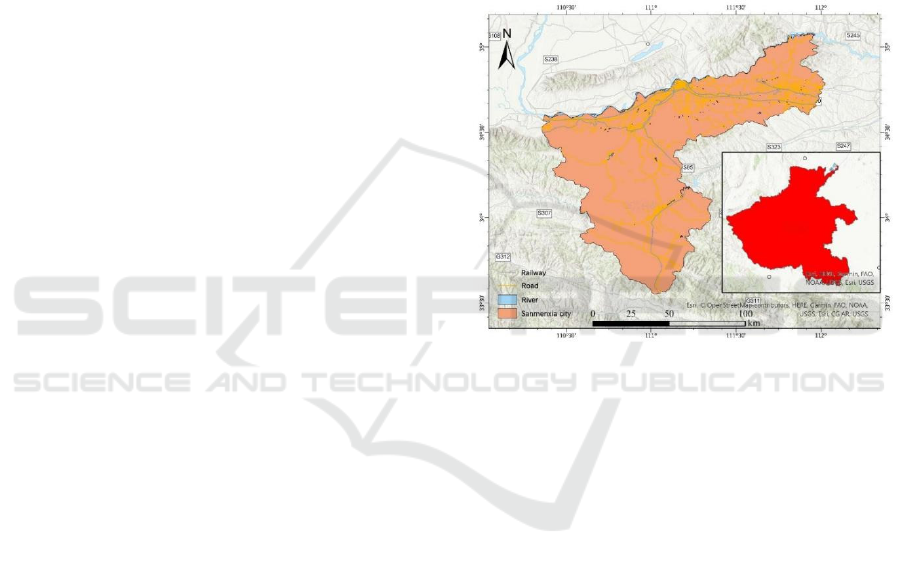
2 STUDY AREA
The project area is located in the northern part of
Sanmenxia, mainly covering the Hubei District and
Shan State District. The area stretches approximately
16km from east to west and 6.9km from north to south,
covering an area of about 110.84km^2. Its
geographical coordinates range from 111°17′0.06″E
to 111°27′43.91″E and from 34°44′40.96″N to
34°50′18.56″N. The terrain is high on both the eastern
and western sides and low in the middle, with most
areas at an elevation of 300m to 500m. The project
area is situated in the Yellow River basin between the
mountains of western Henan and the Taihang
Mountains, featuring a unique geomorphology – the
loess landform, which shares similarities and
differences with the Loess Plateau. Based on genesis
and morphology, the main geomorphological types in
the project area include eroded and accumulated loess
areas, fluvial erosion-accumulation floodplains, and
river valley terraces. Sanmenxia City has a warm
temperate continental monsoon climate, with an
average annual temperature of 13.9°C and annual
rainfall ranging from 530 to 850mm, unevenly
distributed across seasons, primarily concentrated in
July, August, and September. The location of
Sanmenxia City is shown in Figure 1.
3 RESEARCH METHODS
3.1 Data Sources
The NDVI dataset is based on GEE satellite remote
sensing data from continuous time series, with annual
averages used to generate data for the years 1990,
1995, 2000, 2005, 2011, 2015, and 2020, resulting in
a total of seven images with a spatial resolution of
30m. The forest and grassland vector data were
obtained from the 2020 Sanmenxia City land use data,
which was integrated to generate vector data for the
forest and grassland areas of Sanmenxia City.
Figure 1: Location of the Sanmenxia City.
3.2 Inter-Annual Variation and Spatial
Pattern Analysis
The annual mean NDVI for forest and grassland in
Sanmenxia City from 1990 to 2020 was calculated
step by step to obtain data for seven years, analyzing
its temporal change characteristics. The average
NDVI for forest and grassland in Sanmenxia City was
calculated per pixel to obtain the spatial distribution
of the average NDVI over seven years, analyzing its
spatial pattern characteristics.
3.3 Trend Change Analysis
The Sen’s slope trend analysis combined with the
Mann-Kendall trend significance test method was
adopted for analyzing the trend of vegetation cover
change in forest and grassland areas.
The Theil-Sen Median trend analysis is a robust
non-parametric statistical method for calculating
trends, which can reduce the impact of outliers in the
data. The calculation formula is as follows: For the
time series {x_t}, t=1, 2, 3, …, n, define the slope Q:
Research on Vegetation Cover Change in Sanmenxia City Based on NDVI from 1990 to 2020
11
𝑄=𝑀𝑒𝑑𝑖𝑎𝑛
𝑥
−𝑥
𝑏−𝑎
,1≤𝑎
<
𝑏≤𝑛.
(1)
In the formula, x
a
and x
b
are the time series data;
Median represents the median value; when Q>0, the
time series {x
t
} shows an increasing trend, otherwise,
the time series {x
t
} shows a decreasing trend.
The Mann-Kendall non-parametric test method is
used to assess the significance of trends, with the
advantage of not requiring the sample to follow a
normal distribution, and it is not affected by missing
values and outliers. The calculation formula is as
follows: For the time series {x
t
}, t=1,2,3, …, n, define
the statistic S:
𝑆=𝑠𝑔𝑛𝑥
−𝑥
.
(2)
S follows a normal distribution with variance V
s
:
𝑉
=
[
𝑛
(
𝑛−1
)(
2𝑛+5
)
]
/18.
(3)
Define the statistic Z:
𝑍=
⎩
⎪
⎨
⎪
⎧
𝑆−1
𝑉
𝑆
>
0
0 𝑆=0
𝑆+1
𝑉
𝑆
<
0
(4)
In the formula: x
j
and x
i
are time series data; sgn
is the sign function; Z's value range is (-∞,+∞). At a
given significance level α, critical value u
1-2/2
is
determined from the normal distribution table. When
|Z|>u
1-a2
, it indicates that the time series {x
t
} has a
significant change at the {x
t
} level. The trend change
of the time series {x
t
} is judged through a significance
test at a 0.05 confidence level; when Z>1.96, it
indicates that the time series {x
t
} significantly
increases; when 0<Z≤1.96, it indicates that the time
series {x
t
} does not significantly increase; when Z=0,
it indicates that the time series {x
t
} remains
unchanged; when -1.96≤Z<0, it indicates that the time
series {x
t
} does not significantly decrease; when Z<-
1.96, it indicates that the time series {x
t
} significantly
decreases.
3.4 Future Evolution Analysis
The Hurst exponent is an effective method to
quantitatively describe the long-term dependence of a
time series. The calculation method is as follows:
For the time series {x
t
}, t=1,2,3, …, n; for a
positive integer τ, define the mean series 𝑥
:
𝑥
=
∑
𝑥
(τ=1,2,…,n);
(5)
Cumulative deviation sequence 𝑋
,
:
𝑋
,
=
∑(
𝑥
−𝑥
)
(1≤𝑡≤τ)
;
(6)
Range sequence 𝑅
:
𝑅
=𝑚𝑎𝑥𝑋
,
=𝑚𝑖𝑛𝑋
,
(
1≤𝑡≤τ; τ
=1,2,…,n
)
;
(7)
Standard deviation sequence 𝑆
:
𝑆
=
[
∑
(𝑥
−𝑥
)
]
(τ=1,2,…,n)
(8)
If 𝑅
/𝑆
∝τ
holds true, it indicates the
presence of Hurst phenomenon in the time series {x
t
}.
The Hurst exponent (H) can be derived using least
squares regression in the double logarithmic
coordinate system [𝑖𝑛τ,in
(
𝑅
/𝑆
)
] .
Based on the value of H, the time series {x
t
} can
be identified as either completely random or
exhibiting persistence. The Hurst exponent values
encompass three scenarios: if 0.5<H<1, it indicates
that the time series {x
t
} is persistent, meaning future
changes are consistent with past trends, and the closer
H is to 1, the stronger the persistence. If H = 0.5, it
implies that the time series {x
t
} is random with no
long-term correlation. If 0<H<0.5, it signifies that the
time series{x
t
} has anti-persistence, meaning future
trends will be opposite to past trends, and the closer
H is to 0, the stronger the anti-persistence.
4 RESULTS AND ANALYSIS
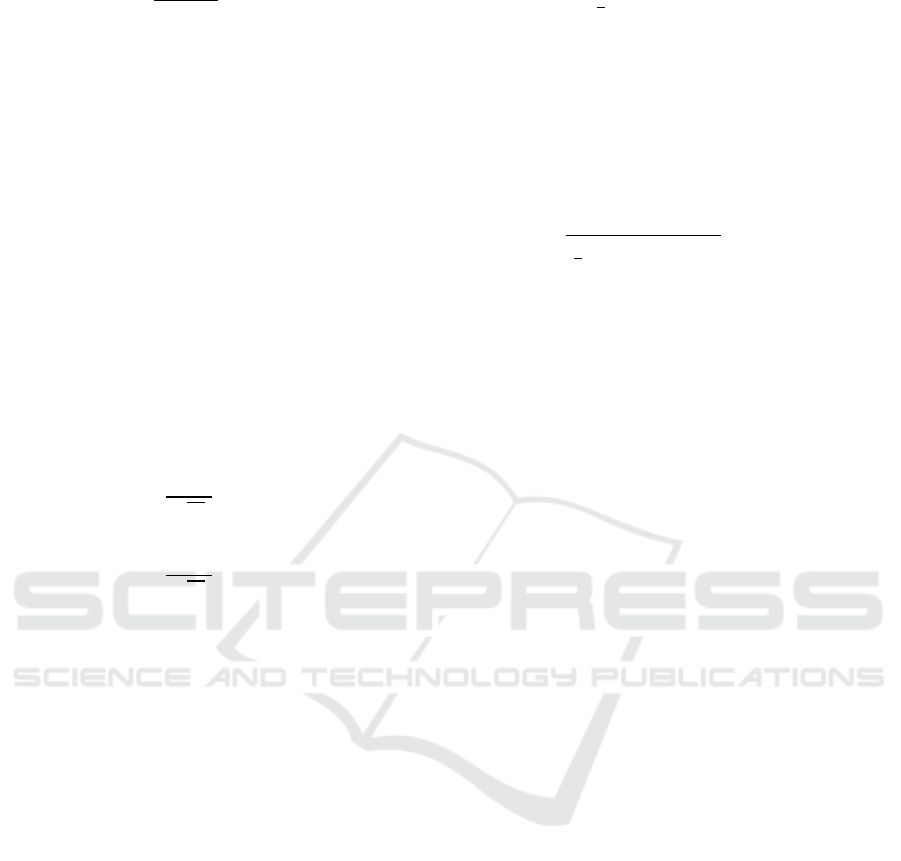
4.1 NDVI Spatial Pattern Analysis
Based on the NDVI time series data from 1990 to
2020, the average values over seven years were
calculated to obtain the spatial distribution map of
NDVI average values in Sanmenxia City (Figure 2),
which was then classified into six levels for statistical
analysis. The results show that the area with high
vegetation cover (NDVI ≥ 0.7) in Sanmenxia City is
3595.42 square kilometers, accounting for 62.12% of
the total forest and grassland area, predominantly
consisting of forested land, shrubland, and sparse
forest, clustering in the southern region of Sanmenxia
City with some distribution in the northernmost areas.
The area with moderate vegetation cover (0.3 ≤ NDVI
< 0.7) covers 2190.37 square kilometers, representing
37.84% of the total forest and grassland area, mainly
distributed around cities and villages within the
region. The area with low vegetation cover (NDVI <
ICESCE 2024 - The International Conference on Environmental Science and Civil Engineering
12
0.3) spans 2.32 square kilometers, merely constituting
0.04% of the forest and grassland area, predominantly
comprising paddy fields and dry land, with sparse
distribution mainly around the areas of medium
vegetation cover in the northern part of Sanmenxia
City.
Figure 2: NDVI mean value in forestland and grassland in
1990-2020.
4.2 Inter-Annual NDVI Variation
Analysis
From 1990 to 2020, the annual average NDVI of
forest and grassland in Sanmenxia City fluctuated but
overall showed an increasing trend, with a growth rate
of approximately 0.187 per annum. The minimum
and maximum values occurred in 1995 and 2020,
respectively, with values of 0.4866 and 0.8258
(Figure 3). The analysis revealed a fluctuating
increase trend from 1990 to 2005 and a stable growth
trend from 2005 to 2020. Overall, the vegetation
cover condition of forest and grassland in Sanmenxia
City significantly improved over these 30 years.
4.3 NDVI Spatial Variation Analysis
Based on Theil-Sen trend analysis results and
adopting the criteria of Q > 0.0005, -0.0005 < Q ≤
0.0005, and Q ≤ -0.0005, the vegetation change of
forest and grassland in Sanmenxia City was classified
into three specific conditions: improvement, stability,
and degradation. The results of the Mann-Kendall test
were divided into significant change and non-
significant change according to |Z| > 1.96 and |Z| ≤
1.96. Combining both results spatially, the trend of
vegetation cover change of forest and grassland can
be categorized into five major types: significant
improvement, slight improvement, stable, slight
degradation, and significant degradation, with their
respective area proportions calculated (Figure 4).
Figure 3: Inter-annual variation of NDVI in forestland and
grassland in 1990-2020.
Figure 4: Change trend of forestry and grass coverage in the
Sanmenxia City during 1990-2020.
From 1990 to 2020, the trend of vegetation cover
change in forest and grassland in Sanmenxia City was
predominantly improvement, covering an area of
5711.81 square kilometers, accounting for 98.68% of
the total forest and grassland area, with significantly
improved areas covering 2823.89 square kilometers,
accounting for 48.79%, mainly distributed on the
southwestern side of Sanmenxia City. The degraded
area covered 69.02 square kilometers, accounting for
1.19% of the total area, primarily slight degradation.
The area with a stable trend in vegetation change
covered 6.21 square kilometers, accounting for 0.13%
of the total area. In summary, the trend of high cover
change in forest and grassland in Sanmenxia City
Research on Vegetation Cover Change in Sanmenxia City Based on NDVI from 1990 to 2020
13
from 1990 to 2020 was characterized by improved
vegetation cover, with slight improvement in low
cover areas.
4.4 Future Evolution Analysis of NDVI
4.4.1 NDVI Spatial Sustainability
Through R/S analysis, the average Hurst exponent for
Sanmenxia City was obtained, indicating the presence
of persistent series in the vegetation cover of forest
and grassland. According to the classification results,
areas with 0.5 < H < 1, accounting for a certain
percentage of the total area, exhibit unidirectional
persistence characteristics, meaning the current trend
of change will continue beyond 2020. Areas with 0 <
H < 0.5, covering a certain area and accounting for a
certain percentage of the total area, show reverse
direction persistence characteristics, indicating the
future trend of vegetation cover change will be
opposite to the current trend.
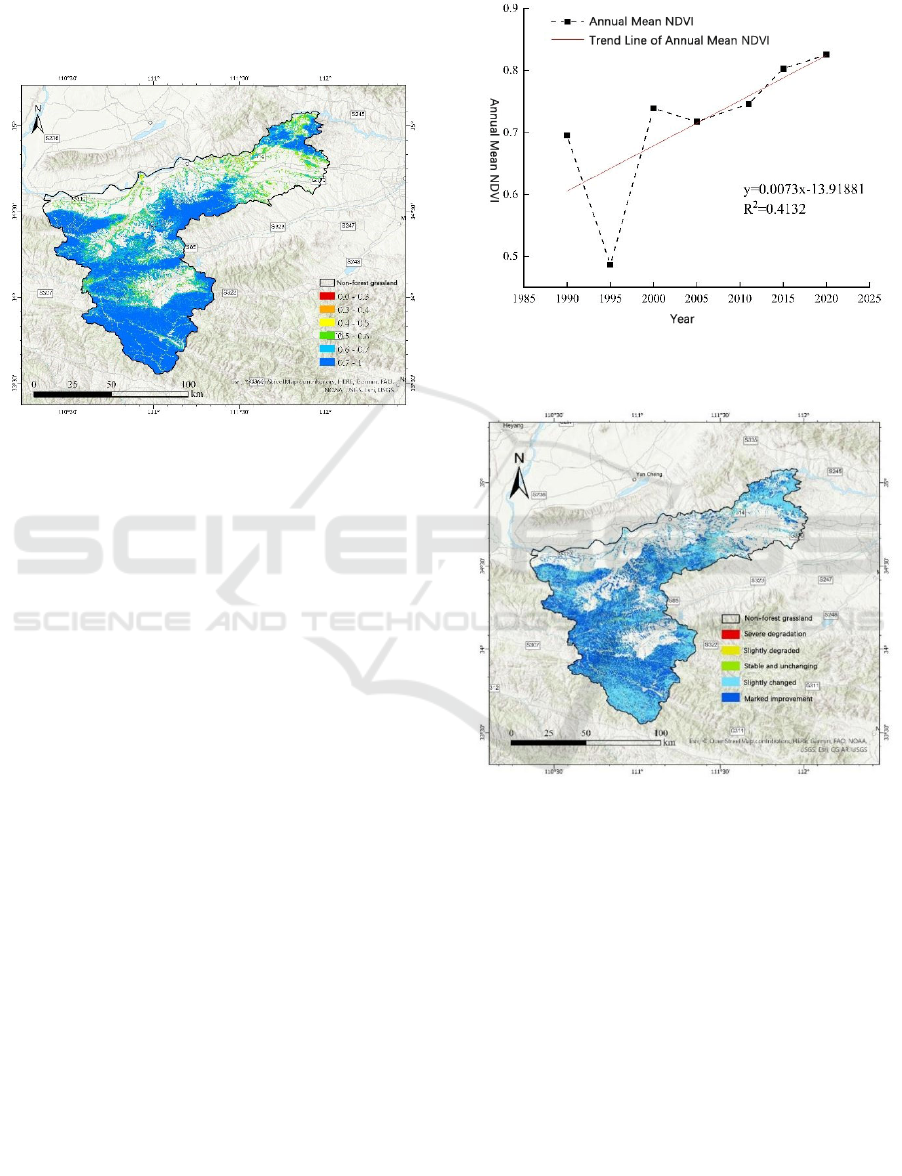
4.4.2 Future Development Trends of NDVI
Overlaying the spatial sustainability characteristics of
NDVI with the spatial change trends reveals the
future development directions of vegetation cover in
forest and grassland areas of Sanmenxia City. The
results are divided into four development directions:
benign, malignant, stable, and uncertain. Areas with a
benign development trend account for 71.401% of the
total forest and grassland area, with their spatial
distribution largely coinciding with the areas showing
vegetation cover improvement, among which, areas
of persistent slight improvement account for 33.308%,
and areas of persistent significant improvement also
contribute significantly; areas showing antipersistent
degradation account for 0.263%, indicating that these
areas will transition from degradation to benign
development in the future. The area showing a
malignant development trend accounts for 28.522%
of the total forest and grassland area, with its spatial
distribution largely aligning with the vegetation
degradation areas, among which, areas of slight and
significant degradation account for 0.92% and 0.012%
respectively; antipersistent improvement areas
account for 27.59%, primarily located in the central
and northern parts of Sanmenxia City along the
Yellow River, predicted to transition from
improvement to degradation. Areas with stable and
uncertain trends in vegetation cover change constitute
0.107% of the total area (Figure 5 and Table 1).
Figure 5: Future development trend of forestry and grass
coverage.
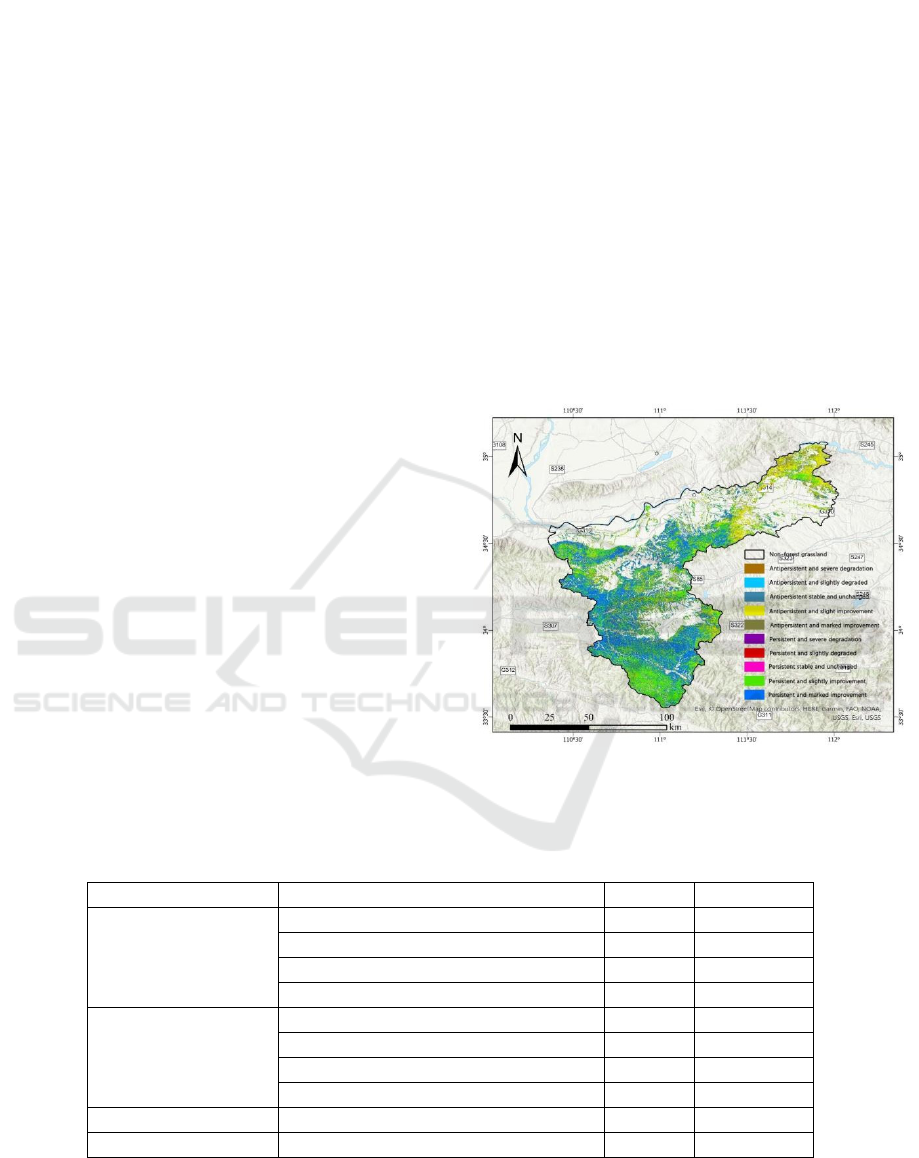
Table 1: Future development direction of forestry and grass coverage.
Develo
p
ment Direction Overla
y
Results Area
/
km
2
Pro
p
ortion/%
Benign Direction
Persistent & Sli
g
ht Im
p
rovement 1926.11 33.308
Persistent & Si
g
nificant Im
p
rovement 2189.15 37.83
Anti
p
ersistent & Severe De
g
radation 0.17 0.003
Anti
p
ersistent & Sli
g
ht De
g
radation 14.96 0.26
Malignant Direction
Persistent & Severe De
g
radation 0.72 0.012
Persistent & Sli
g
ht De
g
radation 53.17 0.92
Anti
p
ersistent & Sli
g
ht Im
p
rovement 961.81 16.62
Anti
p
ersistent & Si
g
nificant Im
p
rovement 634.74 10.97
Stable Persistent & Stable Unchan
g
e
d
1.54 0.027
Uncertain Anti
p
ersistent & Stable Unchan
g
e
d
4.67 0.08
ICESCE 2024 - The International Conference on Environmental Science and Civil Engineering
14

5 CONCLUSION
This paper, based on NDVI time series data from
1990 to 2020 and employing Theil-Sen Median trend
analysis, Mann-Kendall test, and Hurst index
methods, analyzes the spatiotemporal characteristics
and predicts future trends of vegetation cover change
in forest and grassland in Sanmenxia City from 1990
to 2020. The main conclusions are as follows:
Overall, the vegetation cover of forest and
grassland in Sanmenxia City primarily exhibits high
coverage in the south and low coverage in the north.
High coverage areas are mainly located in the
southwestern regions such as Panhe Township,
Xujiawan Township, and Wayaogou Township, while
low coverage areas are predominantly found in the
northern parts of Sanmenxia City, such as Gongqian
Township.
From 1990 to 2020, the annual average NDVI of
forest and grassland in Sanmenxia City fluctuated but
showed an overall increasing trend, with a growth rate
of approximately 0.187 per annum. The improved
areas span 5711.81 square kilometers, accounting for
98.68% of the total forest and grassland area,
significantly exceeding the degraded areas.
The future prospects for vegetation cover in forest
and grassland areas of Sanmenxia City are promising.
Areas with a benign development trend account for
71.401% of the total area, while those showing a
malignant trend account for 28.522%, mainly
distributed in the central and northern parts of the city
along the Yellow River. The shift from improvement
to degradation trends in these areas should be highly
regarded in the process of ecological protection and
management.
ACKNOWLEDGMENTS
Correspondence should be addressed Yang Yaohong;
ecorestoration2023@163.com.
REFERENCES
Ju, X. 2022. Advances in remote sensing monitoring of key
elements of cultivated land ecological environment.
Natural Resources Informatization, (03): 59-65.
DOI:10.3969/j.issn.1674-3695.2022.03.010.
Yu, Y. 2022. Applications of 3 D laser scanning technology
in the extraction of vegetation parameters. Journal of
Henan Polytechnic University (Natural Science),
41(04): 51-57. DOI:10.16186/j.cnki.1673-
9787.2020090105.
Zhang, Z. Q. 2022. The evolution pattern and influence of
human activities of landslide driving factors in Wulong
section of the Three Gorges Reservoir area. The
Chinese Journal of Geological Hazard and Control,
33(03): 39-50. DOI:10.16031/j.cnki.issn.1003
-8035.2022.03-05.
Yin, Y. 2022. A Quantitative Study on Cultivated Land
Compensation Based on Ecological Value
Accounting—Taking Shenyang City As an Example.
Natural Resource Economics of China, 35(11): 18-24.
DOI:10.19676/j.cnki.1672-6995.000750.
Li, B. 2022. The Coordination and temporal-spacial
evolution pattern between population urbanization and
land urbanization——A case study on 18 cities in
Sichuan. Natural Resources Information, (09): 29-36.
Jin, S. Z. 2022. Prediction of Carbon Emission in
Chongqing Based on Support Vector Regression.
Journal of Chongqing University of Science and
Technology (Natural Sciences Edition), 24(01): 110-114.
DOI:10.19406/j.cnki.cqkjxyxbzkb.2022.01.018.
Shi, S. H. 2022. Heavy Metal Migration and Soil Pollution
Assessment in an Intensive Mining Area in the
Southwest China. Metal Mine, (02): 194-200.
DOI:10.19614/j.cnki.jsks.202202026.
Zhou, X. 2022. Analysis on spatio-temporal measure and
evolution characteristics of information entropy of land
use structure in the Yangtze River Delta urban
agglomeration . Natural Resources Informatization,
(01): 44-51. DOI: 10.3969/j.issn.1674-3695.2022.01.008.
Bao, J. J. 2022. Temporal and spatial evolution of
coordinated development between new urbanization
and intensive use of cultivated land in Gansu . Natural
Resources Information, (08): 42-50. DOI:10.3969/j.is
sn.1674-3709.2022.08.007.
Gao, M. M. 2022. Spatial and temporal variations in
vegetation index and its impact factors in the West
Liaohe Plain in Inner Mongolia. Hydrogeology &
Engineering Geology, 49(01): 175-182. DOI:10.16030
/j.cnki.issn.1000-3665.202104046.
Wang, N. 2021. Mine Environment Investigation and
Research Based on Remote Sensing Technology:A
Case Study of the Jidong Iron Mine. Metal Mine, (10):
192-198. DOI:10.19614/j.cnki.jsks.202110026.
Dang, Y. G. 2022. Discussion on the Top-level Design and
Optimization of the System of Cultivated Land
Requisition-Compensation Balance. Natural Resource
Economics of China, 35(06): 43-48,88. DOI:
10.19676/j.cnki.1672-6995.000669.
Guan, D. J. 2023. Study on the Spatial-temporal Coupling
Relationship between New Urbanization and Logistics
Industry: Based on the Panel Data of Anhui Province.
Journal of Cangzhou Normal University, 39(01): 51-55.
DOI:10.13834/j.cnki.czsfxyxb.2023.01.012.
Kang, S. Y. 2023. Analysis of land use change and driving
factors in Chengdu from 2010 to 2020. Natural
Resources Information, (03): 43-50. DOI:10.3969/j.is
sn.1674-3709.2023.03.006
Ye, S. S. 2023. Comprehensive Management of Ecological
Protection and Restoration Funds . Finance and
Research on Vegetation Cover Change in Sanmenxia City Based on NDVI from 1990 to 2020
15

Accounting for International Commerce, (20): 54-58.
DOI:10.3969/j.issn.1673-8594.2023.20.009.
Li, X. L. 2023. Theoretical analysis and engineering
practice of dynamic pre-reclamation in coal mining
subsidence area. Mining Safety & Environmental
Protection, 50(01): 86-91. DOI:10.19835/j.issn.1008-
4495.2023.01.015.
Zhang, Y. 2022. Selection of pioneer plants for repairing
limestone high and steep slopes in North China. The
Chinese Journal of Geological Hazard and Control,
33(05): 109-118. DOI:10.16031/j.cnki.issn.1003-8035.
202110012.
Xu, L. 2023. Carbon Storage Change in Xishuangbanna
Based on PLUS and InVEST Model. Ecology and
Environmental Monitoring of Three Gorges, 8(02): 75-
87. DOI:10.19478/j.cnki.2096-2347.2023.02.10.
Li, X. R. 2022. Study on the development situation and
countermeasures of non-grain utilization of cultivated
land in China . Natural Resources Information, (08):
29-35. DOI:10.3969/j.issn.1674-3709.2022.08.005.
Liao, Z. M. 2022. Habitat Quality Assessment Based on
InVEST Model in Dianchi Basin . Ecology and
Environmental Monitoring of Three Gorges, 7(02): 42-
52. DOI:10.19478/j.cnki.2096-2347.2022.02.05.
Ye, S. S. 2019. Ecological Environmental Cost Accounting
of Mining Area Based on the Green Mine: A Case from
a Mining Area in the North China Plain. Metal Mine, (04):
168-174. DOI:10.19614/j.cnki.jsks.201904031.
Hou, J. W. 2023. Discourse on scientific advancements in
mining ecological restoration. Mining Safety &
Environmental Protection, 50(06): 1-6,15. DOI:
10.19835/j.issn.1008-4495.2023.06.001.
Xie, Y. 2023. Analysis of land use change and influencing
factors based on GIS and RS:A case of Hefei. Natural
Resources Informatization, (04): 18-23. DOI:
10.3969/j.issn.1674-3695.2023.04.003
Ma, J. X. 2023. Spatio-temporal change characteristics of
water conservation function in the Zhang-Cheng
district based on the InVEST model. Hydrogeology &
Engineering Geology, 50(03): 54-64. DOI:
10.16030/j.cnki.issn.1000-3665.202208084.
ICESCE 2024 - The International Conference on Environmental Science and Civil Engineering
16
