
Prediction of Factors Influencing Diabetes Prevalence: Analysis Using
Machine Learning in Python
Qing Lei
Department of Mathematics, Tianjin University of Finance and Economics, Tianjin, 300000, China
Keywords: Machine Learning, Diabetes Prediction, Data Visualization, Confusion Matrix.
Abstract: Diabetes is a chronic disease caused by either the pancreas' inability to create insulin or the body's inability
to use it effectively. With machine learning, scientists can anticipate diabetes. This paper used the "Diabetes
Data" dataset from Kaggle for the study. Eight attributes made up the diabetes dataset, including the number
of pregnancies, glucose, blood pressure, skin thickness, insulin, BMI, diabetes spectrum coefficient, and age.
This project aims to apply machine learning to forecast the factors that influence diabetes prevalence. Through
data preprocessing and data feature analysis, a prediction model based on KNN, naive Bayes, SVM, decision
tree, random forest, lo-gistic regression and other six classification algorithms were constructed to achieve
diabetes risk prediction. The research on the influencing factors of diabetes will contribute to a better
comprehension of how it develops and will provide a scientific basis for establishing more effective treatment
and prevention strategies, as well as assist doctors in conducting early intervention and diagnosis to reduce
diabetes risk.
1 INTRODUCTION
Diabetes, a metabolic disorder that is distinguished by
insulin resistance and elevated blood sugar levels, is
among the most rapidly expanding chronic diseases.It
is anticipated that the global population of individuals
with diabetes will exceed 578 million in 2030 and 700
million in 2045. Currently, the global prevalence of
diabetes is 8.3%, with the greatest rate in the Middle
East and North Africa (12.2%) and the lowest in
Europe (6.3%) (Zhang et al., 2024).The frequency of
diabetes in China has risen from 9.7 percent in 2007
to 11.2 percent in 2018. Although the awareness,
treatment, and control rates have increased, they
remain at a low level(Gong et al., 2024).
Diabetes is a chronic metabolic disease whose
occurrence is linked to genetics, environmental
factors, and lifestyle. These variables cause
impairment or loss of function in islet cells, which
cannot effectively release enough insulin, leading in
a persistent increase in blood sugar levels (Roglic,
2016). Hyperglycemia can cause a variety of
consequences, including cardiovascular disease,
neuropathy, and renal damage. Furthermore, people
with diabetes may be complicated by chronic
conditions such as hypertension, hyperlipidemia, and
stroke, and long-term hyperglycemia can lead to
complications such as diabetic retinopathy, diabetic
neuropathy, and diabetic foot (Tomic et al., 2019).
Diabetes has a significant economic impact on
governments and healthcare systems around the
world, particularly on persons with diabetes and their
families, due to the massive number of people living
with it and the immense burden of its microvascular
and macrovascular consequences.
According to a recent US study, the average
unadjusted cost for diabetics is more than double that
of non-diabetics. Another US study found that
medical expenses for diabetes are two to eight times
greater than for other chronic conditions. Diabetes-
related expenditures are primarily driven by increased
hospitalization rates and comorbidities. Another
study estimated that hospital stays, prescription
medicines, and office visits were 2.6 times, 3.4 times,
and 1.9 times higher, respectively, for those with
diabetes than people without diabetes (Standl et al.,
2019).
Therefore, the research on the influencing factors
of diabetes can better help people understand the
pathogenesis of the disease and provide a scientific
basis for formulating more effective treatment and
prevention strategies (Khan et al., 2019).
574
Lei and Q.
Prediction of Factors Influencing Diabetes Prevalence: Analysis Using Machine Learning in Python.
DOI: 10.5220/0013528600004619
In Proceedings of the 2nd International Conference on Data Analysis and Machine Learning (DAML 2024), pages 574-578
ISBN: 978-989-758-754-2
Copyright © 2025 by Paper published under CC license (CC BY-NC-ND 4.0)
In addition, long-term studies demonstrate that
making lifestyle modifications can reduce the
likelihood of progressing from pre-diabetes to
diabetes by ten years. Pre-diabetes is seen as a critical
stage because research has indicated that the disease
is reversible and can be exploited as a potential
avenue to combat diabetes (Harding et al., 2019).
Since the change of lifestyle is the basis of blood
sugar control, active knowledge learning and
education on diabetes prevention and treatment,
changing attitudes, and advocating a healthy lifestyle
can prevent diabetes (Khan et al., 2019; Taylor et al.
2021).
Meanwhile, researchers have begun to use
machine learning algorithms like gradient-enhanced
trees to develop models that can predict when a
person will go from pre-diabetes to diabetes. This will
hopefully lead to earlier diagnoses, better treatments,
and a decreased chance of further complications.
(Sharma & Shah, 2021).
Machine learning is the discipline of giving
instructions to machines through algorithms without
human intervention. Machine learning is now widely
applicable in practically every field. Its application in
medical science has significant implications for
improving healthcare.
Healthcare is a major concern for any country, and
delivering healthcare is usually difficult. The better a
country's healthcare system, the better its citizens'
living conditions. Machine learning can assist
prevent, identifying, and cure several medical
diseases (Chou et al., 2023; Birjais et al., 2019).
In summary, thorough research into the
influencing variables of diabetes can help to better
understand the disease's pathology, provide more
effective treatment and preventative measures for
patients, and improve patients' quality of life and
outlook.
In this study, the factors affecting the prevalence
of diabetes were comprehensively analyzed by using
machine learning, and the results were obtained by
data cleaning, classification algorithm, decision tree,
logistic regression, and other methods.
2 METHODS
2.1 Data sources
The dataset used in this paper is from Kaggle. These
eight attributes made up the diabetes dataset,
including number of pregnancies, glucose, blood
pressure, skin thickness, insulin, BMI, diabetes
pedigree function, age, etc.
2.2 Data Cleaning
To improve the performance and effect of the
diabetes prediction model, it is required to pre-
process the original data, alter or eliminate any data
that is not suitable for the model or is erroneous, and
finally make the pre-processed data satisfy the
model's requirements. The data preparation approach
is as follows.
Outlier processing. Outliers are results that differ
greatly from the rest of the data set; they could be the
result of measurement or data entry errors, or they
could represent true but rare conditions.The purpose
of handling outliers is to ensure the accuracy and
reliability of the data analysis, to avoid the misleading
influence of outliers on the analysis results, and the
blood glucose concentration, blood pressure, BMI,
insulin, and glucose will not be 0 under normal
circumstances. Therefore, the abnormal values of
blood glucose concentration, blood pressure, and
BMI were deleted.
Missing value processing. Missing value
processing is an important part of data preprocessing,
which is very important to ensure the integrity,
accuracy, and reliability of data. In the process of
viewing the results, it was found that there was no
missing phenomenon in each dimension.
2.3 Data visualization
Data visualization is used to acquire a better
understanding of data by displaying the distribution
and relationships between data points using graphs.
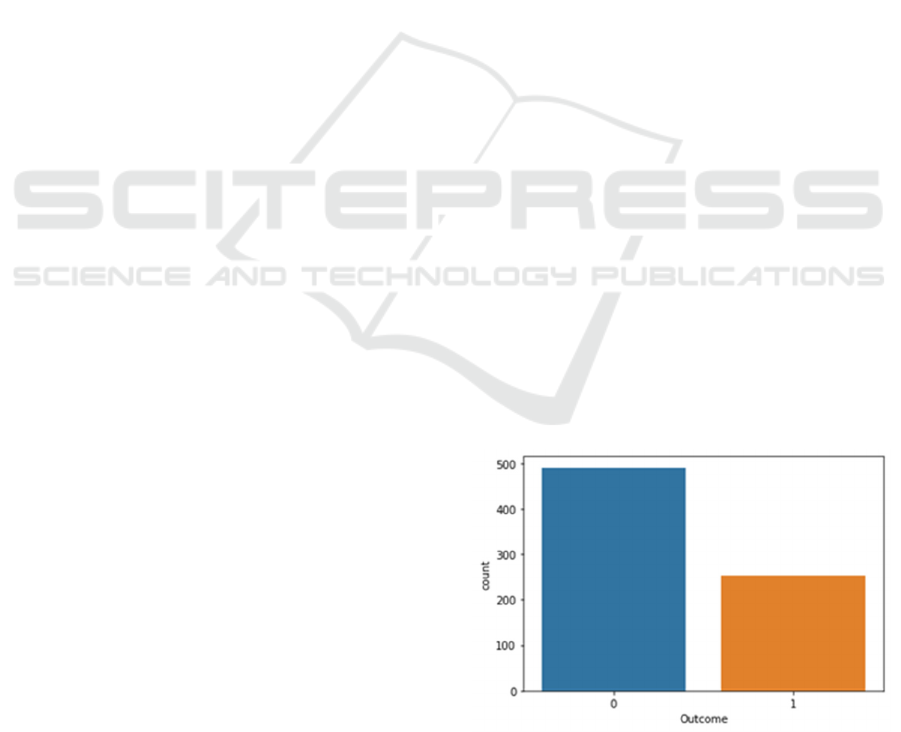
In this study, a statistical graph can be used to
determine whether the data is balanced, and a
histogram to determine whether the data has a normal
distribution (Figure 1).
Figure 1. Comparison of the number of people with or
without diabetes
Prediction of Factors Influencing Diabetes Prevalence: Analysis Using Machine Learning in Python
575
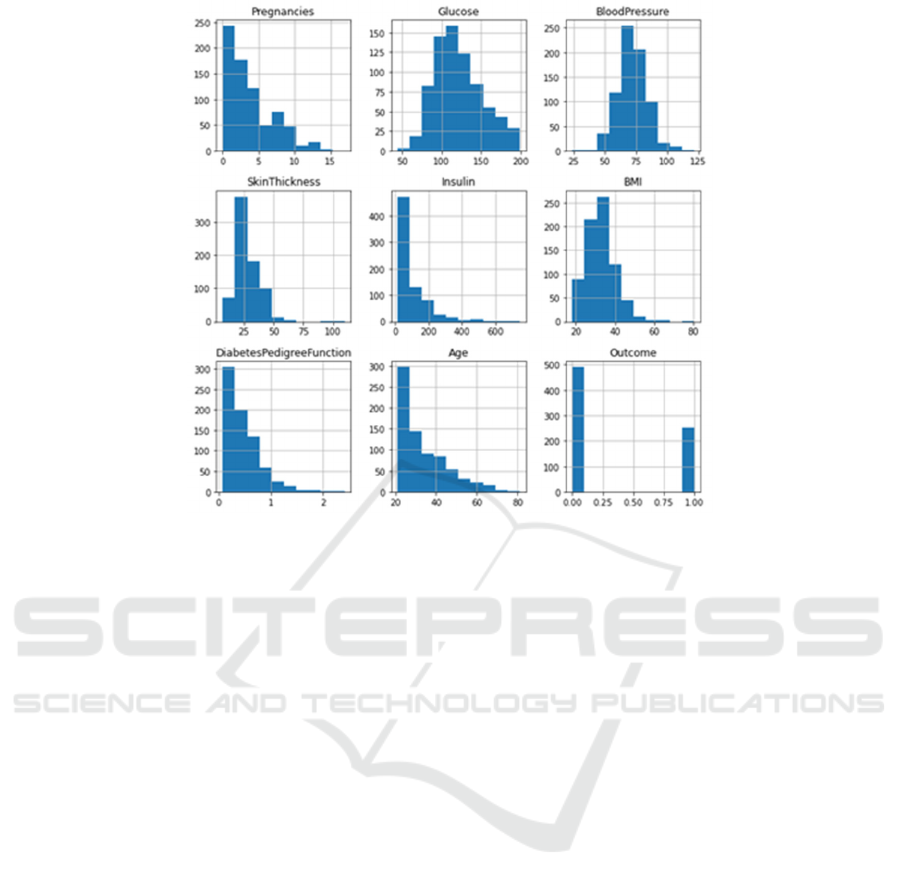
Figure 2. Distribution of variables
The graphic shows that there are far more non-
diabetic patients than diabetic ones, indicating that
the data is uneven (Figure 2).
The figure 2 shows that only blood sugar and
blood pressure are properly distributed, whereas the
others are skewed and contain outliers.
2.4 Model selection
In this study, the following machine learning was
used to train the data: KNN, Naive Bayes, SVM,
decision tree, and random forest. The K-Nearest
Neighbor (KNN) approach is a theoret-ically mature
method. This approach determines the category of
samples to be subdivided only based on the category
of one or more samples in the closest neighborliness.
The naive Bayes technique is a simplification of
the Bayesian algorithm. When the goal val-ue is
supplied, the attributes are considered to be
conditionally independent of one another, and each
predictor has an equal effect on the outcome.
SVM is often used for classification issues,
creating a hyperplane where the distance be-tween
two classes of data points is at its greatest. This
hyperplane is referred to as the decision boundary,
and it separates the classes of data points (for
example, has diabetes vs. does not have diabetes) on
each side of the plane.
Decision Tree is a decision analysis method that
uses the known probability of occurrence of various
situations to form a decision tree and determine the
probability that the expected value of net present
value is greater than or equal to zero, as well as to
evaluate project risk and fea-sibility. It is a graphical
approach of intuitively applying probability analysis.
Random forest is a classifier that combines
numerous decision trees and may be used for
classification, regression, and dimension reduction
tasks. It also tolerates outliers and noise well, and it
outperforms decision trees in terms of prediction and
classification.
3 RESULTS AND DISCUSSION
3.1 Data processing
Feature selection analysis helps to explore the
correlation and interaction between features. This
study looks at a selected set of features to infer the
degree of correlation and mutual influence between
features to better understand the structure and pattern
of the data. The analysis of the features selected by
the features can provide important information about
the features, help to optimize the model, improve the
feature
engineering, improve the accuracy and
DAML 2024 - International Conference on Data Analysis and Machine Learning
576
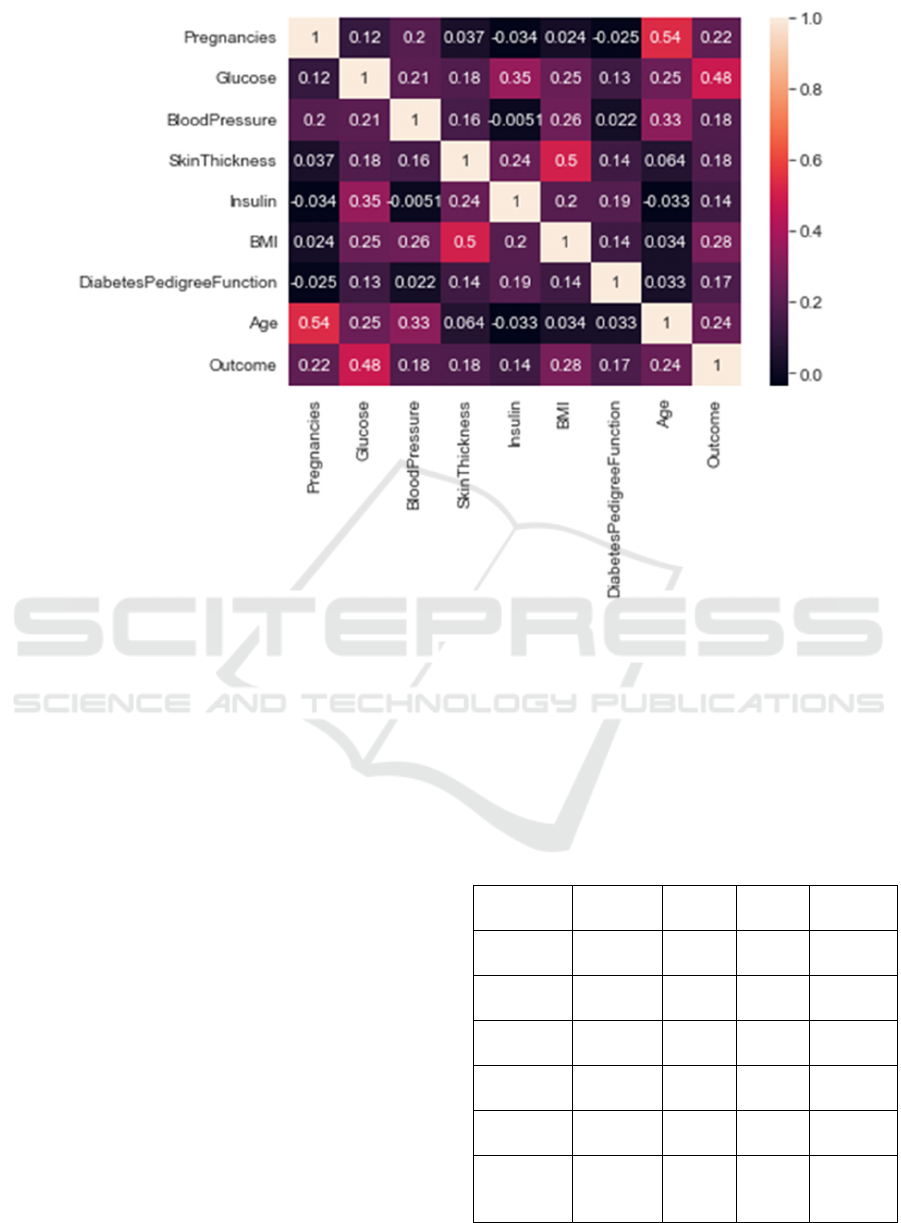
Figure 3. Heat map between variables
interpretability of the model, and simplify the
complexity of the model.
The Pearson correlation coefficient may assist
individuals in understanding the link between two
quantities. It measures the strength of the relationship
between two variables. The Pearson correlation
coefficient may range between -1 and +1. 1 indicates
great correlation, whereas 0 indicates no correlation.
In statistics, the Pearson correlation coefficient is
used to calculate the correlation (linear correlation)
between two variables X and Y, with a value ranging
from -1 to 1.1 indicating great correlation, whereas 0
indicates no correlation. A Heatmap is a visualization
method used to show patterns, trends, and
correlations in regular matrix data.
In the figure 3 above, the final line "outcome" and
its correlation scores for various parameters show that
glucose, BMI, and age are most connected with
outcome, whereas insulin and diabetes spectrum are
least correlated with function. That suggests they
don't add much to the model and may be disregarded.
3.2 Model Evaluation
To assess the impact of the model, six models were
trained in this study: KNN, Naive Bayes, SVM,
decision tree, random forest, and logistic regression.
This paper used 80% of the data as the training set and
20% as the test set (Table 1).
Table 1. The result of machine learning
p
recisio
n
recall
F1-
score
accurac
y
KNN 0.7273 0.5
0.592
6
0.78
N
aive
Ba
y
es
0.7576
0.520
8
0.617
3
0.79
SVM 0.7273 0.5
0.592
6
0.91
decision
tree
0.7368
0.583
3
0.651
2
0.8
random
fores
t
0.7273 0.5
0.592
6
0.78
Logistic
regressio
n
0.7419
0.479
2
0.582
3
0.78
Prediction of Factors Influencing Diabetes Prevalence: Analysis Using Machine Learning in Python
577

Precision: The proportion of predicted positive
samples that are actually positive. Recall: The
proportion of the positive category that is actually
correctly predicted to be positive. F1-score: The
harmonic average of accuracy and recall, suitable for
scenarios where both accuracy and recall need to be
considered. Accuracy: The proportion of correctly
classified samples to the total sample size, applicable
to data sets with balanced categories, but not
applicable to cases with unbalanced categories.
3.3 Discussion
As can be seen from the above table, the analysis and
comparison of prediction results on the test set show
that in terms of model accuracy, the Bayes decision
model is higher than the other five models, and the
recall rate and F1-score of the decision tree model are
better than the other five models. In terms of model
accuracy, SVM is higher than the other five models.
4 CONCLUSIONS
Diabetes is one of today's most serious chronic
illnesses, and early detection may significantly
enhance a patient's chances of managing it.This paper
constructs a prediction model based on various
machine learning algorithms, which can be applied to
predicting diabetes risk based on user input
characteristic data. This model takes the diabetes data
set as the research object, and 2000 effective data sets
are obtained through data preprocessing technology.
Through data feature analysis, it is concluded that
diabetes prevalence has the greatest correlation with
glucose, while insulin and diabetes spectrum function
has the least correlation. Through data preprocessing
and data feature analysis, a prediction model based on
KNN, naive Bayes, SVM, decision tree, random
forest, logistic regression, and other six classification
algorithms was constructed to achieve diabetes risk
prediction.Finally, the test set was utilized to assess
the predictive model's performance. Through the
analysis of the model accuracy rate, recall rate, F1-
score, accuracy rate, and other indicators, it was
found that the model constructed using the SVM
algorithm achieved the highest accuracy of prediction
results, and the recall rate and F1-score of the
decision tree model were superior to the other five
models. The Bayesian decision model is higher than
the other five models. In future studies, a similar
approach could be applied to other disease datasets,
such as cardiovascular disease.
REFERENCES
Birjais, R. et al. 2019. Prediction and diagnosis of
future diabetes risk: a machine learning approach.
SN Applied Sciences 1:1-8.
Chou, C.Y. et al. 2023. Predicting the onset of
diabetes with machine learn-ing methods. Journal
of Personalized Medicine 13(3):406.
Gong, T., et al. 2024. Analysis of diabetes prevalence
rate, awareness rate, treatment rate and control rate
in Fangshan District. Preven-tive medicine 7:616-
621.
Harding, J.L. et al. 2019. Global trends in diabetes
complications: a review of current evidence. Dia-
betologia 62:3-16.
Khan, R.M.M. et al. 2019. From pre-diabetes to
diabetes: diagnosis, treatments and translational
research. Medicina 55(9):546.
Roglic, G. 2016. WHO Global report on diabetes: A
summary. International Journal of Noncommuni-
cable Diseases 1(1): 3-8.
Sharma, T. & Shah, M. 2021. A comprehensive
review of machine learning techniques on diabe-
tes detection. Visual Computing for
Industry,Biomedicine, and Art 4(1): 30.
Standl, E. et al. 2019. The global epidemics of
diabetes in the 21st century: Current situation and
per-spectives. European journal of preventive
cardiology 26:7-14.
Taylor, R. et al. 2021. Nutritional basis of type 2 di-
abetes remission. BMJ 374.
Tomic, D. et al. 2022. The burden and risks of
emerging complications of diabetes mellitus.
Nature Reviews Endocrinology 18(9): 525-539.
Zhang, Z., et al. 2024. Study on the incidence and
influencing factors of diabetes mellitus in
communities in central urban areas of Beijing.
Chinese Medical Review 18: 34-37.
DAML 2024 - International Conference on Data Analysis and Machine Learning
578
