
Advanced Prediction of Diabetes Onset Using Machine Learning
Techniques
Shushen Wang
a
School of Humanities and Social Sciences, Beijing Institute of Technology, Beijing, China
Keywords: Diabetes Prediction, K-Nearest Neighbors (KNN), Support Vector Machines (SVM), Random Forests (RF).
Abstract: The purpose of this research is to forecast when diabetes will manifest by using machine learning (ML)
techniques, potentially reducing the prevalence of the condition. The paper explores various ML techniques
for diabetes prediction, including K-nearest neighbors (KNN), support vector machines (SVM), and random
forests (RF). KNN, a nonparametric supervised learning approach, classifies data based on proximity to recent
samples. It is categorized as a lazy learning method due to its instance-based nature and immediate processing
of new samples. The performance of KNN is heavily influenced by the choice of distance measure. SVM is
a widely used supervised learning model that excels in regression and classification by finding the optimal
hyperplane to maximize the margin between data classes, thereby enabling effective data classification. RF
constructs multiple decision trees and aggregates their predictions to enhance classification and regression
tasks. Its primary goal is to reduce overfitting while improving model stability and accuracy through tree
integration. The study employs datasets to evaluate these ML techniques. The results demonstrate that ML
can improve data processing efficiency and predict diabetes onset to a certain extent. Nevertheless, more
investigation is required to completely realize the potential of ML in this domain. This paper serves as a
valuable resource for researchers in the field.
1 INTRODUCTION
Diabetes is one of the most widespread illnesses in the
entire globe currently. Based on statistics from the
International Diabetes Federation, 451 million people
worldwide suffered hyperglycaemia in 2017.A 242
million rises in diabetics is predicted by 2043 (Cho et
al., 2018). Diabetes is thought to be a chronic illness
linked to anomalous bodily circumstances. Diabetes
comes in two common forms: type 1 and type 2.
Insulin-dependent diabetes (IDDM), often known as
type 1 diabetes, is brought on by the body's
insufficient production of insulin. Non-insulin-
dependent diabetes is another term for type 2 diabetes
(NIDDM). This kind of diabetes arises from improper
insulin utilization by the body's cells (Sanz et al., 2014;
Varma et al., 2014). By developing tools and methods
to help anticipate diabetes, people can diagnose the
condition earlier and lower their chance of developing
major health issues.
Medical professionals use machine learning (ML)
algorithms to forecast illness (Deo, 2015). Yuvaraj
a
https://orcid.org/0009-0003-1234-7263
and Sripresetta proposed an application utilizing three
distinct diabetes prediction algorithms—random
forests (RF), decision trees, and naive Bayes.
Following preprocessing, the PimaIndia Diabetes
Data Set was employed. The information gain
approach is discussed by the authors to extract
relevant features from the feature selection process;
however, they do not address the preprocessing of the
data. The RF method has a maximum accuracy of 94%
(Yuvaraj and SriPreethaa, 2019). A novel Support
Vector Machine (SVM) and naive Bayesian model for
diabetes prediction was presented by Tafa et al.
Utilizing data sets gathered from three distinct Kosovo
locations, the model was assessed. The prediction
accuracy has increased to 97.6% with the help of the
suggested combined algorithm. This result was
contrasted with the 95.52% and 94.52%, respectively,
performance of SVM and Naive Bayes (Tafa et al.,
2015). Numerous researchers have used ML
algorithms, data mining techniques, or combinations
of these techniques to create and implement a range of
predictive models. Using Hadoop and map reduction
Wang and S.
Advanced Prediction of Diabetes Onset Using Machine Learning Techniques.
DOI: 10.5220/0013516100004619
In Proceedings of the 2nd International Conference on Data Analysis and Machine Learning (DAML 2024), pages 301-305
ISBN: 978-989-758-754-2
Copyright © 2025 by Paper published under CC license (CC BY-NC-ND 4.0)
301
approaches, Drs. Saravana created a system to
examine diabetes-related information. Both the kind
of diabetes and the hazards related to it can be
predicted by the system. The technology is based on
the Hadoop platform and is inexpensive for any
healthcare organization (Eswari et al., 2015). Mani
Butwall proposed a model for anticipating mellitus
through a classifier based on RF behavior. AC4.5
decision tree technique was used to build the classifier
(Patil et al., 2010).
The primary intention of this investigation is to
utilize ML to predict diabetes. The initial section gives
a detailed summary regarding diabetes, summarizing
key concepts and background information. The
second section introduces the core technologies
behind ML algorithms, discussing the principles,
learning algorithms, and data mining techniques
relevant to diabetes prediction. The third section
focuses on evaluating the performance of these key
ML technologies, presenting and analyzing their
effectiveness in forecasting diabetes. In the fourth
section, both the advantages and limitations of these
technologies are discussed, along with their potential
for future development. Finally, the fifth section offers
a summary and outlook on the overall findings and
future research directions.
2 METHODOLOGY
2.1 Dataset Description
Electrocardiogram (ECG), respiratory, University of
California, Irvine (UCI), and Pima datasets are the
primary datasets utilized in the paper. Private datasets
gathered from three separate sites in Kosovo are also
used extensively (Larabi-Marie-Sainte et al., 2019).
The patient samples in each of these datasets varied
in number. Still, they shared nearly all of the same
characteristics, including aging, sport participation,
healthy diet, blood sugar concentration, blood
pressure, age-related family history of diabetes and
depth of the triceps skin folds are all factors to
consider. Furthermore, several feature selection
techniques can identify these traits when there are a
lot of features. The authors of employed Pima
datasets with 13, 8, and 49 attributes, in that order.
These figures are lowered to 8, 4, and 9 features,
respectively, when the feature selection method is
used. Thesis observe that has a lesser accuracy of
0.757, which might be because there are not as many
features considered in the prediction. It indicates that
these characteristics significantly influence the
possibility of developing diabetes.
2.2 Proposed Approach
The intention for this investigation is to use ML
algorithms for estimating diabetes in individuals,
potentially reducing the incidence of the disease. The
first section provides an introduction to diabetes,
outlining its categories, including type 1 and type 2
diabetes. The second section introduces the main ML
technologies used in diabetes prediction, including
RF, SVM, and K-nearest neighbors (KNN). The
discussion covers the principles behind these
algorithms and their application in predicting
diabetes. With the rising prevalence of diabetes, these
ML techniques offer valuable tools for early
detection.
The third section evaluates the effectiveness of
these key technologies, analyzing their performance
in diabetes prediction. The fourth section explores the
advantages and disadvantages of these technologies,
as well as their future development prospects. KNN,
for instance, is a well-established method applicable
to both regression and classification tasks. RF benefit
from substantial parallelization, enhancing training
speed for large datasets, though they may overfit
noisy data and face computational challenges with
numerous features. SVM, while providing excellent
generalization and classification accuracy, may
struggle when feature dimensions greatly exceed the
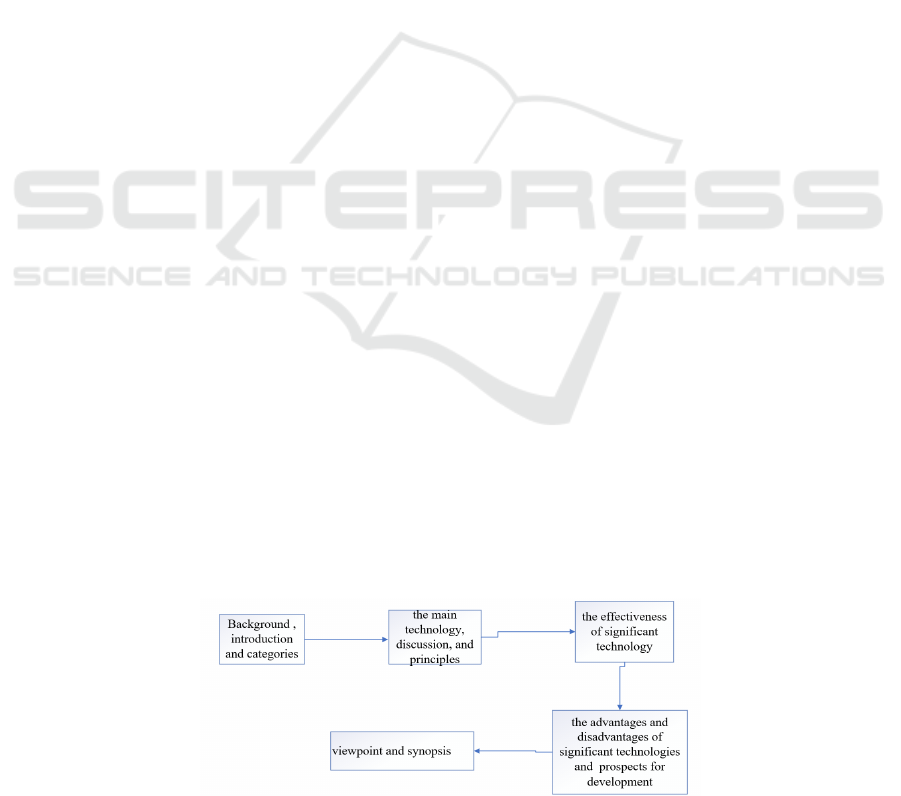
number of samples. The fifth section summarizes the
study’s findings and provides an outlook on future
research.Figure 1 displays the flow chart that details
the steps involved in the investigation.
Figure 1: The pipeline of the review (Picture credit: Original).
DAML 2024 - International Conference on Data Analysis and Machine Learning
302

2.2.1 Machine Learning (ML)
A computer technique called ML uses past data to
automatically learn from mistakes to enhance
performance and produce more accurate predictions.
ML is the development of algorithms and techniques
that enable computers to learn and become intelligent
based on past experience. It is a branch of artificial
intelligence (AI) with close connections to statistics.
As a result of learning, the system becomes capable
of identifying and comprehending the input data,
enabling it to be used as the basis for choices and
forecasts. In the current work. Find trends and
patterns in danger indicators by utilizing machine
learning approaches, the Pima India Diabetes dataset,
and R data processing tools. It can generate and
analyze five different predictive models to classify an
individual as either diabetic or non-diabetic using the
R data processing tool.ML algorithms are employed,
specifically multifactor dimensionality reduction
(MDR), KNN, radial basis function (RBF), kernel
support vector machines, linear kernel SVM, and
artificial neural networks (ANN), to do this. High-
dimensional biomedical data is now automatically
analyzed using ML methods. Among the biological
uses of ML are liver disease diagnosis, skin lesion
classification, cardiovascular disease risk assessment,
and genetic and genomic data analysis. Hashemi et al.
have successfully deployed the SVM algorithm for
the diagnosis of liver illness (Mumtaz et al., 2018).
Mumtaz et al. employed classification models such as
SVM, logistic regression (LR), and Naive Bayes
(NB) to determine the presence of major depressive
disorder (MDD) using an EEG dataset.
2.2.2 KNN
KNN classifies use the characteristic space's closest
training scenarios as a basis. The most fundamental
kind of lazy learning based on instance learning is
KNN. All occurrences are taken to be points in n-
dimensional space. Finding an instance's "proximity"
requires the use of a distance metric. To classify
cases, KNN locates the closest neighbors and chooses
the most well-liked class among them. The feature of
KNN is as followed (Li et al., 2019). All data
instances are points in n-dimensional Euclidean
space. Categorization is postponed until additional
instances are received. For complex goal functions
and noisy training data, KNN is an effective inductive
inference technique. One way to think of the objective
function of the entire space is as a mixture of simpler
local approximations. The algorithm of KNN is as
follows (Li et al., 2019). Consider a sample dataset
with n columns and m rows, where the input vector is
represented by the
𝑛
-1
column and the output
vector by the
𝑛
column. Call the test dataset P. It
has y rows and n-1 properties. To determine the
Euclidean distance between each S and T, as:
𝑑𝑖𝑠𝑡𝑎𝑛𝑐𝑒 =
∑∑∑(
𝑅(𝑗,𝑙)−𝑃(𝑖−𝑙)
)
(1)
Next, ascertain that KK has a random value of no.
the closest neighbor. Next, determine the
𝑛
column for each using these minimum distances and
Euclidean distances. Find the same output value. The
patient has diabetes if the number stays the same.
2.2.3 SVM
In medical diagnosis, it refers to a group of linked
supervised learning techniques for regression and
classification. Known as the maximum margin
classifier, SVM enhances the shape of the margin
while concurrently minimizing the actual
classification error. Statistical learning theory serves
as the foundation for SVM, a broad risk border
assurance technique. SVM may effectively use the
so-called kernel technique to carry out nonlinear
classification. Their inputs are implicitly mapped into
a higher-dimensional feature space by it. The
classifier may be built without knowledge of the
feature space thanks to the kernel trick. The ML
research community has recently shown a significant
lot of interest in SVM. In terms of precision in
classification, SVM typically outperforms other data
categorization techniques, according to certain recent
studies. SVM is a helpful technique for situations
involving binary categorization, hence it can be
applied to anticipate diabetes. SVM are applied to
regression as well as classification. Data points are
spatially represented and grouped in the SVM model;
points that share comparable characteristics are
included in the same group. A given data set in a
linear SVM is seen as a p-dimensional vector that is
separable by the hyperplane, or maximum value of
the p-1 plane. These planes define boundaries
between data groups or divide data Spaces for
classification or regression issues. The optimal
hyperplane can be selected from the available
hyperplanes based on the distance between the two
classes that the hyperplane divides. The maximum
boundary hyperplane is the plane that has the biggest
boundary between these two classes.
Advanced Prediction of Diabetes Onset Using Machine Learning Techniques
303
2.2.4 RF
RF algorithm is an extremely effective generic
classification and regression technique. The strategy,
which combines numerous random decision trees and
averages its forecasts, works incredibly well even if
there are a lot more variables than observations. This
algorithm, which is based on statistical learning
theory, extracts multiple versions of the sample set
from the original training data set using the guided
random resampling method. It then creates a decision
tree model for each sample set and combines the
decision tree's output to predict the classification
results. The integrated classifier RF, which consists
of several decision trees, offers the benefits of
excellent robustness and high precision. Therefore,
the fundamental classifier in the work is RF. In order
to predict if a person will develop type 2 diabetes,
constructing a risk model is necessary to predict
diabetes. The primary processes in building a RF
include creating a training set, choosing a split point,
building classification and regression trees
repeatedly, and voting. Three other algorithms are
employed, the Iterative Dichotomiser (ID) 3
algorithm, the naive Bayes algorithm, and the
AdaBoost algorithm to confirm the efficacy of this
approach. Additionally, to bolster the proof of the
efficacy of the techniques employed in this
investigation. Thesis created an alternative series of
comparative studies. To compare each model inside
each subset, the data set is first split into four subsets
(20%, 40%, 60%, and 80% of the entire data set,
respectively).
3 RESULT AND DISCUSSION
One benefit of ML is that it can increase processing
efficiency by automating the processing of massive
amounts of data (Jaiswal et al., 2021). ML approaches
able to handle tens of millions of data points without
issues like probability and missing data. Still, manual
processing of vast volumes of data is prone to errors
and missing some data points, resulting in inaccurate
analysis conclusions. The capacity of machine
learning technology to self-learn is another benefit. In
other words, ML algorithms always pick up new
information from data, refining and enhancing their
algorithms. For instance, if sample data is
continuously increased, the model used for ML may
continuously learn and adapt to improve the precision
of its classification in the text classification problem
in natural language processing.
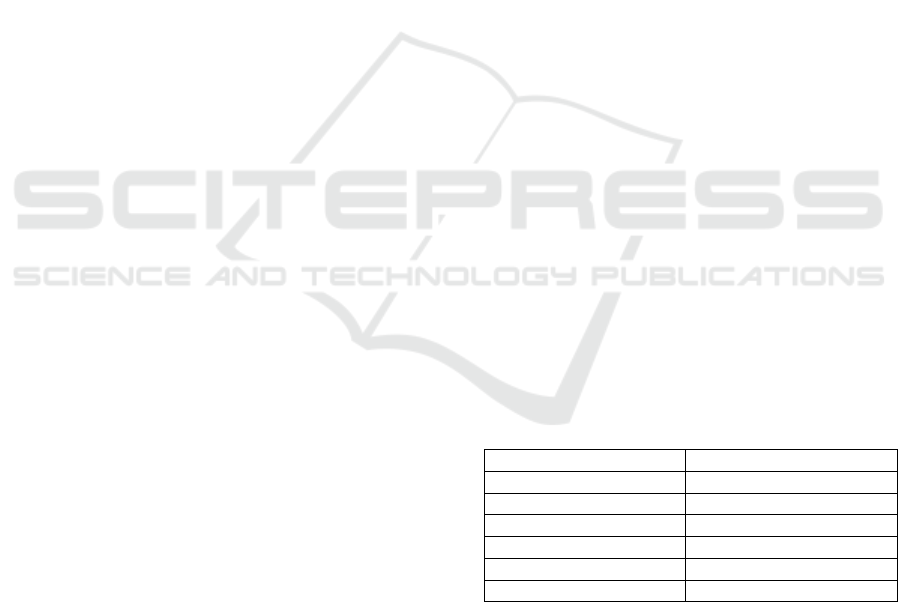
There are disadvantages to ML. The sample size
is too small, and its data dimension is high. Greater
dimensional datasets need larger training sample
sizes of data. Processing largXer data sets
significantly increases the computational needs and
time costs for machine learning models, as Table 1
illustrates.
However, the data dimensions are frequently
constrained. To train a model, ML techniques need
reliable data samples. Furthermore, A training dataset
with a small sample size will have an impact on the
model's accuracy and capacity for generalization.
Diabetes prediction accuracy can be increased with
the use of ML. The ability of ML algorithms to
evaluate large amounts of data and spot patterns and
trends that are hard for humans to notice increases the
accuracy of diabetes forecasts.
Early danger identification is made possible by
ML. It is accomplished by examining the patient's
physiological signs and fundamental data. To take
preventive action ahead of time, ML can help detect
those who are susceptible to diabetes at an early age.
Nevertheless, the amount and quality of data are
crucial for ML models to function well; if either is
biased or lacking, the predictions may not come to
pass. Not only can ML be applied to healthcare to
help clinicians improve diagnosis accuracy and
treatment outcomes, but it can also be used to
properly forecast diabetes, imaging diagnosis,
genomics research, and personalized medicine. In the
future, it could be developed into financial
applications. ML is a popular tool used in credit
scoring, stock forecasting, risk management, and
other areas where it can assist financial institutions in
managing risks and making choices.
Table 1: The table of data volume and processing time in
ML.
Data volume (GB) Processing time (Hours)
12
10 5
100 20
1000 100
10000 500
100000 2000
4 CONCLUSIONS
The primary aim of this research is to reduce the
incidence of diabetes by developing a model for
accurate early prediction using ML techniques. KNN
classify objects based on their proximity to recent
training examples in feature space, treating each
DAML 2024 - International Conference on Data Analysis and Machine Learning
304

instance as a point in an n-dimensional space. SVM
employ associative supervised learning methods for
regression and classification, with SVM known for its
ability to find the greatest margin classifier. RF
aggregate predictions from multiple decision trees to
provide robust classification and regression tools.
Comprehensive testing was conducted to evaluate the
proposed approach. Results demonstrate that ML
enhances processing efficiency by automating the
analysis of large data volumes. However, limitations
persist, including constraints on ML automation and
high processing resource demands, which hinder the
full potential of these methods. Subsequent
investigations will concentrate on resolving these
constraints and refining machine learning methods to
enhance efficiency and productivity.
REFERENCES
Cho, N.H., Shaw, J.E., Karuranga, S., et al. 2018. IDF
Diabetes Atlas: Global estimates of diabetes prevalence
for 2017 and projections for 2045. Diabetes research
and clinical practice, 138: 271-281.
Deo, R.C., 2015. Machine learning in medicine.
Circulation, 132(20), 1920-1930.
Eswari, T., Sampath, P., Lavanya, S., 2015. Predictive
methodology for diabetic data analysis in big data.
Procedia Computer Science, 50, 203-208.
Jaiswal, V., Negi, A., Pal, T., 2021. A review on current
advances in machine learning based diabetes
prediction. Primary Care Diabetes, 15(3), 435-443.
Larabi-Marie-Sainte, S., Aburahmah, L., Almohaini, R., et
al. 2019. Current techniques for diabetes prediction:
review and case study. Applied Sciences, 9(21), 4604.
Li, J., Zhang, B., Lu, G., et al. 2019. Body surface feature-
based multi-modal learning for diabetes mellitus
detection. Information Sciences, 472, 1-14.
Mumtaz, W., Ali, S.S.A., Yasin, M.A.M., et al. 2018. A
machine learning framework involving EEG-based
functional connectivity to diagnose major depressive
disorder (MDD). Medical & biological engineering &
computing, 56, 233-246.
Patil, B.M., Joshi, R.C., Toshniwal, D., 2010. Association
rule for classification of type-2 diabetic patients.
Second international conference on machine learning
and computing, 2010, 330-334.
Sanz, J.A., Galar, M., Jurio, A., et al. 2014. Medical
diagnosis of cardiovascular diseases using an interval-
valued fuzzy rule-based classification system. Applied
Soft Computing, 20, 103-111.
Tafa, Z., Pervetica, N., Karahoda, B., 2015. An intelligent
system for diabetes prediction. Mediterranean
Conference on Embedded Computing, 2015, 378-382.
Varma, K.V., Rao, A.A., Lakshmi, T.S.M., et al. 2014. A
computational intelligence approach for a better
diagnosis of diabetic patients. Computers & Electrical
Engineering, 40(5), 1758-1765.
Yuvaraj, N., SriPreethaa, K.R., 2019. Diabetes prediction
in healthcare systems using machine learning
algorithms on Hadoop cluster. Cluster Computing,
22(1), 1-9.
Advanced Prediction of Diabetes Onset Using Machine Learning Techniques
305
