
Pest YOLO: An Effective Insect Target Detection Algorithm for
Small Targets
Xuchuan Qin
a
College of Information, Yunnan University, Yunnan, China
Keywords: BiFormer Attention Mechanism, You Only Look Once Version 5, Complex Scene Detection.
Abstract: This paper proposes three distinct strategies to enhance the performance of the You Only Look Once version
5 (YOLOv5) model in object detection tasks. The enhancements encompass the integration of a BiFormer
attention mechanism, the addition of an Adaptive Feature Pyramid Network (AFPN), and the replacement of
the Spatial Pyramid Pooling Module (SPPF) with the Multi-Task Spatial Pyramid Pooling (MTSPPF). The
BiFormer attention mechanism aims to enhance the model's focus on target regions, leading to improved
detection accuracy by capturing long-range dependencies and enhancing the understanding of spatial
relationships within images. Integrating AFPN into the YOLOv5 model optimizes the feature pyramid
network, enabling adaptive adjustments of feature representations across various scales, which improves the
detection of objects with different sizes and complexities. Additionally, the replacement of SPPF with
MTSPPF facilitates more effective aggregation of spatial information from multiple scales, thereby enhancing
performance while reducing both parameter count and computational complexity. Experimental evaluations
on standard datasets indicate significant improvements in object detection performance for all three
approaches. Collectively, these enhancements tackle challenges related to complex scenes and varying object
scales, providing a comprehensive solution for improving the YOLOv5 model's effectiveness in object
detection tasks.
1 INTRODUCTION
As people's quality of life continues to improve,
agriculture remains a vital component of human
livelihood. However, the agricultural sector
encounters challenges like pest and disease outbreaks,
which can severely affect crop yields and quality
(Donatelli, Magarey, Bregaglio, et al., 2017). This
situation creates an increasing demand for efficient
and accurate methods for detecting pests and diseases
in crops. Timely detection is essential for ensuring
food security and promoting sustainable agricultural
development.
The process of pest and disease detection in crops
involves various steps, including identification,
monitoring, and management. Traditionally, manual
inspection by agricultural experts has been the
primary method for pest and disease detection. Hothe
paperver, manual inspection is labor-intensive, time-
consuming, and may not always be accurate,
especially when dealing with large agricultural areas
a
https://orcid.org/0009-0008-9917-9878
(Wen, Chen, et al., 2022). Detection algorithms
utilizing machine vision have proven to be a
promising method for identifying pests and diseases
in agricultural settings (Khalid, Oqaibi, et al., 2023).
For example, Mukhopadhyay (Mukhopadhyay, Paul,
Pal, et al., 2023) proposed an image-based automatic
detection method for identifying crop diseases. Yang
(Yang, Yuan, et al., 2019) developed a computer
vision algorithm using infrared thermal imaging
technology to detect crop disease areas and estimate
disease severity. Karunasena (Karunasena,
Priyankara, 2022) introduced a novel approach for
pest detection in crops, utilizing a cascade classifier
that effectively integrates a histogram of oriented
gradient features with support vector machine
techniques. This innovative method enhances the
accuracy of pest identification by leveraging the
strengths of both feature extraction and machine
learning classification, thereby providing a more
reliable solution for agricultural pest management.
Additionally, an improved feature extraction method
Qin and X.
Pest YOLO: An Effective Insect Target Detection Algorithm for Small Targets.
DOI: 10.5220/0013515700004619
In Proceedings of the 2nd International Conference on Data Analysis and Machine Learning (DAML 2024), pages 275-284
ISBN: 978-989-758-754-2
Copyright © 2025 by Paper published under CC license (CC BY-NC-ND 4.0)
275
based on the Shi-Tomasi algorithm was proposed by
Zhang (Zhang, Zou, et al., 2021) to enhance pest
detection in crops.
Recently, there has been a marked increase in the
application of deep learning-based object detection
algorithms within the agricultural sector. These
algorithms, such as You Only Look Once (YOLO)
and Faster R-CNN (Region-based Convolutional
Neural Network), have shown promising results in
detecting pests and diseases in crops (Tang, Lu, et al.,
2023). Lawal (Lawal, Zhao, et al., 2021) proposed an
improved YOLOv3 model for detecting pests and
diseases in crops, achieving superior performance
compared to other methods. Roy (Roy, Bose, et
al.,2022) Roy developed a high-performance
framework designed for real-time object detection,
specifically aimed at identifying diseases in crops.
This innovative approach enhances the efficiency of
disease detection processes, allowing for timely
interventions in agricultural practices, showcasing
impressive accuracy and efficiency, the paper
attempts to improve the YOLOv5 model using three
novel approaches in an effort to achieve better
detection performance.
2 RELATED WORKS
2.1 YOLOv5 Algorithm
The YOLOv5 algorithm represents an advancement
within the YOLO series of object detection models,
recognized for its remarkable speed and precision. By
building on the achievements of earlier versions,
YOLOv5 introduces several enhancements in areas
such as model architecture, training methodologies,
and inference efficiency (Liu, Xu, et al., 2021). These
improvements aim to optimize performance, making
YOLOv5 a more effective tool for real-time object
detection tasks.
The YOLOv5 algorithm adopts a one-stage object
detection approach, allowing for real-time processing
of images with high accuracy. Its architecture
comprises three key components—the backbone, neck,
and detection head— each essential for the model's
effectiveness in various detection tasks.
The backbone network acts as a feature extractor,
capturing semantic information from the input image.
YOLOv5 employs a variant of CSPDarknet53 as a
lightweight and efficient extractor. Positioned
between the backbone and detection head, the neck
network fuses feature across different scales to
improve detection accuracy. Finally, the detection
head of YOLOv5 outputs bounding box predictions
and class probabilities, making it highly suitable for
diverse applications, especially in agricultural object
detection (Wang, Zheng, et al., 2021).
Recently, researchers have explored several
modifications and extensions to the YOLOv5
algorithm to better address specific agricultural
challenges, particularly in pest and disease detection
in crops. These adaptations aim to enhance the
algorithm's effectiveness in these applications.
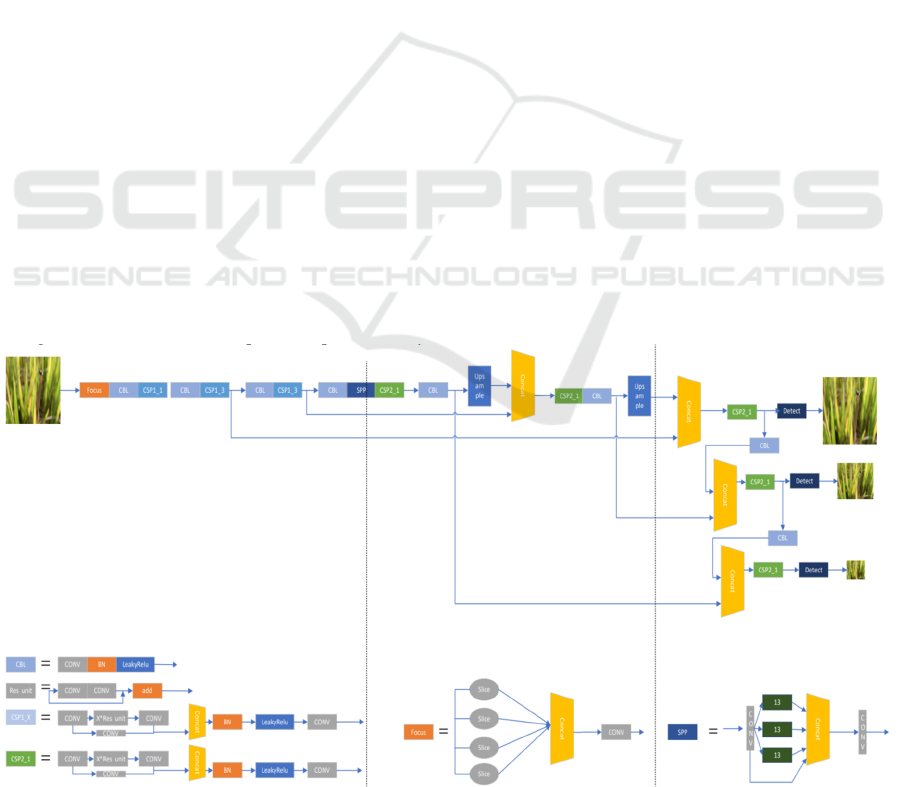
YOLOv5 retains the core components that define the
YOLO architecture series, with its network structure
illustrated in Figure 1.
Figure 1: YOLOv5 network structure diagram. (Photo/Picture credit: Original)
DAML 2024 - International Conference on Data Analysis and Machine Learning
276
2.2 Algorithm Optimization
2.2.1 Replacement of YOLOv5 C2f Layer
The standard architecture of the original YOLOv5
model may not sufficiently meet the specific needs
for accurately detecting small defects related to crop
diseases and pests. The small target recognition layer
is designed to improve the detection of minor defects
in crops caused by diseases or pests. By integrating
this layer into the YOLOv5 architecture, this paper
aims to enhance the model's sensitivity to subtle
features and overall performance in agricultural
inspection tasks. By doing so, the research aims to
enhance the model's ability to accurately detect and
analyze critical details in agricultural contexts. To
implement the proposed modification, the C3 layer in
the YOLOv5 backbone is replaced with the newly
introduced C2f layer, which is essential for improving
the model's capacity to detect small defects related to
crop diseases and pests.
In the YOLOv5 architecture, the third
convolutional layer, known as the C3 layer, is crucial
for feature extraction from the input image. Its design
significantly contributes to the model's ability to
identify and interpret important characteristics,
enhancing overall detection performance. It performs
convolution operations on the feature maps obtained
from earlier layers, capturing hierarchical
representations of the input image. The output of the
C3 layer serves as the input to subsequent layers,
facilitating object detection and localization tasks.
In the context of detecting small targets, such as
pests or diseases on crops, the traditional C3 layer
may not adequately capture spatial information
essential for accurate detection. To address this
limitation, the paper proposes replacing the C3 layer
with a novel C2f (Convolutional to Fusion) layer. The
C2f layer not only performs convolutional operations
similar to the C3 layer but also incorporates fusion
mechanisms to aggregate features from multiple
scales effectively.
The C2f layer effectively merges features from
the second layer of the backbone network (C2 layer)
with outputs from the preceding layer, allowing for a
richer representation of the input data. By replacing
the C3 layer with the C2f layer, this paper seeks to
significantly enhance the model's capacity to detect
small targets in agricultural images. This strategic
modification aims to enhance the model's
performance and reliability in agricultural inspection
tasks, ultimately leading to more accurate
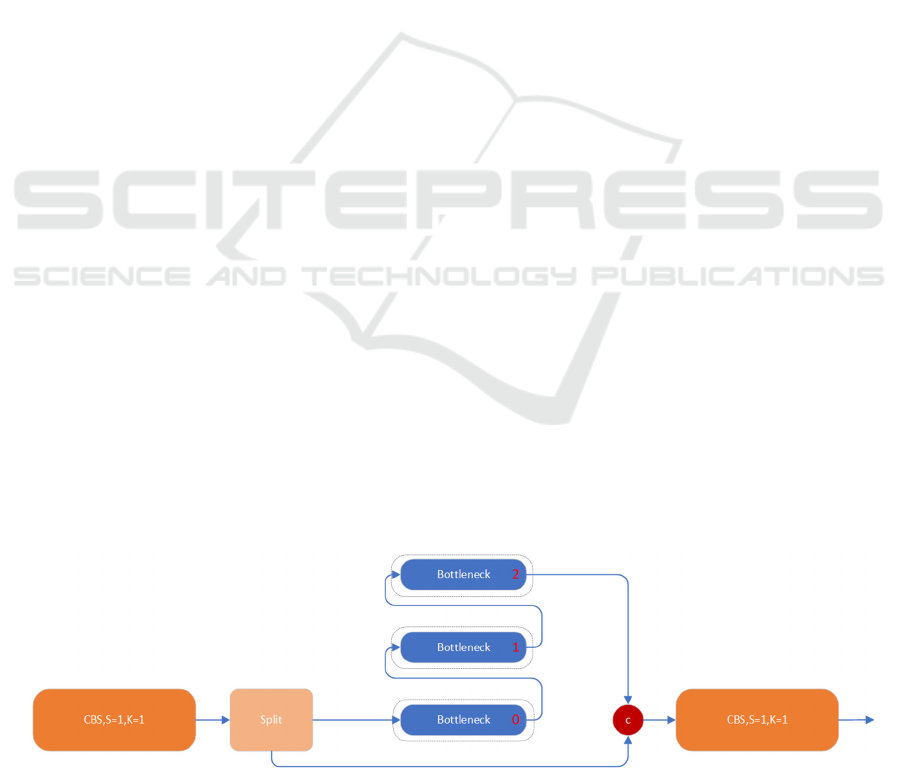
assessments of crop health. Figure 2 shows the
YOLOv5 C2f layer.
2.2.2 MTSPPF Replacement
The proposed method enhances feature fusion in the
backbone network by improving convolutional
operations, enabling the capture of detailed target
information while minimizing irrelevant data. This
paper suggests substituting the SPP layer with the
Multi-scale Spatial Pyramid Pooling Fusion
(MTSPPF) mechanism, as outlined by Dong (Dong,
Sun, et al., 2024). The purpose of this replacement is
to enhance the model's capability to effectively
process multi-scale features, which is expected to
result in improved overall performance. By
optimizing this aspect, the model can better adapt to
varying object sizes, ultimately leading to more
accurate detections.
This process facilitates the compression of the
feature space, allowing for the extraction of critical
information from each channel in a more efficient
manner. Following this, the Excitation operation
plays a crucial role by adjusting the significance of
the features from each channel based on their
relevance to the target of interest. This modulation
enables the model to focus on the most salient
features, effectively amplifying those that contribute
Figure 2: YOLOv5 C2f Layer (Photo/Picture credit: Original)
Pest YOLO: An Effective Insect Target Detection Algorithm for Small Targets
277
to accurate detection while suppressing irrelevant
information. As a result, the overall performance of
the model in detection tasks is significantly enhanced,
leading to improved accuracy and reliability in
identifying key elements within the data.
2.2.3 BiFormer
BiFormer is a visual Transformer model that
incorporates Bi-level Routing Attention (Zhu, Wang,
et al., 2023), centered around the concept of dual-
level routing attention mechanisms. In this model,
each image patch is assigned to a positional router
that directs it to either upper-level or lower-level
routers based on specific criteria. While the upper-
level routers are designed to capture global contextual
information, the lower-level routers concentrate on
detailed aspects within local regions. In the BiFormer
architecture, the upper-level routers utilize global
self-attention mechanisms to engage with all image
patches, effectively generating a comprehensive
global representation of the input. In contrast, the
lower-level routers implement local self-attention
mechanisms, allowing them to concentrate on
neighboring patches and create more localized
representations. This dual approach enhances the
model's ability to capture both broad context and fine
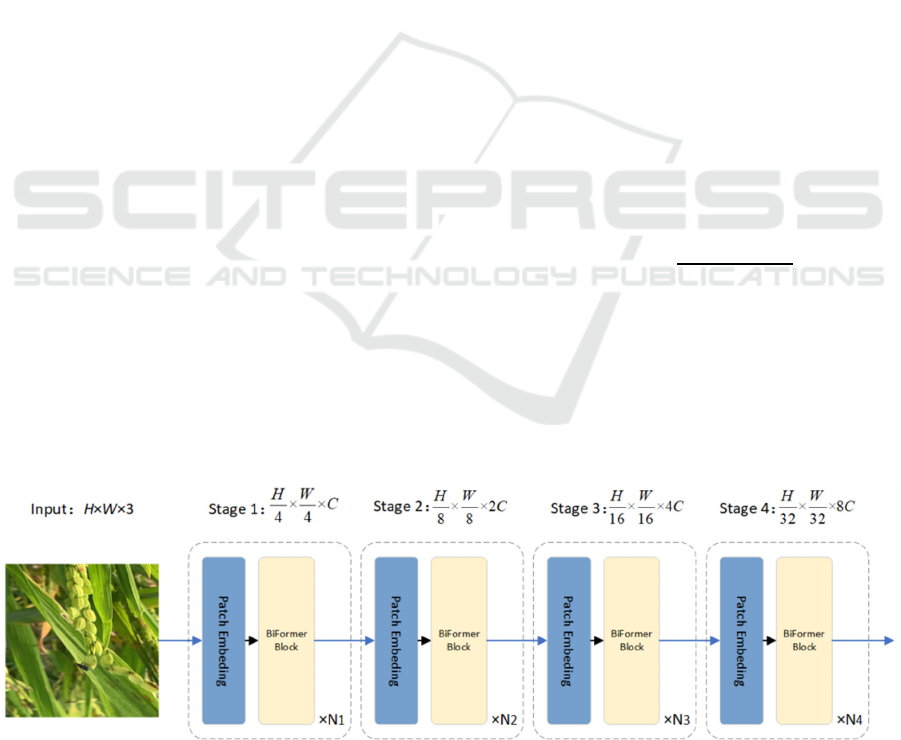
details. The structure of BiFormer is illustrated in the
Figure 3.
In the i-th stage, overlapping patch embedding is
utilized when i=1, whereas patch merging is
employed when i=2,3……to reduce input spatial
resolution while increasing channel count. Following
this, N_i-connected BiFormer blocks are utilized to
perform transformer operations on the input features.
By integrating the BiFormer structure into the
YOLOv5 architecture, the model's feature
representation capabilities are significantly enhanced.
This integration improves the model's ability to
capture intricate spatial relationships within the input
image, thereby allowing for more nuanced
understanding and detection of objects.
2.2.4 AFPN
The AFPN module is designed to address the
challenge of feature resolution discrepancy across
different levels of the feature pyramid. It achieves this
by incorporating attention mechanisms to adaptively
recalibrate feature maps at each pyramid level,
ensuring that features from different scales are
appropriately utilized for object detection.
Meanwhile, the attention fusion mechanism
selectively combines features from different pyramid
levels based on their importance, leveraging attention
mechanisms to assign higher the paperweights to
more informative features.
The integration of the AFPN module into the
YOLOv5 architecture is intended to strengthen the
model's resilience to scale variations and improve its
ability to detect objects of different sizes. AFPN
facilitates adaptive feature recalibration, allowing for
the effective use of multi-scale information, which
leads to more accurate and reliable object detection in
various scenarios. The Generalized IoU (GIoU) Loss
function for bounding box regression is defined as
follows:
𝐿
=1−𝐼𝑜𝑈+
|
𝐶−𝐵∪𝐵
|
|
𝐶
|
(1)
When the predicted box perfectly overlaps with
the ground-truth box and their dimensions are
identical, distinguishing the relative positions of these
two boxes becomes difficult. To tackle this challenge,
the Complete IoU (CIoU) Loss is utilized instead of
the Generalized IoU (GIoU) Loss. The CIoU Loss
enhances the GIoU Loss by considering not only the
Figure 3: The structure of BiFormer (Photo/Picture credit: Original)
DAML 2024 - International Conference on Data Analysis and Machine Learning
278
area of overlap but also the distance between the
centers of the predicted and ground-truth boxes.
Additionally, it accounts for the consistency of the
aspect ratios of the bounding boxes. The formulation
of the loss function can be defined as follows:
𝑅
=
𝜌
𝑏,𝑏
𝑐
+𝛼𝑣
(2)
𝜐=
4
𝜋
𝑎𝑟𝑐𝑡𝑎𝑛
𝑤
ℎ
−𝑎𝑟𝑐𝑡𝑎𝑛
𝑤
ℎ
(3)
𝐿
=1−𝐼𝑜𝑈+𝑅
(4)
The penalty term is established by minimizing the
normalized distance between the centers of the two
bounding boxes (BBoxes). In this context, 'd' signifies
the Euclidean distance between the predicted and
ground-truth box centers, while 'c' represents the
diagonal length of the smallest enclosing box that
encompasses both bounding boxes. Additionally,
'alpha' serves as a positive balancing parameter to
evaluate aspect ratio consistency, defined as follows:
𝛼=
𝑣
1−𝐼𝑜𝑈
+𝑣
(5)
2.3 Experimental Setup
2.3.1 Dataset Production and Preprocessing
From September 2021 to December 2021, a dataset of
pests and diseases was randomly collected at
Kunming Second Farm. Different types of pests and
diseases exhibit variations in shape and size. To
ensure effective training and enhance sample
diversity, the collected image data underthe papernt
screening prior to training. The image annotation
software used for labeling was Labelimg.
Ultimately, the paper obtained 3033 images,
stored at a resolution of 640 pixels × 640 pixels. Of
these images, a total of 3,033 were assigned to the
training set, while 127 images were designated for the
validation set, and 124 images were reserved for the
test set. The dataset was labeled as nc=1 for pest
detection. Additionally, the paper incorporated the
COCO 2018 dataset into the study for further
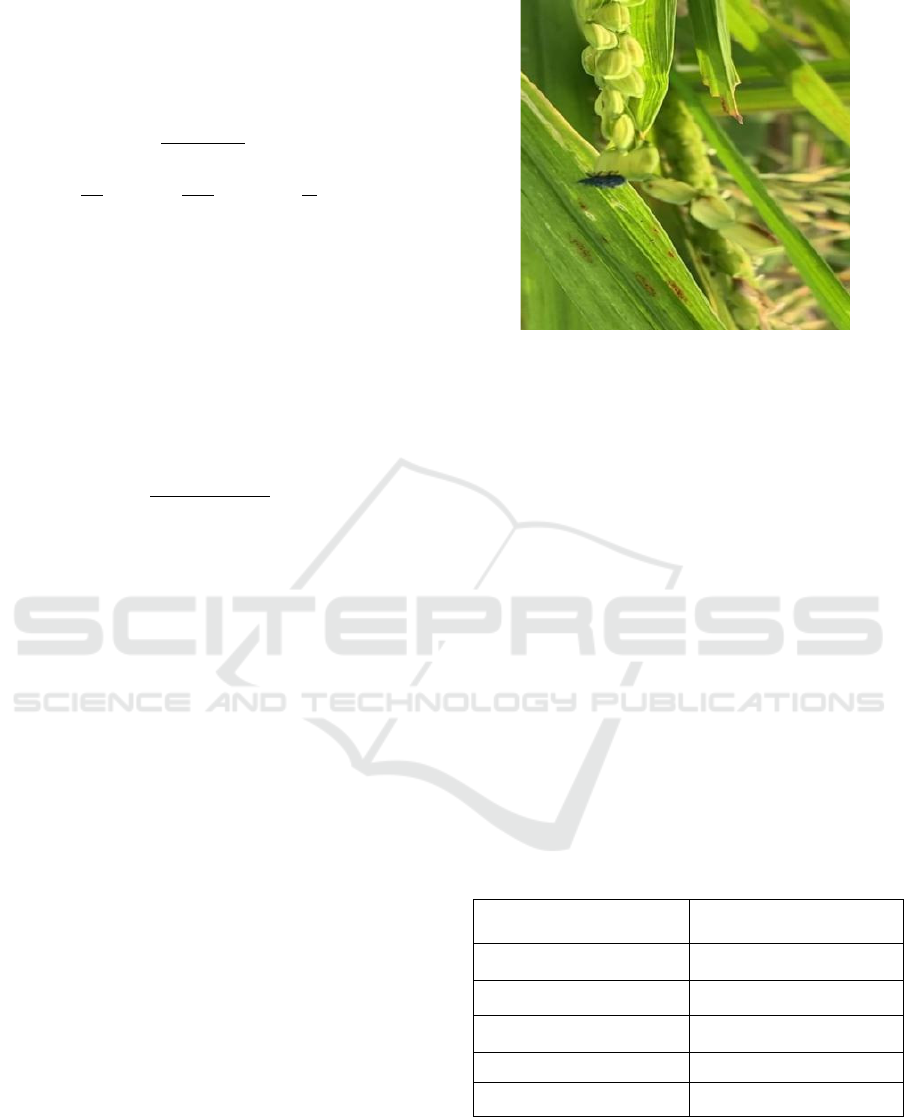
evaluation and comparison. The dataset is shown in
Figure 4:
Figure 4: A test case (Photo/Picture credit: Original)
The paper devised two models in total, each
leveraging multiple modules. The initial model
integrates the previously discussed attention
mechanism and transfigures the network backbone's
C3 layer into C2f, while the SPP layer is transformed
into MTSPPF. The second model incorporates APFN
alongside other modifications. Both models under the
papernt training and validation using the dataset
outlined in the preceding section
2.3.2 Experimental platform
The experiment was carried out utilizing the PyTorch
framework, which provides a flexible and efficient
environment for deep learning tasks. The specific
software and hardware configuration parameters used
in this study are detailed in Table 1, outlining the
essential components that contributed to the
experimental setup.
Table 1. Software and hardware platform configuration
parameters
Configuration Parameter
(CPU) Intel i9-13900kf
(GPU) NVIDIA GTX4090
Operation system Windows11
CUDA 10.2
Opencv 3.2.2
2.3.3 Model Evaluation Indicators
This paper details the evaluation metrics used to
assess the performance of the Kiwi flaw detection
model, with a primary emphasis on precision (P)
Pest YOLO: An Effective Insect Target Detection Algorithm for Small Targets
279
alongside recall (R) and mean average precision
(mAP). These metrics are crucial for gaining a
comprehensive insight into the model's effectiveness
in detecting flaws. The formulas for calculating
precision and recall are provided below:
𝑃=
𝑇𝑃
𝑇𝑃
+
𝐹𝑃
(6)
𝑅=
𝑇𝑃
𝑇𝑃
+
𝐹𝑁
(7)
True positives (TP), false positives (FP), and false
negatives (FN) are essential for evaluating model
performance. True positives are correctly identified
instances, while false positives are incorrectly labeled
as positive, and false negatives are actual positives
misclassified as negative. To measure model
effectiveness, average precision (AP) is calculated by
integrating precision values over their corresponding
recall values, effectively determining the area under
the precision-recall curve. This provides a
comprehensive assessment of the model's ability to
balance precision and recall across various thresholds.
Mean average precision (mAP) is derived by
averaging the average precision (AP) values across all
categories, providing an overall precision measure.
Mean Average Precision at IoU threshold 0.50
(mAP50) is calculated by averaging the AP values for
each class at the specified IoU threshold. The metrics
are defined as follows:
𝐴
𝑃=𝑃
𝑘
𝛥𝑅
𝑘
(8)
𝑚𝐴𝑃=
1
𝐶
𝐴
𝑃
𝑐
(9)
Additionally, the size of the weights file
(measured in megabytes, MB) plays a significant role
in the practical deployment of the model. A larger
weights size often indicates a more complex model
with a greater number of parameters, which can
impact both storage requirements and inference speed.
3 RESULTS AND DISCUSSION
The loss function curve offers a visual representation
of the model's convergence during the training
process, highlighting enhancements in stability as the
number of iterations increases. Conversely, mean
Average Precision (mAP) is a critical indicator of the
defect detection model's efficacy; higher mAP values
signify a greater average detection accuracy and
enhanced overall performance. By analyzing these
metrics, the paper can gain deeper insights into the
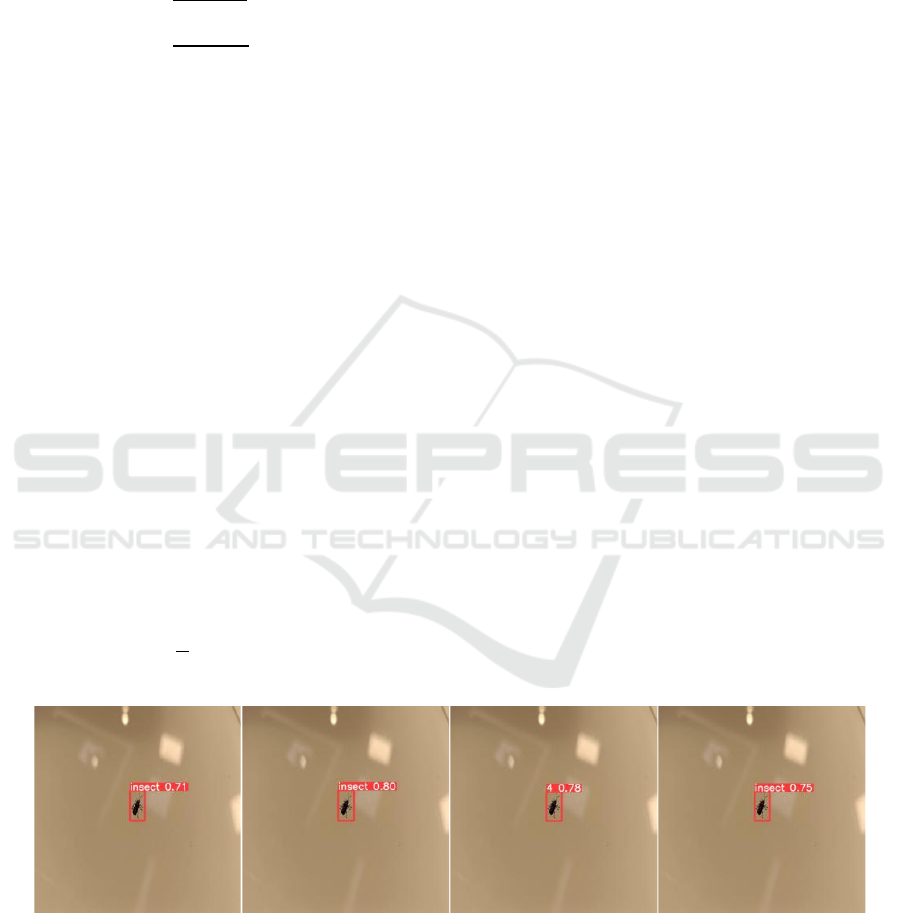
model's strengths and areas for improvement. The
results of the recognition process are shown in Figure
5.
The enhanced method is evaluated against the
original YOLOv5 model and other prominent deep
learning-based object detection algorithms. This
comparison assesses the performance improvements
resulting from the proposed modifications, providing
a thorough evaluation of its effectiveness in various
detection tasks. Specifically, the study contrasts the
YOLOv5 variant integrating C2f with MTSPPF, the
version optimized with FPN for the detection head,
and the one enhanced by the attention mechanism
with the original YOLOv5 and RCNN. Training was
conducted using the pest dataset collected from
Yunnan Farm. The results are shown in Figure 6.
Figure 5: Identification diagram. (Photo/Picture credit: Original)
DAML 2024 - International Conference on Data Analysis and Machine Learning
280
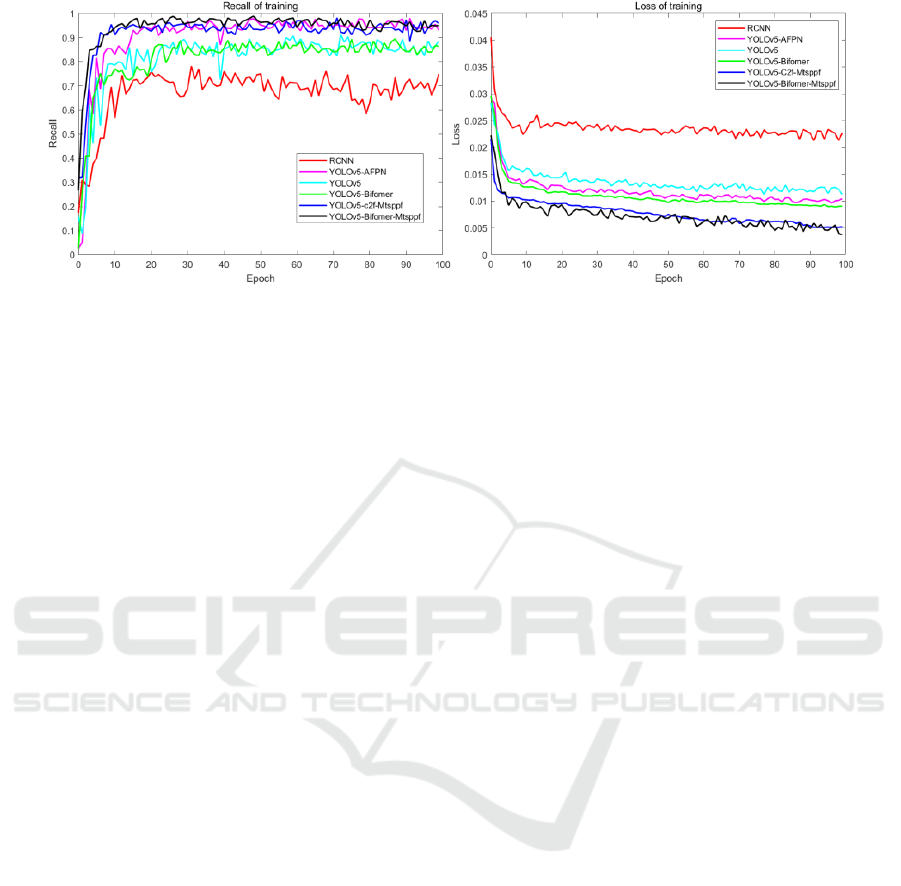
(a) loss curve (b) recall curve
Figure 6: Loss curves and recall curves. (Photo/Picture credit: Original)
To ensure a robust and reliable validation process,
this study implemented additional training using the
COCO 2017 dataset while following the previously
outlined methodologies. This strategic decision
significantly enriched the training experience,
enabling a more thorough evaluation of the enhanced
detection model's performance across various
datasets and scenarios. The research sought to
improve the model's adaptability and generalization
by capturing a wide range of object characteristics
through the use of diverse training data. This
comprehensive approach not only assesses the
model's effectiveness in different contexts but also
enhances its resilience to variations in object
appearance and environmental conditions, ultimately
leading to better real-world applicability.
The results of this extensive evaluation are
visually represented in Figure 7. A noteworthy aspect
of the COCO 2017 dataset is that approximately 40%
of its content consists of small objects, which are
often challenging for detection algorithms.
Addressing this challenge is crucial, as small objects
significantly impact various real-world applications,
especially in agriculture. By focusing on such a
diverse dataset, the training regimen was designed to
better accommodate the complexities of real-world
scenarios, particularly in recognizing small-scale
features that are vital for tasks such as crop health
monitoring.
Additionally, this approach provided a deeper
insight into the model's capabilities, helping
researchers pinpoint its strengths and areas needing
improvement. The results shown in Figure 7 not only
demonstrate the effectiveness of the proposed
enhancements but also highlight the model's
robustness in managing various object sizes and types.
This ultimately underscores its potential for practical
applications in crop inspection and pest detection.
In the analysis of the agricultural pest dataset, the
paper observed that the loss function tends to
converge around the 100-epoch mark, indicating a
stabilization in the model's learning process. This
early convergence suggests that the model effectively
captures the essential patterns and features present in
this dataset, allowing it to adapt quickly to the
underlying data distribution. Notably, the recall rate
shows a quicker convergence, achieving stability
after approximately 30 epochs. The swift
enhancement in recall suggests that the model excels
at early identification of true positives during the
training process. This capability is especially
advantageous in real-world applications, where
timely detection of pests is crucial for effective
management and intervention. Conversely, when
examining the COCO 2017 dataset, the paper found
that the loss function requires nearly 200 epochs for
convergence, signifying a more complex learning
landscape. The extended training duration reflects the
dataset's intricate diversity and the challenge of
accurately detecting objects across various scales and
contexts. Moreover, the recall rate for this dataset
begins to exhibit a converging trend only after 450
epochs, underscoring the need for prolonged training
to achieve reliable performance. This significant
disparity between the two datasets highlights not only
the varying complexities inherent in each but also the
different responses of the models to these challenges.
Such findings emphasize the importance of tailored
training strategies that consider the unique
characteristics of each dataset to optimize model
performance.
Pest YOLO: An Effective Insect Target Detection Algorithm for Small Targets
281
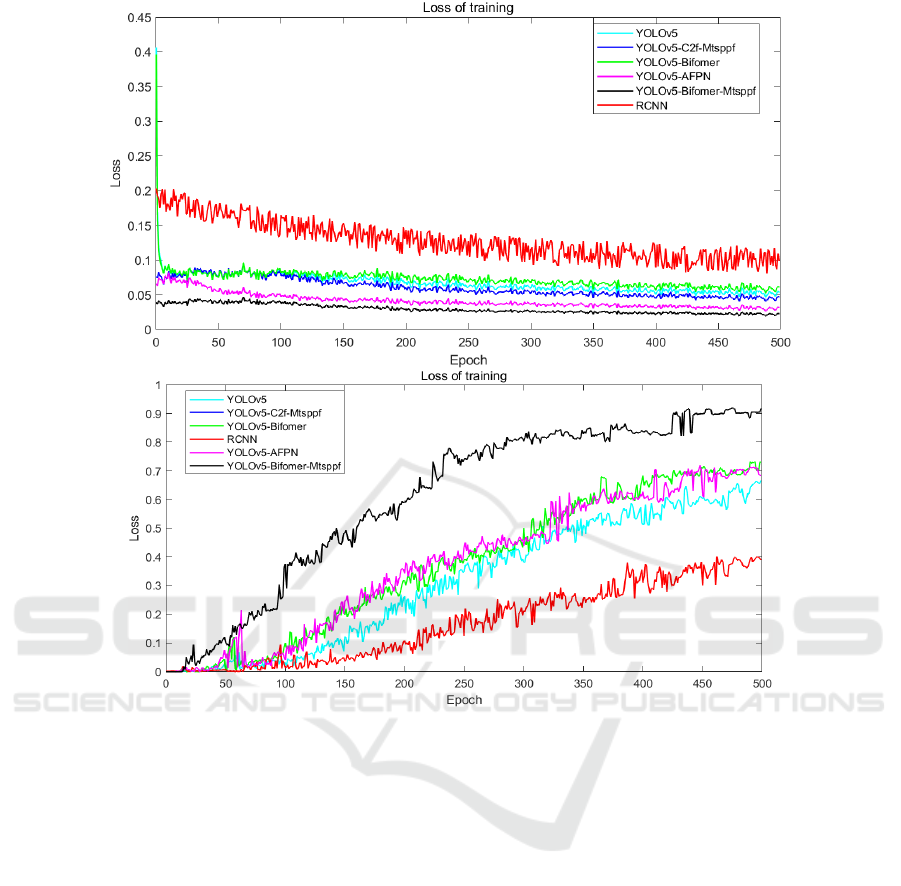
Figure 7: Loss curves and recall curves of Coco. (Photo/Picture credit: Original)
Through thorough analysis, the paper discovered
that YOLOv5, particularly when augmented by the
integration of the MTSPPF module and the BiFormer
attention module, demonstrates a markedly faster
convergence rate along with enhanced detection
performance. The addition of these advanced
modules appears to optimize the model's architecture,
allowing it to more effectively utilize additional
features and contextual information. This
optimization not only improves the model's overall
efficiency but also its ability to accurately identify
objects in diverse scenarios. This suggests that the
modifications not only expedite the training process
but also enhance the model's overall efficiency in
accurately identifying pests in agricultural settings.
The faster convergence indicates that the model can
learn the relevant patterns more quickly, leading to
improved performance in a shorter amount of time.
Furthermore, the detailed data comparisons
supporting these findings are presented in Table 2,
which provides a comprehensive view of the model's
performance across different scenarios. This table
highlights the effectiveness of the enhancements and
offers valuable insights into how these modifications
contribute to superior detection outcomes.
Based on the provided Table 3 and Table 4,
YOLOv5_BiFormer_MTSPPF stands out as the top-
performing model, achieving the highest mean
Average Precision (mAP) along with exceptional
precision and recall rates. This robust performance
highlights its effectiveness in accurately detecting
objects across various scenarios, making it
particularly suitable for applications that require high
reliability. Following closely is
YOLOv5_C2F_MTSPPF, which excels in both mAP
and recall, demonstrating a strong capability to
capture essential features while effectively
minimizing false negatives. Both YOLOv5_AFPN
and YOLOv5_BiFormer also deliver competitive
results,
though they lag slightly behind
DAML 2024 - International Conference on Data Analysis and Machine Learning
282
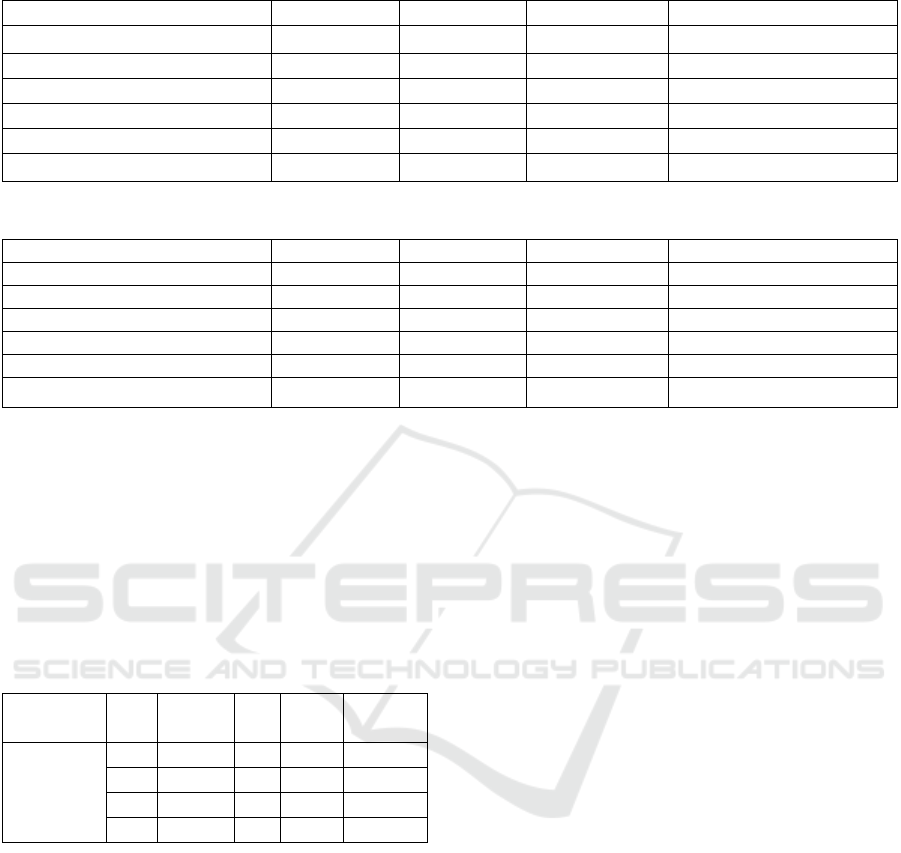
Table 2: Comparative experimental test results of tiny insect
Al
g
orith
m
P(%) R(%) mAP50(%) the wei
g
hts size (MB)
RCNN 75.34 68.61 65.32 6
YOLOv5 82.48 86.61 80.36 13
YOLOv5
_
C2f
_
Mtsppf 88.12 91.46 93.42 48
YOLOv5
_
AFPN 87.84 90.42 92.89 32
YOLOv5
_
Bifome
r
82.33 87.01 91.32 64
YOLOv5_Bifomer_Mtsppf 88.50 90.22 93.22 84
Table 3: Comparative experimental test results of Coco2017
Algorith
m
P(%) R(%) mAP50(%) the weights size (MB)
RCNN 66.1 70.74 67.88 8
YOLOv5 72.84 62.31 79.24 17
YOLOv5_C2f_Mtsppf 88.12 91.46 88.33 52
YOLOv5
_
AFPN 81.76 84.42 84.33 49
YOLOv5
_
Bifome
r
80.74 68.65 72.61 63
YOLOv5_Bifomer_Mtsppf 86.67 90.48 95.67 135
YOLOv5_BiFormer_MTSPPF. In comparisons with
the RCNN model, YOLOv5 consistently outperforms
RCNN across nearly all metrics, with the exception
of precision, where RCNN shows relatively better
results. Notably, RCNN exhibits the lowest mAP and
recall rates among the evaluated models,
underscoring the advancements achieved by the
YOLOv5 variants in the domain of object detection.
Table 4: Comparison results before and after adding
different modules.
Algorith
m
C2
f
mtspp
f
Bi
f
P(%
)
Time(s
)
YOLOv5
√
72.2 0.031
√
√
77.3 0.054
√
√
√
65.3 0.067
√
√
85.7 0.074
4 CONCLUSIONS
The study improved the YOLOv5 model for real-time
detection of small-scale crop defects and pests by
integrating modules such as C2f, MTSPPF, and
BiFormer attention mechanisms. Among the
enhanced models, YOLOv5_BiFormer_MTSPPF
demonstrated the best performance, achieving the
highest mean Average Precision (mAP), precision,
and recall rates across various datasets. This indicates
that the combination of BiFormer and MTSPPF
effectively optimizes the model’s feature extraction
and fusion capabilities, making it highly suitable for
real-time agricultural applications.
Although the improvements in detection
performance were not universally significant
compared to the original YOLOv5, the
YOLOv5_BiFormer_MTSPPF model consistently
outperformed other versions and traditional object
detection methods such as RCNN in key metrics.
However, the model's larger size and higher
computational requirements suggest the need for
hardware optimization in practical implementations.
Future research will focus on enhancing the model’
s efficiency, including potential pruning strategies
and extending its application to more crop types.
These advancements are essential for improving real-
time agricultural monitoring systems, offering
farmers more accurate and timely insights into crop
health and pest management.
REFERENCES
Donatelli, M., Magarey, R.D., Bregaglio, S., Willocquet, L.,
Whish, J.P.M., Savary, S. 2017. Modelling the Impacts
of Pests and Diseases on Agricultural Systems.
Agricultural Systems, 155, pp. 213–224. Elsevier.
Dong, Q., Sun, L., Han, T., Cai, M., Gao, C. 2024. PestLite:
A Novel YOLO-Based Deep Learning Technique for
Crop Pest Detection. Agriculture, 14(2), 228. MDPI.
Khalid, S., Oqaibi, H.M., Aqib, M., Hafeez, Y. 2023. Small
Pests Detection in Field Crops Using Deep Learning
Object Detection. Sustainability, 15(8), 6815. MDPI.
Karunasena, G.M.K.B., Priyankara, H.D.N.S. 2020. Tea
Bud Leaf Identification by Using Machine Learning
and Image Processing Techniques. International
Journal of Scientific & Engineering Research, 11(8), pp.
624–628.
Pest YOLO: An Effective Insect Target Detection Algorithm for Small Targets
283

Lawal, O.M., Zhao, H. 2021. YOLOFig Detection Model
Development Using Deep Learning. IET Image
Processing, 15(13), pp. 3071 – 3079. Wiley Online
Library.
Liu, H., Xu, K. 2021. Densely End Face Detection Network
for Counting Bundled Steel Bars Based on YoloV5. In:
Pattern Recognition and Computer Vision: 4th Chinese
Conference, PRCV 2021, Beijing, China, October 29–
November 1, 2021, Proceedings, Part I 4, pp. 293–303.
Springer.
Mukhopadhyay, S., Paul, M., Pal, R., De, D. 2021. Tea Leaf
Disease Detection Using Multi-objective Image
Segmentation. Multimedia Tools and Applications, 80,
pp. 753–771. Springer.
Roy, A.M., Bose, R., Bhaduri, J. 2022. A Fast Accurate
Fine-Grain Object Detection Model Based on YOLOv4
Deep Neural Network. Neural Computing and
Applications, 34(5), pp. 3895–3921. Springer.
Tang, Z., Lu, J., Chen, Z., Qi, F., Zhang, L. 2023. Improved
Pest-YOLO: Real-time Pest Detection Based on
Efficient Channel Attention Mechanism and
Transformer Encoder. Ecological Informatics, 78,
102340. Elsevier.
Wang, Z., Zheng, Y., Li, X., Jiang, X., Yuan, Z., Li, L.,
Zhang, L. 2021. DP-YOLOv5: Computer Vision-Based
Risk Behavior Detection in Pothe paperr Grids. In: 4th
Chinese Conference on Pattern Recognition and
Computer Vision, PRCV 2021, Proceedings, Part I,
Beijing, China, October 29–November 1, pp. 318–328.
Springer, Heidelberg.
Wen, C., Chen, H., Ma, Z., Zhang, T., Yang, C., Su, H.,
Chen, H. 2022. Pest-YOLO: A Model for Large-Scale
Multi-Class Dense and Tiny Pest Detection and
Counting. Frontiers in Plant Science, 13, 973985.
Frontiers Media SA.
Yang, N., Yuan, M., Wang, P., Zhang, R., Sun, J., Mao, H.
2019. Tea Diseases Detection Based on Fast Infrared
Thermal Image Processing Technology. Journal of the
Science of Food and Agriculture, 99(7), pp. 3459–3466.
Wiley Online Library.
Zhang, L., Zou, L., Wu, C., Chen, J., Chen, H. 2021.
Locating Famous Tea's Picking Point Based on Shi-
Tomasi Algorithm. Computers, Materials & Continua,
69(1).
Zhu, L., Wang, X., Ke, Z., Zhang, W., Lau, R.W.H. 2023.
Biformer: Vision Transformer with Bi-level Routing
Attention. In: Proceedings of the IEEE/CVF
Conference on Computer Vision and Pattern
Recognition, pp. 10323–10333. IEEE.
DAML 2024 - International Conference on Data Analysis and Machine Learning
284
