
Survival Analysis of the Titanic Using Random Forests
Tianchong Tang
College of Information Science and Engineering, Ocean University of China, San Sha Street, Qing Dao, China
Keywords: Random Forest, Survival Analysis, Machine Learning.
Abstract: The Titanic disaster is one of the most widely studied maritime tragedies. Analyzing passenger survival rates
has become a hot topic. This research endeavors to forecast the likelihood of survival among Titanic voyagers
by employing a random forest algorithmic approach. The datasets employed in this analysis include features
such as PassengerId, Survived, Pclass, Name, Sex, Age, SibSp, Parch, Ticket, Fare, Cabin, and Embarked.
To enhance prediction performance, the author implemented a random forest algorithm, which integrates
multiple decision trees. Following data preprocessing, the dataset was randomly separated into a training set,
comprising 80%, and a test set, constituting 20%. Across 500 distinct iterations, the data was randomly split
into training and test sets. The random forest model achieved an average accuracy of 0.8013, demonstrating
its effectiveness in assessing the likelihood of Titanic voyagers' endurance. This underscores the considerable
potential of the random forest algorithm in conducting survival analyses.
1 INTRODUCTION
The Titanic was not only an engineering marvel of its
time but also a focal point for numerous studies and
discussions. The accident killed about 1,500
people. To enhance disaster response capabilities,
researchers began utilizing machine learning
techniques to predict passengers' survival
probabilities. In addition to the work by (Gleicher and
Stevans 2004), who employed logistic regression
models to analyze key factors such as gender and age,
researchers gradually recognized that social status
might also influence survival chances. For instance, a
passenger's cabin class and royal status could garner
support from fellow travelers in critical moments,
thereby improving survival odds. Furthermore,
research has demonstrated the successful application
of generalized linear models and decision tree
algorithms (distinct from the algorithms discussed in
this paper) (Durmuş and Güneri, 2020). For data
processing, there are also studies that have created
many new features, such as "child", "new_fare",
"FamilyIdentity", etc. (Datla, 2015), which are
different from the feature engineering in this paper.
In the study of Nadine Farag and Ghada Hassan, the
accuracy of the naive Bayes model even reached
92.52% (Farag and Hassan, 2018). There are also
some studies that predict the survival risk of Titanic's
passengers through statistical scoring methods (Ligot,
2022), which can divide passengers into different risk
levels, unlike machine learning. Historically, survival
analysis has relied on statistical methods, including
the Cox proportional hazards model (Cox, 1972) and
the Kaplan-Meier estimator (Kaplan and Meier,
1958). This paper delves into survival analysis of
Titanic passengers using the random forest method.
The article initially explicates the fundamental tenets
underlying the random forest model, subsequently
outlines the preprocessing procedures applied to the
original Titanic data collection, and ultimately
ascertains the precision of the random forest model.
This exemplifies the potentiality of machine learning
in the scrutiny of survival percentages. The
discussion section first introduces decision trees,
which are a key component of the random forest, then
analyzes the optimal decision tree from the
perspective of information gain, and finally concludes
by integrating decision trees into a unified random
forest framework.
120
Tang and T.
Survival Analysis of the Titanic Using Random Forests.
DOI: 10.5220/0013510300004619
In Proceedings of the 2nd International Conference on Data Analysis and Machine Learning (DAML 2024), pages 120-123
ISBN: 978-989-758-754-2
Copyright © 2025 by Paper published under CC license (CC BY-NC-ND 4.0)
2 THE PRINCIPLE OF RANDOM
FOREST
2.1 The Basic Principles of Decision
Tree Generation
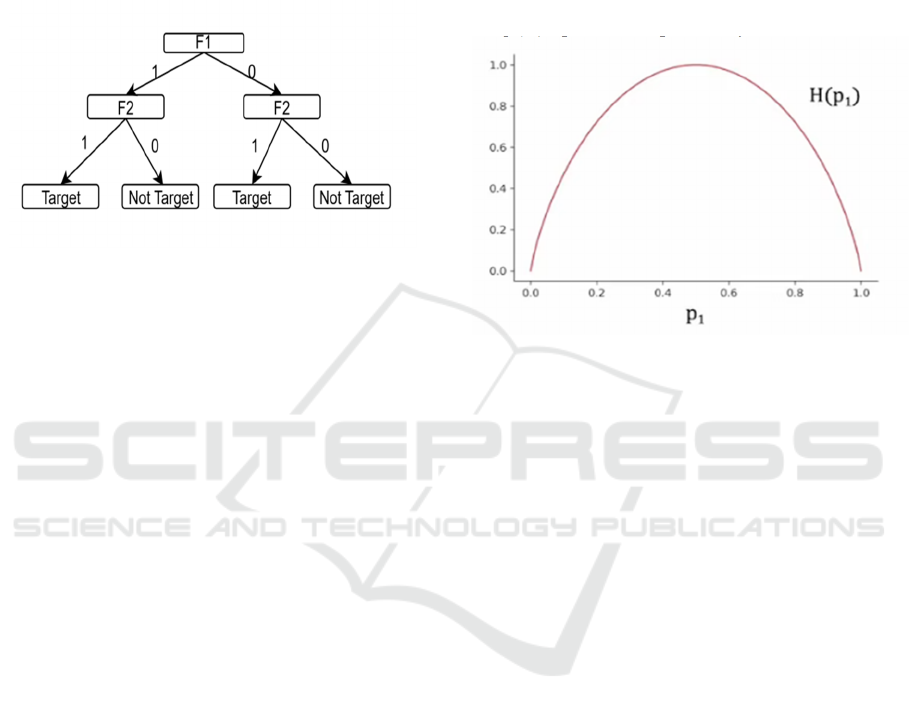
Figure 1:Sample decision tree based on binary target
variable Y (Picture credit : Original)
Figure 1 illustrates a basic decision tree model
utilized for classification tasks. At the beginning of
the decision tree (at the top), the initial classification
of samples occurs based on a specific feature, known
as the root node. In this instance, samples can be
divided into those with F1=1 and those with F1=0.
Subsequently, further classification happens through
internal nodes, until the final feature is evaluated.
There may be instances where further classification is
unnecessary, as samples at that point belong to a
single category. In such cases, there is no need for
additional classification since only one type of sample
remains in that node. Conversely, even after
classifying through all the designated features, some
nodes may contain samples from multiple categories.
When this occurs, the nodes that cannot be further
classified are referred to as leaf nodes. Often, these
leaf nodes contain a mix of different samples. If the
disparity between the sizes of the two sample types is
minimal, it complicates predictions derived from this
decision tree. This indicates that the decision tree
created based on the sequence of these features may
not be optimal. A potential next step could involve
utilizing F2 as the new root node for classification.
The problem is addressed using information entropy.
The following section delves into the process of
obtaining an ideal decision tree. It is important to
keep in mind that in cases where the dataset contains
numerous attributes, the creation of a decision tree
can become intricate if each attribute is taken into
account. By leveraging information entropy, a
determination can be made on whether further
bifurcation should be pursued.
2.2 Information Gain
Information entropy is used to indicate the degree of
inconsistency in information (Shannon, 1948). The
formula for calculating information entropy is:
HX =
px
log
px
(1)
px
represents the probability of a random event.
Figure 2: Image as a function of information
entropy(Picture credit : Original)
Figure 2 is a function of information entropy, and
when the number of target and non-target samples is
about the same, the prediction accuracy is low and the
information entropy is large. Not an ideal decision
tree. In the presence of a substantial disparity in the
count of target versus non-target exemplars, the
predictive precision is elevated and the entropy of
information is diminished This is an ideal decision
tree.
Information Gain is a metric used to measure the
information contribution of a feature to a dataset
(Shannon, 1948). The basic idea is how much the
information uncertainty (entropy) of the dataset is
reduced when it is divided by a certain feature. The
weighted average information entropy of different
branches in the decision tree divided by different
feature order is used to obtain the final weighted
average information entropy. The decision tree with
the least weighted information entropy is the most
ideal decision tree. Let the author gives a more
detailed explanation. Distribute the count of
exemplars pertaining to each root node by the overall
exemplar count, multiply the resultant by its
respective entropy of information, and add up these
values to the weighted mean entropy of information.
By comparing the weighted average information
entropy, the decision tree with the highest accuracy
can be obtained, that is, the optimal decision tree.
Survival Analysis of the Titanic Using Random Forests
121

2.3 Random Forest
The random forest performs put-back sampling of the
initial samples, and train the decision tree from the
samples after each put-back sampling (Breiman,
2001). Specifically, a random forest takes one sample
out of the initial n samples as the first sample of a new
sample. In the next sampling, the previous sampled
items are still taken into consideration. This means
that the samples that have been drawn before may still
be selected again. There are n new samples that are
taken back to the sampling plot n times, and the
obtained n new samples are used to train a decision
tree. Then train the next decision tree in the same way.
The quantity of decision trees is adjustable. Typically,
as the count of decision trees increases, the efficacy
of the random forest model improves. However,
training too many decision trees can lead to too long
training times. Too little training for decision trees
makes it difficult to reduce the impact of noise. The
number of decision trees is generally 64 to 228.
Modify the count of decision trees according to the
model's performance, iterating until the optimal
random forest model is constructed.
The prediction accuracy formula is:
a =
(2)
Where a is the prediction accuracy, t is the number
of samples correctly predicted, and s is the sum of the
samples. The results a are rounded.
3 RESULTS
In Table 1, the initial six entries of the dataset are
illustrated. This dataset comprises a total of 893
records, featuring twelve attributes: PassengerId,
Survived, Pclass, Name, Sex, Age, SibSp, Parch,
Ticket, Fare, Cabin, and Embarked. PassengerId is
only used as an identifier, so it can be disregarded.
The processing of the data is as follows:
1.Sex, Pclass, Embarked data categories are
minimal. Different numbers represent different
categories of data. For example, in the Sex feature,
female is 1 and male is 0.
2.The Age feature is incomplete, so it is filled in
with the median value calculated from the
combination of the Sex feature and PClass feature.
3. For continuous data such as Age and Fare, set to
4 appropriate intervals and use different numbers to
represent different intervals. It is worth noting that
since there are very few people with an age greater
than 64, the data with an age greater than 64 are not
processed.
4.Merge the SibSp and Parch features into an
IsAlone feature. If SibSp and Parch are added
together to 0, then IsAlone is 0, otherwise it is 1.
5.Change the Name feature to the Title feature
according to its characteristics, and also use different
numbers to represent different data types. If the Name
contains Mr, it is 1 in the Title. If the Name contains
the Master, it is 4 in the Title.
6. Because the filling of Age features is related to
PClass features, leading to the creation of a combined
Age*Class feature.
The writer partitioned the dataset into two subsets:
a training set and a test set, allocating 80% for the
purpose of training and retaining 20% for testing.
Table 1: Example dataset.
PassengeId Survived Pclass Name Sex Age SibSp Parch Ticket Fare Cab
in
Emba
rke
d
1 0 3 Braund, Mr. Owen
Harris
male 22 1 0
A/5
21171
7.25 S
2 1 1 Cumings, Mrs.
John Bradley
(Florence Briggs
Thayer)
female 38 1 0
PC
17599
71.2833 C85 C
3 1 3
Heikkinen, Miss.
Laina
female 26 0 0
STON/
O2.
310128
2
7.925 S
4 1 1 Futrelle, Mrs.
Jacques Heath (Lily
May Peel)
female 35 1 0 113803 53.1
C12
3
S
5 0 3 Allen, Mr. William
Henr
y
male 35 0 0 373450 8.05 S
6 0 3 Moran, Mr. James male 0 0 330877 8.4583 Q
DAML 2024 - International Conference on Data Analysis and Machine Learning
122

Table 2: Processed example dataset.
Passen
g
eI
d
Pclass Sex A
g
e Fare Embarke
d
Title IsAlone A
g
e*Class
892 3 0 2 0 2 1 1 6
893 3 1 2 0 0 3 0 6
894 2 0 3 1 2 1 1 6
895 3 0 1 1 0 1 1 3
896 3 1 1 1 0 3 0 3
897 3 0 0 1 0 1 1 0
898 3 1 1 0 2 2 1 3
Table 2 displays the Processed sample dataset,
which is utilized to train the random forest model and
analyze the training information (100 decision trees
were employed by the author). To minimize errors
stemming from the random selection of both training
and test data, the researchers randomly picked data
500 times and trained them to determine the
predictive accuracy. By averaging these values, the
mean predictive accuracy obtained was 0.8013.
4 CONCLUSIONS
This study reveals that the Random Forest algorithm
achieved a high level of predictive accuracy of
survival rates on the Titanic dataset, reaching 0.8013
(Eighty percent of the initial dataset is employed in
the training subset, whereas twenty percent is
reserved for the testing subset. The original dataset is
randomly divided into 500 subsets to calculate the
average test accuracy). This outcome exemplifies the
benefits of utilizing random forest models for
predicting survival rates, particularly in scenarios
involving numerous features and intricate
interrelations. There is still potential for improvement
in data processing in current research. Additionally,
The precision of survival forecasting can be
augmented further through the utilization of
alternative model evaluations or the amalgamation of
diverse models. Future studies will likely make
progress in this area.
REFERENCES
Breiman, L., 2001. Random forests. In Machine
learning, 45, 5-32.
Cox, D. R., 1972. Regression models and life‐tables. In
Journal of the Royal Statistical Society: Series B
(Methodological), 34(2), 187-202.
Datla, M. V., 2015. Bench marking of classification
algorithms: Decision Trees and Random Forests-a case
study using R. In 2015 international conference on
trends in automation, communications and computing
technology (I-TACT-15) (pp. 1-7). IEEE.
Durmuş, B., Güneri, Ö. İ., 2020. Analysis and detection of
Titanic survivors using generalized linear models and
decision tree algorithm. In International Journal of
Applied Mathematics Electronics and Computers, 8(4),
109-114.
Farag, N., Hassan, G., 2018. Predicting the survivors of the
Titanic Kaggle, machine learning From disaster.
In Proceedings of the 7th international conference on
software and information engineering (pp. 32-37).
Gleicher, D., Stevans, L. K., 2004. Who survived Titanic?
A logistic regression analysis. In International Journal
of Maritime History, 16(2), 61-94.
Kaplan, E. L., Meier, P., 1958. Nonparametric estimation
from incomplete observations. In Journal of the
American statistical association, 53(282), 457-481.
Ligot, D. V., 2022. Developing a Titanic Survival
Scorecard: Risk Analysis of Populations Through
Statistical Scoring Methods. Available at SSRN
4015684.
Shannon, C. E., 1948. A mathematical theory of
communication. In The Bell system technical
journal, 27(3), 379-423.
Titanic_data, 2024.
https://www.kaggle.com/competitions/titanic/data
Survival Analysis of the Titanic Using Random Forests
123
