
Renal CT Image Classification Based on Densely Connected
Convolutional Networks
Guangjie Qian
Data Science and Big Data Technology, Changzhou University, Changzhou, Jiangsu, 213164, China
Keywords: DenseNet121, CNN, Image Classification, Kidney Disease.
Abstract: In response to the current situation of the increasing incidence of kidney diseases worldwide, the efficiency
of traditional clinical diagnosis may not be enough to cope with future needs. Compared with traditional
methods of clinical diagnosis, the automatic classification of renal computed tomography (CT) images based
on convolutional neural networks (CNN) in this study has the potential to significantly improve the efficiency
and accuracy of clinical diagnosis. In the paper, the Densely Connected Convolutional Networks 121
(DenseNet121) model is selected for training on 12,446 CT images, which include categories such as kidney
cysts, kidney stones, tumors, and normal tissues. The model training was performed using an early stopping
strategy and multi-cycle validation loss assessment. Subsequently, the model was tested on an independent
test set to achieve an impressive accuracy of 0.9351 and a precision of 0.9393. The experiments conducted in
this study have garnered a good response, and their high accuracy could potentially enhance the efficiency of
clinical diagnosis and provide better safety for patients.
1 INTRODUCTION
Nowadays, the incidence of renal diseases has
become higher due to factors such aspersonal life
habits and deterioration of the external environment
(Zhang et al., 2019). Kidneys are one of the very
important organs in the human body, which are
responsible for maintaining various functions of the
body. Such as metabolism, fluid balance, and
endocrine functions. Therefore, kidney disease may
have a serious impact on health. Therefore, the ability
to accurately and quickly determine kidney health is
crucial for the timely detection, prevention, and
treatment of kidney diseases.
Currently, most of the clinical diagnosis of kidney
health is done manually by testing of CT (Zhang et
al., 2019). CT, as a medical imaging technique,
utilizes X-rays and computer technology to produce
detailed cross-sectional images of the internal
structures of the body (Goldman, 2007). These scans
offer clearer and more detailed images than ordinary
X-rays, enabling doctors to accurately view organs,
blood vessels, and more within the body. Kidney
diseases, including kidney cysts and kidney stones,
are likely to grow in the patient base with the effects
of frequent diseases and an aging population.
Therefore, the efficiency of traditional manual CT
diagnosis may need some image recognition
algorithms to improve in the future.
At the present time, deep learning has been
applied to the problem of kidney CT image
classification, and CNNs are widely used in several
tasks of image processing (Alzu’bi et al., 2022;
Mehedi et al., 2022). Such as VGG16, ResNet,
MobileNetV2, they all play an important role in this
problem.
The dataset is made up of 12,446 distinct entries,
encompassing 3,709 instances of cysts, 5,077 normal
samples, 1,377 cases of stones, and 2,283 occurrences
of tumors (Islam et al., 2022). The study uses deep
learning model DenseNet121, Adam optimization,
and other methods. The main research process is as
follows: firstly, data preprocessing and data
enhancement are carried out on the original data, and
a model is constructed to classify and analyze renal
CT images using the DenseNet121 deep learning
framework. Then the loss rate, accuracy, precision,
recall, and other indexes of the model are tested on an
independent validation set to evaluate the model
(Arulananth et al., 2024; Magboo & Magboo, 2024),
and the classification result graphs of the test are
output at the same time.
This paper is divided into several parts: the first
and current part is the introduction; the second part
outlines the main methodology used in the study,
Qian and G.
Renal CT Image Classification Based on Densely Connected Convolutional Networks.
DOI: 10.5220/0013510200004619
In Proceedings of the 2nd International Conference on Data Analysis and Machine Learning (DAML 2024), pages 115-119
ISBN: 978-989-758-754-2
Copyright © 2025 by Paper published under CC license (CC BY-NC-ND 4.0)
115
including specific methods such as data processing
and model construction; the third part describes the
results of the study, including the performance and
evaluation of the model; and the last part summarizes
the whole paper.
2 METHOD
The main approaches of this research include data
preprocessing and enhancement, and model
architecture.
2.1 Data Preprocessing and
Augmentation
In this study, data preprocessing and enhancement of
images prior to model construction aim to enhance
the model's generalization capability and ensure its
robustness in real-world applications. (Shorten &
Khoshgoftaar, 2019).
All renal CT image data were normalized using
the 'ImageDataGenerator' method, a technique that
involves scaling the raw pixel values of the images
from the range 0-255 to between 0-1. This step helps
to optimize the stability of the algorithm during
model training and speeds up model convergence.
Data enhancement techniques are also introduced.
These transitions include stochastic rotation (up to 40
degrees), horizontal and vertical translation (up to
20%). These steps increase the dataset's diversity
while enabling the model to learn the image
variations due to operational differences in real
clinical settings. For example, rotation and translation
simulate the different poses of the patient during
scanning, while zooming and shearing allow the
model to recognize kidney structures in images of
different sizes and scales. Horizontal flipping can
further enhance the model's adaptability to changes in
image orientation.
2.2 Modeling
The DenseNet model can effectively mitigate the
problem of vanishing gradients and enhance feature
propagation and reuse by connecting each layer to all
previous layers, drastically reducing parameter
requirements. Its structural design not only improves
the model's training efficiency but also has superior
performance on multiple image recognition tasks.
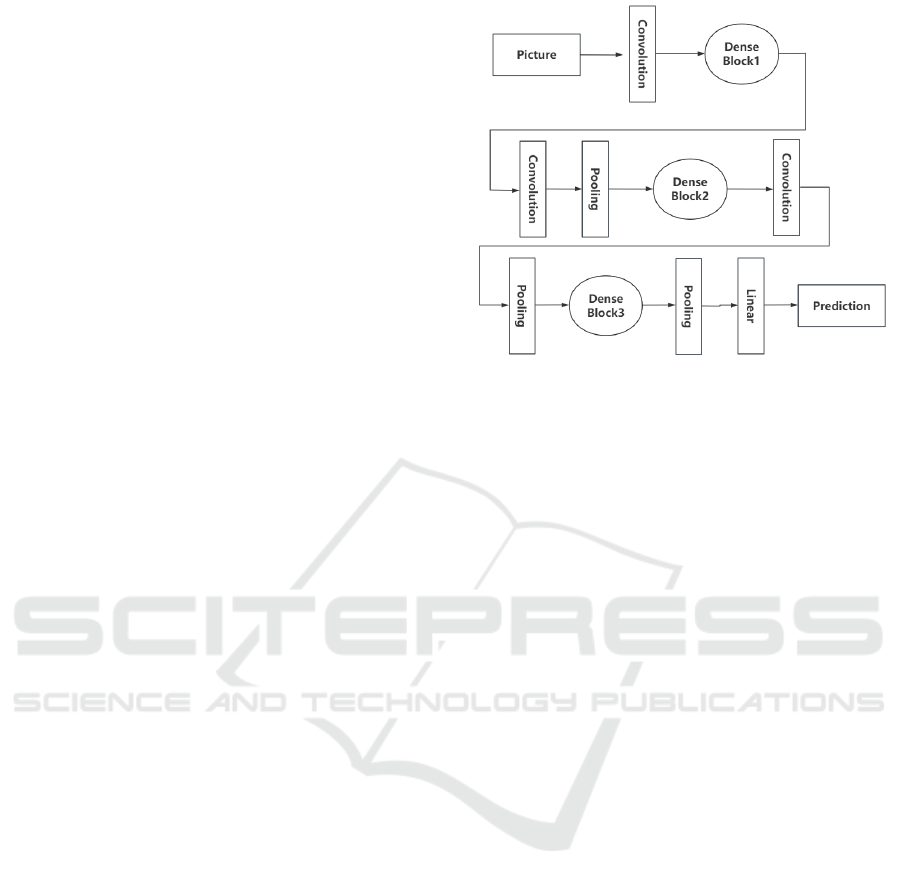
Figure 1 below illustrates the structure of the
DenseNet model. (Huang et al., 2017).
Figure 1: DenseNet model structure.(Picture credit :Huang
et al., 2017)
Figure 1 shows the initial image processed by one
convolutional layer through three densely connected
blocks. The layers within each densely connected
block receive the outputs of all previous layers as
inputs, which enhances the transfer of features. The
dense blocks are connected through a transition layer
consisting of a convolutional and pooling layer, and
finally the result is output after the features are varied
through a linear layer (Huang et al., 2017).
Therefore, the DenseNet121 model is selected for
CT image classification in the study.
A global average pooling layer is introduced to
reduce the parameters and mitigate overfitting when
constructing the model. To enhance the stability of
model training, a batch normalization layer is added,
and a fully connected layer with the ReLU activation
function is introduced to improve the model's
nonlinear processing capability. Overfitting of the
model is prevented by culling the layer with the scale
set to 0.5. Finally, the output layer contains four
neurons, each corresponding to a kidney CT image
category, and the probability of each category is
produced using the softmax activation function.
During the training process, the Adam optimizer
is used in the study, which has the property of
adaptive learning rate to converge quickly in the early
stage of model training and remain stable in the later
stage (Hospodarskyy et al., 2024; Reyad et al., 2023).
Meanwhile, the classified cross entropy is applied as
a loss function to optimize the probability distribution
of the model output.
To address the category imbalance in the dataset,
weights were calculated and applied for each category
during model training. The weights of different
categories are set before training to prevent the
DAML 2024 - International Conference on Data Analysis and Machine Learning
116
possibility of biasing back to the category with more
samples during training, which improves the
prediction accuracy of the model for the category
with fewer samples. In addition, to prevent overfitting
in model iterations, optimize model performance, and
save resources. Training was performed using the
early discontinue method. When training was
discontinued when the validation loss did not improve
for three consecutive cycles, the model with the
highest validation accuracy was saved using
ModelCheckpoint.
3 RESULT
The data of this study contains four types of kidney
CT images. The study splits the raw data into a
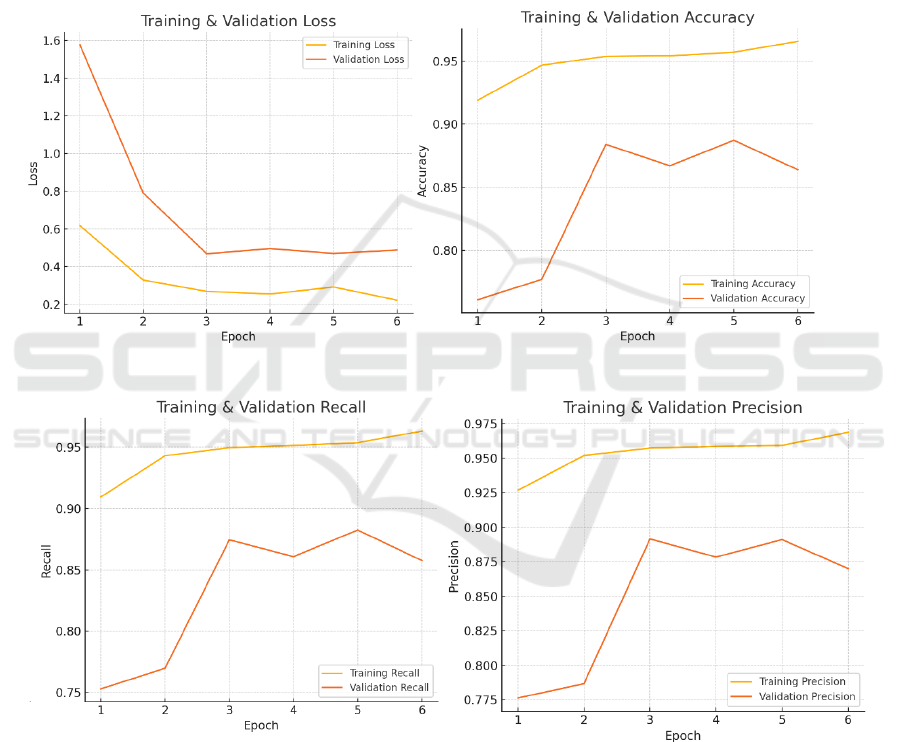
training set and a test set with a 7:3 ratio. Figure 2
illustrates the training process.
(a) (b)
(c) (d)
Figure 2: (a) Loss image, (b) Accuracy image, (c) Recall image, (d) Precision image.(Picture credit : Original)
Figure 2 shows the trends of the model's loss,
accuracy, precision, and recall over six training
rounds. Overall, the loss decreases significantly
during model training, the other three values improve,
and the validation loss gradually decreases.
The DenseNet121 model training process
evaluates the performance of the model at each
iteration with four key metrics: loss value, accuracy,
precision, and recall. These metrics are used to fully
reflect the model capability and save the optimal
model at each iteration. The test results are presented
in Table 1.
Renal CT Image Classification Based on Densely Connected Convolutional Networks
117
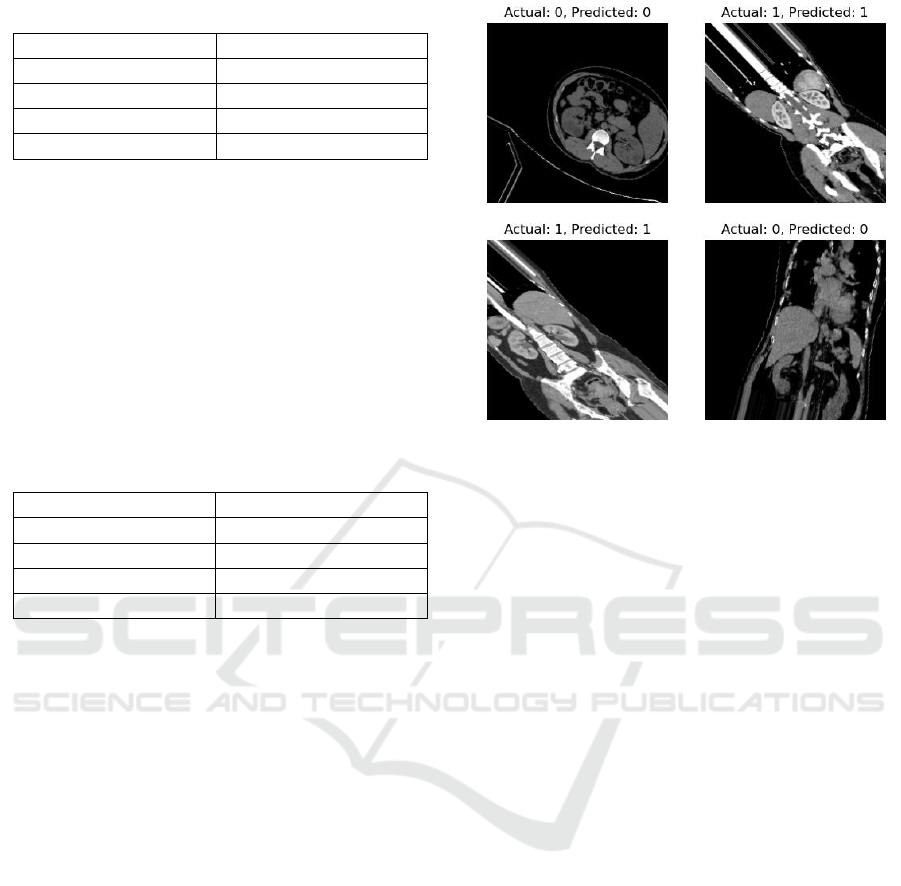
Table 1: Model Evaluation Training Set.
Metric
Value
Evaluation Loss
0.2218
Model Accuracy
0.9658
Prediction Precision
0.9688
Recall Rate
0.9631
Table 1 exhibits the model training results at the
optimal iteration period. It can be seen that the model
training loss is 0.2218. The low loss shows that the
model fits properly on the training data. The model's
three metrics on the training set are about 0.96%,
reflecting that the model accurately performs the
classification task.
The study conducted a comprehensive evaluation
of the model using an independent validation set with
the same metrics as Table 1 to fully reflect the model's
ability to perform on an unknown dataset. The test
results are shown in Table 2.
Table 2: Model Evaluation Test Set.
Metric
Value
Evaluation Loss
0.3163
Model Accuracy
0.9351
Prediction Precision
0.9393
Recall Rate
0.9325
In evaluating the performance of the renal CT
image classification model, the validation set contains
about 5,000 images covering four categories. The
following results were obtained from the test study:
loss value 0.3163, accuracy 0.9351, precision 0.9393,
and recall 0.9325. These results indicate that the
model demonstrates high classification accuracy and
reliability, effectively recognizing and classifying CT
images related to renal diseases in most cases.
In order to demonstrate the model effect in
practical applications more intuitively, the study also
tested the actual classification prediction on renal CT
images, and the results were visualized and
graphically presented. The test images and labels
were extracted from the validation set, and the
categories were tested on randomly selected images.
The tested images and the predicted and actual values
are finally shown for comparison. Figure 3 shows one
of the results of the above presentation.
Figure 3: Model effect test.(Picture credit : Original)
Figure 3 shows four CT images and predicted
results with four categories: normal kidney, cyst,
stone, and tumor. The predicted results are
summarized as follows: The first picture shows the
normal kidney image and predicted result with the
actual label. The label content (Actual: 0, Predicted:
0) indicates that the predicted and actual values are
identical. The results of others also show that the
predicted values are also in perfect agreement with
the actual values, all of which can indicate that the
model is very objective in practical applications.
4 CONCLUSIONS
In this paper, it is investigated how deep learning can
be combined with renal CT image processing with the
aim of improving diagnostic accuracy and efficiency.
In this study, the DenseNet121 model was finally
trained on 12446 CT images containing different
kidney conditions, which performed well on the
training set, with evaluation metrics such as accuracy
and precision above 0.95. The saved optimal model
achieved an accuracy of 93.51% on the independent
test set. In order to better visualize the model's
effectiveness in real life, samples were extracted from
the study to compare the actual and predicted results,
and the predictions were all correct as can be seen in
the results visualization. All these show that the
DenseNet 121 model has a better ability to recognize
kidney CT images. However, to enhance diagnostic
reliability for patients, this technology requires
further refinement and practical application. After
DAML 2024 - International Conference on Data Analysis and Machine Learning
118

all, there are many complex problems encountered in
medical image recognition, and the accuracy should
constantly strive for 100% while avoiding possible
errors such as overfitting.
ACKNOWLEDGEMENTS
The dataset used in the study was obtained from the
CT kidney dataset shared by Slam et al. This dataset
provided valuable support for the study. The
completion of this study would also like to thank the
authors of all the references in this paper, which were
of great help during the study.
REFERENCES
Alzu’bi, D., Abdullah, M., Hmeidi, I., AlAzab, R.,
Gharaibeh, M., El-Heis, M., ... & Abualigah, L. (2022).
Kidney tumor detection and classification based on
deep learning approaches: a new dataset in CT
scans. Journal of Healthcare Engineering, 2022(1),
3861161.
Arulananth, T. S., Prakash, S. W., Ayyasamy, R. K.,
Kavitha, V. P., Kuppusamy, P. G., & Chinnasamy, P.
(2024). Classification of Paediatric Pneumonia Using
Modified DenseNet-121 Deep-Learning Model. IEEE
Access.
Goldman, L. W. (2007). Principles of CT and CT
technology. Journal of nuclear medicine
technology, 35(3), 115-128.
Huang, G., Liu, Z., Van Der Maaten, L., & Weinberger, K.
Q. (2017). Densely connected convolutional networks.
In Proceedings of the IEEE conference on computer
vision and pattern recognition (pp. 4700-4708).
Hospodarskyy, O., Martsenyuk, V., Kukharska, N.,
Hospodarskyy, A., & Sverstiuk, S. (2024).
Understanding the Adam Optimization Algorithm in
Machine Learning.
Islam, M. N., Hasan, M., Hossain, M. K., Alam, M. G. R.,
Uddin, M. Z., & Soylu, A. (2022). Vision transformer
and explainable transfer learning models for auto
detection of kidney cyst, stone and tumor from CT-
radiography. Scientific Reports, 12(1), 1-14.
Magboo, V. P. C., & Magboo, M. S. A. (2024). Batch Size
Selection in Convolutional Neural Networks for
Glaucoma Classification. Procedia Computer Science,
235, 2749-2755.
Mehedi, M. H. K., Haque, E., Radin, S. Y., Rahman, M. A.
U., Reza, M. T., & Alam, M. G. R. (2022, November).
Kidney tumor segmentation and classification using
deep neural network on ct images. In 2022
International Conference on Digital Image Computing:
Techniques and Applications (DICTA) (pp. 1-7). IEEE.
Reyad, M., Sarhan, A. M., & Arafa, M. (2023). A modified
Adam algorithm for deep neural network optimization.
Neural Computing and Applications, 35(23), 17095-
17112.
Shorten, C., & Khoshgoftaar, T. M. (2019). A survey on
image data augmentation for deep learning. Journal of
big data, 6(1), 1-48.
Zhang, H., Chen, Y., Song, Y., Xiong, Z., Yang, Y., & Wu,
Q. J. (2019). Automatic kidney lesion detection for CT
images using morphological cascade convolutional
neural networks. IEEE Access, 7, 83001-83011.
Renal CT Image Classification Based on Densely Connected Convolutional Networks
119
