
Forecasting Future EV Sales: A Comparative Study of Model
Performance
Christopher Genzhuo Cui
a
Holmdel High School, Holmdel, U.S.A.
Keywords: Artificial Intelligence, EV, Machine Learning.
Abstract: The quick advancement of Electric Cars (EVs) globally has sizable implications for consumers, the
surroundings, and the auto business enterprise. This study ambitions to are waiting for destiny EV income
tendencies via making use of device getting to know fashions—Linear Regression, Random Forest, and
Gradient Boosting—to a complete dataset from Kaggle masking global EV income from 2010 to 2024. The
dataset becomes meticulously preprocessed via filtering relevant parameters, coping with missing values,
normalization, and one-warm encoding of specific variables consisting of vicinity, mode, and powertrain.
Every model changed into education and evaluated the usage of advocate Squared errors (MSE) and the R² to
assess predictive overall performance. The consequences advocate that artificial intelligence-based ensemble
machine learning models like Random Forest and Gradient Boosting barely outperform Linear Regression,
accomplishing R² values of approximately 0.18 as compared to 0.08 for Linear Regression. No matter the
modest predictive power, those findings spotlight the complexity of modelling EV earnings developments
due to factors like insurance changes, monetary conditions, and technological advancements that might not
be absolutely captured in the dataset. The look at underscores the potential of the system gaining knowledge
of forecasting marketplace developments whilst emphasizing the need for superior feature engineering and
model tuning.
1 Introduction
Nowadays, Electrical Vehicles (EV) develop rapidly,
by observing their sales from all over the world (Sun,
2019; Sanguesa, 2021). Many households choose it as
the car to serve daily life, mainly because the energy
for EV is much cheaper than gasoline, about 70%
discount. Moreover, in the bigger view, it is not
harmful to the environment, by using electricity as
energy to run, much less CO2 emission than petrol
car. The researchers say average “lifetime” emissions
from electric cars are up to 70% lower than petrol cars
in countries like Sweden and France (where most
electricity comes from renewables and nuclear), and
around 30% lower in the UK (from BBC environment
analyst Roger Harrabin).
Recently, the policies in electric vehicles play
important roles in accelerating the selling and
adoption for EV, the incentives spread world widely,
such as tax rebates, subsidies, and grants, to make
EVs more affordable for consumers, in most
countries. For instance, in the United States, the
a
https://orcid.org/0009-0002-3963-3481
Inflation Reduction Act of 2022 introduced a crucial
tax credit for EV buyers. It significantly boosts the
EV sales figures. The global EV sales have surged,
with a record of 10 million units sold in 2023, there is
a 25% increase compared to previous year. The EV
sales are considered to continue expanding in the
future, the Analysts project that by 2025, EV sales
could account for 30% of all new cars globally. At
this time, Artificial Intelligence (AI) is a new popular
topic in technology (Hunt, 2014; Holmes, 2004), it
has a large new advanced development. AI has
several representative algorithms, such as random
forest, logistic regression and Gradient boosting. The
AI algorithms play important roles in many fields,
such as Chemistry, Biomedicine, especially in
Business analysis. In chemistry, for instance, like in
drug discovery, researchers use logistic regression
and random forests to predict the efficacy and toxicity
of new drug compounds, by analysing the chemical
properties and biological activities (Badwan, 2023).
In Biomedicine, especially in disease prediction,
Cui and C. G.
Forecasting Future EV Sales: A Comparative Study of Model Performance.
DOI: 10.5220/0013487700004619
In Proceedings of the 2nd International Conference on Data Analysis and Machine Learning (DAML 2024), pages 75-79
ISBN: 978-989-758-754-2
Copyright © 2025 by Paper published under CC license (CC BY-NC-ND 4.0)
75

machine learning algorithms such as random forest
are used to predict the disease outcome by using
patients’ data. For example, the algorithm is used to
predict disease recurrence by using patient genetic
and clinical data (Sumwiza, 2023). In Business
prediction, like Credit scoring, random forests are
used to create the credit scoring model by assessing
the likelihood of loan default based on customers’
financial history and transaction history (Zhou,
2023). This helps financial institutions to make
decisions. Moreover, in sales volume prediction, a
study used random forest to predict the retail sales,
which used historical sales data, promotional
activities and seasonal trending to make business
strategies and do management in the company. To
provide a clear overview of trends in EV sales for
more people, and to help more people to make
decisions on their choosing cars, this paper aims to
think about how the sales of EV will develop in the
future by modelling the approximate trends for it. The
dataset is found in Kaggle and processed by random
forest, gradient boosting and linear regression. Then,
the study compares three models’ properties to get
result figures. Finally, Experimental results
demonstrate the effectiveness of the methods.
2 METHOD
2.1 Dataset Preparation
This study got the dataset from Kaggle “Global EV
Sales: 2010-2024” by Patrick L Ford (Ford, 2024).
The dataset shows the EV sales situation from 2010
to 2024 all over the world, in every country and every
region. It contains 12,654 entries and includes 8
features: region, category, parameter, mode,
powertrain, year, unit, and value. The datasets are not
only about EV sales, but include various aspects of
EV adoption, such as market share and stock levels
across different regions and years.
To get the trends of EV sales, this study handles it
as a regression problem. The target feature here is
“value” in eight features corresponding to EV sales.
However, the dataset includes various parameters, so
it is important to filter the dataset and get relevant data
before starting to model the trends. The initial step is
to make the “parameter” just related to EV sales, also
“unit” (eg. Vehicles) just have absolute value rather
than percentages or other metrics.
Handling the missing value: Despite the fact that
the dataset seems to have entire entries, any missing
values were managed via either elimination of
incomplete facts or imputation the usage of statistical
techniques along with imply or median imputation.
This step changed into essential to ensure the dataset's
integrity before similarly processing.
Normalization: Given the wide variety of values
inside the dataset, in particular in the value column,
normalization becomes implemented to scale the
features, ensuring that everyone variable contributes
proportionately to the model's predictions. This step
is vital in stopping features with larger scales from
dominating the model training procedure.
Categorical Encoding: The dataset consists of
numerous categorical variables, such as region,
category, mode, and powertrain. These have been
transformed into numerical form using one-hot
encoding, a way that creates binary columns for every
class, permitting the machine getting to know
algorithms to interpret these functions efficiently.
Train-Test Split: to assess the version's
performance correctly, the dataset changed into
divided right into a training set and a take a look at
set, with 70% of the statistics allotted for schooling
and 30% reserved for trying out. This division
guarantees that the model can generalize well to
unseen records, thereby imparting reliable
predictions.
2.2 Machine Learning-based Prediction
This study used linear regression, random forest and
gradient boosting to model the trend about EV sales,
by writing codes for each model, inserting the data
after filtering the dataset to each model. Finally, this
paper used Mean square errors (MSE) and Coefficient
of Determination (R-squared) to compare each model
and figure out their relationship.
2.2.1 Linear Regression
Linear Regression is a broadly used statistical
technique that fashions the relationship among a
structured variable and one or greater impartial
variables by means of becoming a linear equation to
the located facts (Su, 2012; Montgomery, 2021).
Linear Regression become used as a baseline version
to establish the fundamental relationship among the
functions (together with location, year, and
powertrain) and the target variable (EV sales). The
model was carried out the usage of the sklearn library,
and its performance turned into evaluated the use of
R-squared and MSE, which degree the accuracy of
the model's predictions.
𝑦 = 𝛽0 + 𝛽1𝑋 + 𝜖 (1)
DAML 2024 - International Conference on Data Analysis and Machine Learning
76
y is the dependent variable (the outcome this study
is trying to predict, e.g., EV sales). X is the
independent variable (the predictor, e.g., year). β0 is
the intercept (the value of y when X=0). β1 is the
slope (the change in y for a one-unit change in X). ϵ
is the error term (the difference between the actual
and predicted values).
2.2.2 Gradient Boosting
Gradient Boosting is a sophisticated ensemble
technique that builds models in a sequential manner,
with each subsequent version focusing on correcting
the mistakes made by means of the previous ones.
This iterative method lets in the Gradient Boosting
version to capture complicated patterns and
interactions within the records, making it especially
well-proper for tasks in which the relationship among
functions is nonlinear. in this study, Gradient
Boosting was implemented the use of the sklearn
library, with cautious tuning of hyperparameters to
optimize model performance.
2.2.3 Random forest
Random forest is any other ensemble learning
technique that constructs a couple of decision trees in
the course of the schooling technique and outputs the
mean prediction of the individual trees (Biau, 2016).
This approach is robust to overfitting and performs
nicely with massive datasets and high-dimensional
capabilities. The Random Forest version was applied
to the use of the sklearn library, with key
hyperparameters, such as the wide variety of trees and
the intensity of each tree, adjusted to enhance the
model's predictive abilities.
3 RESULTS AND DISCUSSION
This study compared the performance of three
different machine learning models, linear regression,
random forest and gradient boosting. Each model has
a different outcome and effectiveness in predicting
future EV sales trends. The metrics to evaluate each
model are MSE and R square, both of them give
insights into both the accuracy of the predictions and
the ability of the models to explain the variance in the
dataset.
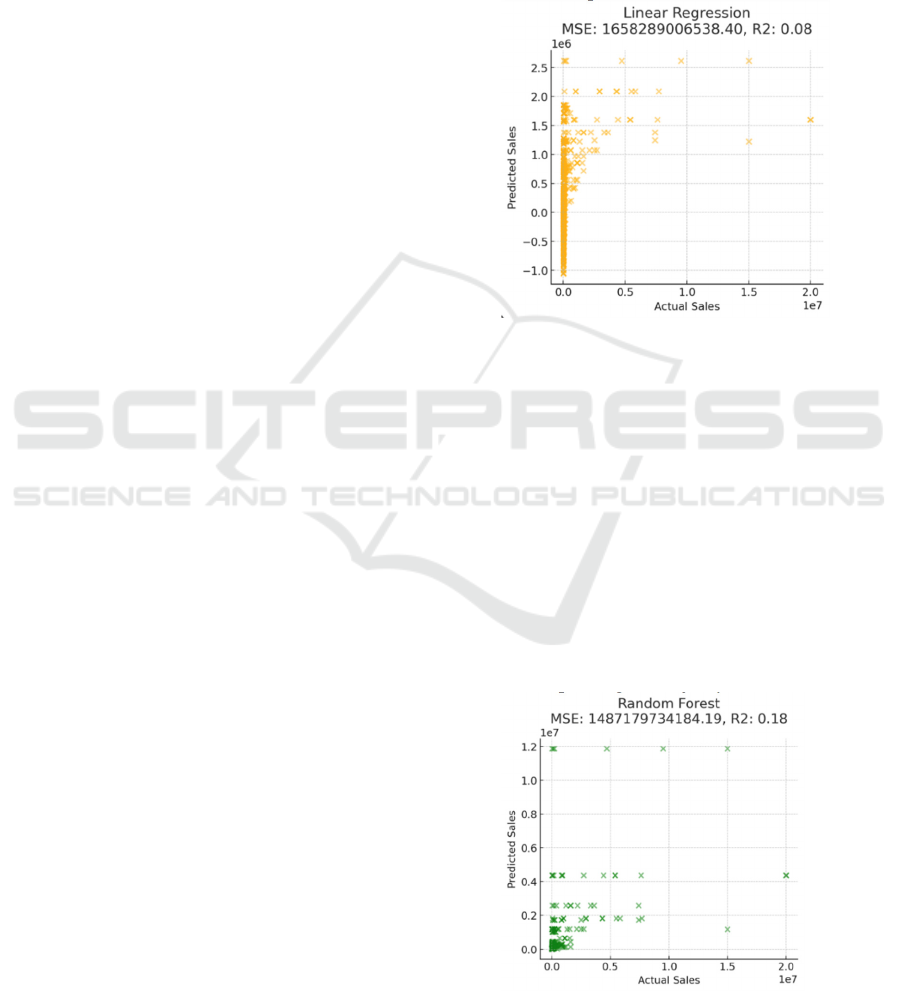
Results for linear regression: The Linear
Regression model, used as a baseline for this study,
produced an MSE of approximately 1.48718e+12 and
an R² value of 0.08 shown in Figure 1. The low R²
value indicates that the handiest 8% of the variance in
EV income is explained via the linear dating among
the capabilities and the target variable. At the same
time as Linear Regression is often powerful for less
complicated, linear relationships, it struggles with
complicated and nonlinear styles, as seen in this
example. Given the fantastically low performance,
it’s obvious that EV income traits are encouraged
through a range of nonlinear elements that this model
is unable to capture.
Figure 1: The performance of the linear regression
(Photo/Picture credit: Original).
Random forest effects: The random forest version
finished with an MSE of approximately 1.48486e+12
and an R² value of 0.18 shown in Figure 2. While the
MSE is barely decreasing than Linear Regression, the
R² value indicates a modest development, explaining
18% of the variance in EV sales. Random forest,
being an ensemble gaining knowledge of technique,
has the benefit of reducing overfitting and taking
pictures of extra complex relationships in the
information. This model performs higher because of
its capacity to manage high-dimensional features and
interactions among variables, but nonetheless falls
short of explaining the majority of the variance.
Figure 2: The performance of the random forest
(Photo/Picture credit: Original)
Forecasting Future EV Sales: A Comparative Study of Model Performance
77
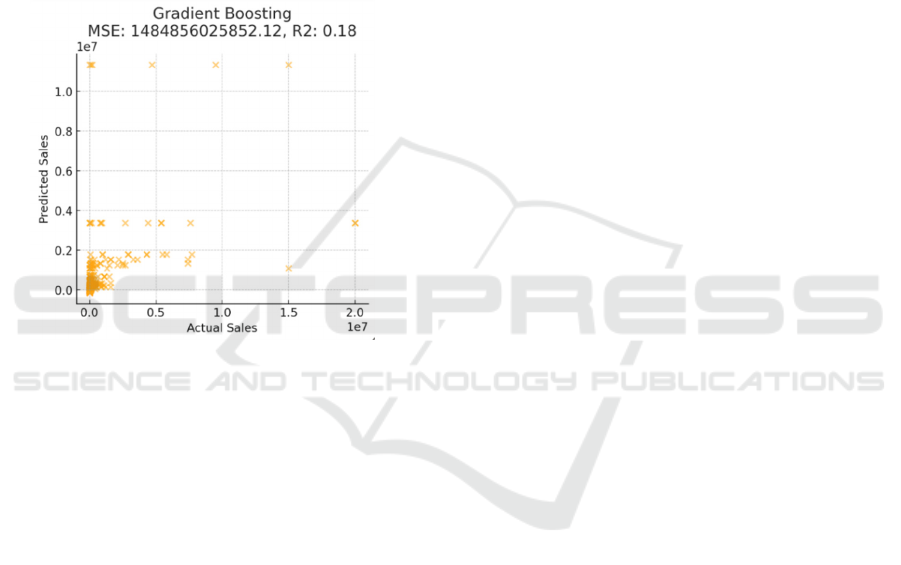
Results for gradient boosting: The Gradient
Boosting version produced consequences very just
like the Random Forest model, with an MSE of about
1.48718e+12 and an R² value of 0.18 shown in Figure
3. Gradient Boosting, which builds fashions
iteratively through correcting the errors of preceding
models, captures complicated patterns extra
efficiently than simpler models like Linear
Regression. However, in this example, the model’s
performance is nearly identical to that of Random
Forest, suggesting that both ensemble methods are
similarly capable of modelling the statistics at the
modern level of preprocessing and characteristic
selection.
Figure 3: The performance of the gradient boosting
(Photo/Picture credit: Original).
The general overall performance of the models
suggests that even as ensemble getting to know
methods like Random Forest and Gradient Boosting
are superior to Linear Regression for this challenge,
their predictive electricity stays restrained. several
factors may want to give an explanation for the
modest R² values. First, the dataset includes a
diffusion of express variables, along with areas and
powertrain types, which can require greater superior
characteristic engineering to absolutely capture their
relationships with EV sales. despite the fact that one-
hot encoding became used, interactions among those
capabilities might be greater complex than the
fashions currently capture.
Moreover, the dataset spans a couple of years and
areas, meaning that outside factors which include
government guidelines, economic conditions, and
technological improvements can also impact EV
sales. Those factors might not be completely
accounted for in the dataset, limiting the version's
capability to make correct predictions.
Furthermore, hyperparameter tuning could
enhance model performance. In this study, simple
variations of Random Forest and Gradient Boosting
had been used without full-size tuning of parameters
just like the range of trees or learning prices. in
addition, optimization ought to probably enhance
their accuracy. However, even without tuning, the
current results imply that ensemble strategies are
extra suitable for predicting nonlinear relationships in
EV income trends.
4 CONCLUSIONS
In conclusion, this look carried out 3 systems
studying fashions—Linear Regression, Random
Forest, and Gradient Boosting—to predict destiny EV
sales based on historical data. The effects show that
ensemble strategies, specifically Random Forest and
Gradient Boosting, perform better than Linear
Regression, albeit with modest predictive power as
indicated by using their R² values of 0.18. Those
consequences endorse that even as machine learning
can offer insights into EV sales tendencies, further
enhancements in function engineering, facts
preprocessing, and version tuning are necessary to
gain extra correct predictions. This takes a look at
underscores the importance of choosing appropriate
models for complicated, nonlinear datasets like the
ones involving EV sales, where several factors make
contributions to the traits.
REFERENCES
Badwan, B. A., Liaropoulos, G., Kyrodimos, E., Skaltsas,
D., Tsirigos, A., & Gorgoulis, V. G. 2023. Machine
learning approaches to predict drug efficacy and
toxicity in oncology. Cell Reports Methods, 3(2).
Biau, G., & Scornet, E. 2016. A random forest guided tour.
Test, 25, 197-227.
Ford, P. 2024. Global EV sales 2010-2024 [Data set].
Kaggle. Retrieved from
https://www.kaggle.com/datasets/patricklford/global-
ev-sales-2010-2024/data
Holmes, J., Sacchi, L., & Bellazzi, R. 2004. Artificial
intelligence in medicine. Annals of the Royal College
of Surgeons of England, 86, 334-338.
Hunt, E. B. 2014. Artificial intelligence. Academic Press.
Montgomery, D. C., Peck, E. A., & Vining, G. G. 2021.
Introduction to linear regression analysis. John Wiley
& Sons.
Sanguesa, J. A., Torres-Sanz, V., Garrido, P., Martinez, F.
J., & Marquez-Barja, J. M. 2021. A review on electric
DAML 2024 - International Conference on Data Analysis and Machine Learning
78

vehicles: Technologies and challenges. Smart Cities,
4(1), 372-404.
Su, X., Yan, X., & Tsai, C. L. 2012. Linear regression.
Wiley Interdisciplinary Reviews: Computational
Statistics, 4(3), 275-294.
Sumwiza, K., Twizere, C., Rushingabigwi, G.,
Bakunzibake, P., & Bamurigire, P. 2023. Enhanced
cardiovascular disease prediction model using random
forest algorithm. Informatics in Medicine Unlocked,
41, 101316.
Sun, X., Li, Z., Wang, X., & Li, C. 2019. Technology
development of electric vehicles: A review. Energies,
13(1), 90.
Zhou, Y., Shen, L., & Ballester, L. 2023. A two-stage credit
scoring model based on random forest: Evidence from
Chinese small firms. International Review of Financial
Analysis, 89, 102755.
Forecasting Future EV Sales: A Comparative Study of Model Performance
79
