
Advances in Artificial Intelligence for Stock Price Prediction: A
Comprehensive Investigation of Models and Applications
Tianai Chen
a
The Middle School Attached to Hebei Normal University, Shijiazhuang, Hebei, China
Keywords: Stock Price Prediction, Machine Learning, Artificial Intelligence.
Abstract: Traditional prediction models in stock price prediction are inefficient due to market changes. Artificial
Intelligence (AI) technologies have improved stock price forecast precision and adaptability. The steps in the
machine learning process are gathering and preparing data, training and testing sets, random forest machine
learning approaches, and deploying models for real-world applications. Regression and classification issues
are handled by employing strategies such as multivariate linear regression, decision trees, and random forests
to predict continuous target variables. Decision trees capture non-linear connections and are resistant to
outliers. In order to solve the vanishing gradient issue and beat conventional Recurrent Neural Networks
(RNNs) including audio recognition, time series forecasting, and handwriting identification, recurrent neural
networks with Long Short-Term Memory (LSTM) are employed. Deep learning algorithms are increasingly
replacing linear regression in AI stock price prediction due to complex nonlinear relationships in the market.
These models can process large amounts of data for pattern recognition and feature extraction, increasing
prediction accuracy. However, AI models face limitations such as not providing detailed explanations for
patterns, not being efficient for different stocks, and not considering external effects. Some advanced methods
such as expert systems and transfer learning could be considered to solve these limitations.
1 INTRODUCTION
Stocks are the main instrument used by investors in
the capital market; they are securities that symbolize
ownership in a corporation. Stock forecasting is
essential for investors looking for returns since price
changes in stocks are a reflection of market
expectations regarding a company's future prospects.
However, conventional stock prediction models have
limited accuracy because they are unable to quickly
adjust to changes in the market, even though they are
frequently based on financial theory. Recently, the
use of computer algorithms for stock price prediction
has advanced with the development of artificial
intelligence technologies. Artificial Intelligence (AI)
models can better capture the complex driving
reasons behind stock price volatility by extracting
characteristics and identifying patterns from massive
volumes of historical data. This improves prediction
accuracy and flexibility and gives investors more
useful decision assistance. Artificial intelligence is
anticipated to become increasingly integrated with
conventional financial models in the future, hence
a
https://orcid.org/0009-0001-1979-0087
enhancing its capacity to predict stocks and
expanding the opportunities available to investors.
Many distinct kinds of algorithms have evolved
over the course of artificial intelligence development.
Notable examples of these algorithms include
decision trees, neural networks, logistic regression
and linear regression. Numerous unique applications,
such as Generative Pre-Trained Transformers (GPT)-
3, Microsoft's You Only Look Once (YOLO),
Google's Image Classification, and OpenAI's Dota 2
Bot, have been built through the use of these well-
known techniques. A number of examples
demonstrate the ways in which advances in AI have
affected several facets of human civilization, from
biology and chemistry to medicine, with a great deal
of work being done especially in the financial sector.
For instance, Duan et al. examine pertinent papers to
pinpoint problems and obstacles related to AI for
decision-making in the big data era, suggesting
theoretical advancement and AI application (John,
2019). Tkáč et al. reviewed twenty years of research
on the use of artificial neural networks in business,
and they discovered that the majority of the papers
Chen and T.
Advances in Artificial Intelligence for Stock Price Prediction: A Comprehensive Investigation of Models and Applications.
DOI: 10.5220/0013487200004619
In Proceedings of the 2nd International Conference on Data Analysis and Machine Learning (DAML 2024), pages 51-55
ISBN: 978-989-758-754-2
Copyright © 2025 by Paper published under CC license (CC BY-NC-ND 4.0)
51

they looked at discussed expert systems in practical
settings (Michal, 2016). A review of the literature
from 2002 to 2013 by Côrte-Real et al. concentrated
on business intelligence in banking (Moro, 2015),
which employs certain AI algorithms for predictive
analysis. Last but not least, Business Intelligence and
Analytics (BI&A) implementation diffusion phases
are systematically mapped out by Côrte-Real, Ruivo
and Oliveira, who also suggest further study in the
then-largely ignored post-adoption stages (Tiago,
2014). Given the wide range of applications and rapid
expansion of artificial intelligence in this sector, a
comprehensive overview of this unique topic is
essential.
An extensive review of artificial intelligence
specifically applied to stock price prediction will be
given in this paper. First, popular techniques to stock
price prediction and pertinent findings from previous
research will be outlined by the author in the
methodologies section. The discussion part that
follows will provide a thorough analysis of the
benefits and drawbacks of the previously mentioned
techniques. In the concluding section, the author will
comprehensively summarize the study and discuss
the obstacles, limitations, and potential developments
in the particular domain of artificial intelligence for
stock price prediction.
2 METHOD
2.1 Introduction of the Machine
Learning Workflow
To get the desired outcome in the machine learning
process, a multitude of stages must be completed.
Typically, gathering data is the first of these phases.
Web scraping and the use of public databases are
common techniques for gathering related data. Web
scraping is the most popular technique, mostly used
to obtain data efficiently from large financial and
stock market websites. Data preparation, which may
entail controlling outliers, managing missing values,
and splitting the data into training and testing groups,
is probably going to happen once data collection is
finished. The next stage is using machine learning or
deep learning methods like random forest, to create
an appropriate model. The training and testing sets
created during data preprocessing will next be utilized
for training and testing the model. At last, if the error
value in the testing dataset is less than the threshold
established, deploying the model for real-world
application might be considered.
2.2 Multiple Linear Regression
A machine learning method called multiple linear
regression makes predictions about a continuous
target variable by taking into account a number of
independent factors. It is an expansion of the single-
independent-variable basic linear regression model.
The link between the target variable and the
independent variables is modeled by means of a linear
equation in the model. The objective is to use
techniques such as ordinary least squares to determine
the optimal regression coefficients. This method is
commonly used in engineering, social sciences,
economics, and finance to comprehend many
variables and create predictions.
In terms of the application of multiple linear
regression, it was used by Shakhla et al. to forecast
the price of APPLE INC.'s shares (Shakhla, 2018).
With the use of historical data from the Yahoo
Finance Developer Application Programming
Interface (API), a prediction model based on
NASDAQ (NDAQ) and Apple stock prices was
trained. For both equities, the data contained the day-
open price and day-high price of the stock. Panda's
Data-frame was used to preprocess the data,
eliminating Not A Number (NAN) values that would
have caused the data-frame to become inconsistent.
To get rid of duplicates and inconsistencies, the
values were forward-filled and backward-filled using
function related to filling null values.
2.3 Decision Tree
Regression and classification challenges can be
addressed by supervised learning algorithms called
decision trees. Representing characteristics or traits,
they are made up of a root node, internal nodes, and
leaf nodes. Recursive splitting of the dataset
according to the feature delivering the maximum
information gain or the lowest impurity is the method
used. Decision trees have several benefits, including
their ability to handle numerical and categorical
variables with ease, their resilience to outliers and
missing values, their ability to capture non-linear
correlations, and their attribute significance. Pruning,
regularization, and ensemble approaches are
frequently employed to enhance generalization
performance since they might be susceptible to
overfitting.
In order to forecast Indonesian stock prices during
the Covid-19 pandemic, Hindrayani et al. employed a
decision tree model (Hindrayani, 2020). Getting stock
prices, computing variables including net income,
liabilities, and total current assets, and figuring out
the closing daily stock price were all part of the
research process, presenting in Figure 1. A training
DAML 2024 - International Conference on Data Analysis and Machine Learning
52
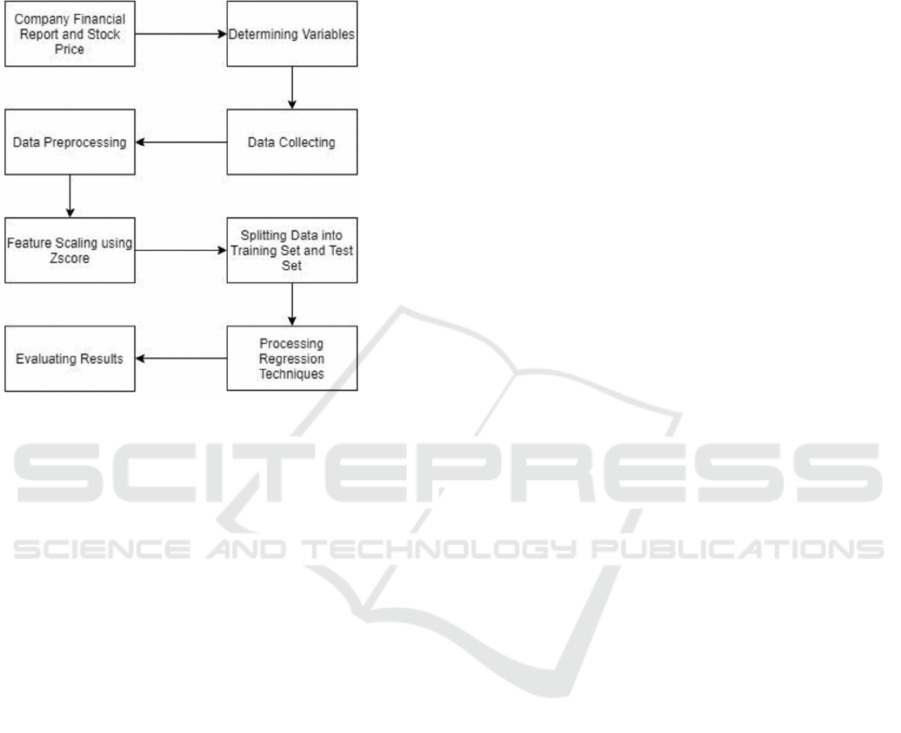
and test set of data were divided for regression
analysis, and the data was preprocessed and feature
scaled using Zscore. Multiple Linear Regression,
Support Vector Regression, Decision Tree
Regression, and K-Nearest Regression were used to
evaluate the robustness of the model.
Figure 1:
The framework of machine learning
(Hindrayani, 2020).
2.4 Random Forest
Random Forest is a potent ensemble learning method
for classification and regression. Bootstrapping,
feature subsampling, and ensemble prediction are
used to merge numerous decision trees. Enhancing
generalization performance, this produces a
heterogeneous ensemble of models. Prominent
benefits include elevated precision, resilience against
anomalies and interference, capacity to manage dual
duties, automated feature identification and
significance approximation, expandability to
substantial datasets, and effortless parallelization.
Owing to its robustness and adaptability, Random
Forest is extensively employed in a number of fields,
including as finance, healthcare, image identification,
and natural language processing.
Random forest was utilized by Khaidem et al. in
the past to forecast the direction of stock market
prices (Khaidem, 2016). The procedure entails
smoothing historical stock data exponentially to
eliminate noise or random variation, allowing the
model to detect long-term price patterns. These data
are compiled into feature matrices, from which
technical indications are generated. The two data
classes are examined for linear separability by
locating their convex hulls before to provide the
training data to the Random Forest Classifier. A
property of two sets of data points is called linear
separability, in which every point in one set is on one
side of a hyperplane and every point in the other set
lies on the other.
2.5 Long Short-Term Memory
A recurrent neural network design called Long Short-
Term Memory (LSTM) is used in deep learning to
overcome vanishing gradients in conventional
Recurrent Neural Networks (RNNs). Long-term
information retention memory cells, a gate structure
governing information flow, and gradient flow are
some of its primary characteristics. For applications
requiring sequential data, such handwriting
identification, natural language processing, time
series forecasting, and audio recognition, LSTM
networks are very helpful. They have proven to
perform better than conventional RNNs in a variety
of applications, which has led to their widespread
adoption as a prominent deep learning architecture.
LSTM was utilized by Lanbouri et al. to forecast
high frequency data (Lanbouri, 2020). Three phases
comprise the preprocessing approach: feature
development, feature scaling and normalization, and
data cleaning. Finding erroneous and absent values,
such as Missing Completely at Random (MCAR)
data, is the process of data cleansing. Value
imputation and instances discarding are two of the
techniques employed. Technical analysis, which
takes stock market history and indicators like Moving
Average and Moving Average Convergence
Divergence (MACD) into account, is a step in the
feature building process. Technical analysis uses
Bollinger bands, the MACD, and the Exponential
Moving Average (EMA) to determine when stock
values are turning. Adjusting overbought/oversold
asset signals takes directional movement shifts into
account.
3 DISCUSSION
In AI models that predict stock price fluctuations, the
deep learning algorithms are gradually taking the
place of some simple techniques such as linear
regression. This shift is the result of several different
factors. Among them, the most important of which is
the complex nonlinear relationships seen in the stock
market. Improved prediction accuracy can be
achieved by modeling these complicated dynamics
using deep learning models that include multi-layered
nonlinear transformations. Advances in computing
power and data collection capabilities also enable the
collection of extensive stock trading data. The deep
Advances in Artificial Intelligence for Stock Price Prediction: A Comprehensive Investigation of Models and Applications
53

learning models are more adepted at processing
massive amounts of data for pattern recognition and
feature extraction compared to the linear regression
model, which increases the accuracy of the
prediction, whereas the model of linear regression is
more susceptible to sample size limitations (Bao,
2017).
There are currently several distinct limitations
and challenges that are associated with using AI to
predict the value of a stock. One of those is that they
are not very adept at providing a detailed explanation
of why patterns occur. AI models are capable of
predicting prices that are similar. In addition, due to
the widespread use of relevant models, a trained
model for one stock may not be able to forecast
another efficiently; various stocks with different
related distributions may provide different results. A
further difficulty for stock prediction is that AI
models typically fail to take external effects into
account, despite the fact that these variables are often
the main cause of changes in market movements.
To address the aforementioned issues, several
methods can be applied. First, using expert systems,
Shapley Additive Explanations (SHAP), and Local
Interpretable Model-agnostic explanations (LIME)
can help enhance the interpretability of models. An
expert system is a knowledge-based AI system that
simulates expert decision-making, employing a
knowledge base, inference engine, and user interface
to provide clear reasoning and explainable results. A
technique based on game theory called SHAP
determines the relevance of a feature and provides
comprehensible feature contributions to the outcomes
of each prediction (Tsiotsios, 2014). By creating
simulated data and using it to train a basic model to
mimic local behavior, LIME is a local interpretable
model that clarifies black-box model predictions
(Ribeiro, 2016). To improve model interpretability
and increase the transparency and understandability
of prediction outputs, choose interpretable models,
add interpretability components to black-box models,
optimize the training process, and employ
visualization approaches. To overcome the problem
of trained models' limited applicability, the second
suggestion is to apply transfer learning. The process
entails integrating macroeconomic data into the stock
price prediction model or transferring an effective
prediction model created in related financial sectors
to improve the model's capacity for generalization
(Lundberg, 2017). The third point is to introduce
ongoing characteristics as part of the predictive data,
which can help enhance the timeliness of forecasts.
4 CONCLUSIONS
An extensive review of AI models used to forecast
stock prices has been established in this article,
including various algorithm and their differences.
Four distinct models are examined by the author:
decision trees model, random forests model, long
short-term memory model, and multiple linear
regression model. For individuals who are intrigued
by the topic of AI-driven stock price projections, it
provides pertinent resources and presents concepts
and models that can help with the understanding and
using of the models. The piece highlights the
developments in AI stock price prediction, addresses
problems that result from these forecasts, and
suggests possible fixes. The paper points out several
inadequacies in this field, despite the fact that AI
models supporting the growth of the financial
industry have seen substantial advancements. These
include the models' insufficient consideration of
external factors that can easily influence the prices of
the stock, poor interpretability, and low general
applicability of the models.
REFERENCES
Bao, W. J., & Rao, Y. Yue. 2017. A deep learning
framework for financial time series using stacked
autoencoders and long-short term memory. PLOS ONE.
https://doi.org/10.1371/journal.pone.0180944
Hindrayani, K. M., Fahrudin, M., Aji, R. P., & Tresna, E.
M. S. 2020. Indonesian stock price prediction including
COVID-19 era using decision tree regression.
International Seminar on Research of Information
Technology and Intelligent Systems (ISRITI), 344-347.
Hindrayani, K. M., Fahrudin, M., Aji, R. P., & Tresna, E.
M. S. 2020. Research methodology. Indonesia.
John, S., Duan, Y., & Yogesh, K. 2019. Artificial
intelligence for decision making in the era of Big Data
– evolution, challenges and research agenda.
International Journal of Information Management, 48,
63-71.
Khaidem, L., Saha, S. R., & Dey, S. 2016. Predicting the
direction of stock market prices. Applied Mathematical
Finance, 00(00), 1-20.
Lanbouri, Z., & S. A. 2020. Stock market prediction on high
frequency data using long-short. International
Workshop on Artificial Intelligence & Internet of
Things (A2IoT), 603-608.
Lundberg, S. M., & Lee, S.-I. 2017. A unified approach to
interpreting model predictions. Advances in Neural
Information Processing Systems 30.
Michal, T., & Robert, V. 2016 Jan. Artificial neural
networks in business: Two decades of research. Applied
Soft Computing, 38, 788-804.
DAML 2024 - International Conference on Data Analysis and Machine Learning
54

Moro, S., Rita, P., & Cortez, P. 2015. Business intelligence
in banking: A literature analysis from 2002 to 2013
using text mining and latent Dirichlet allocation. Expert
Systems with Applications, 42(3), 1314-1324.
Ribeiro, M. T., Singh, S., & Guestrin, C. 2016. Why should
I trust you? Explaining the predictions of any classifier.
Proceedings of the 22nd ACM SIGKDD International
Conference on Knowledge Discovery and Data Mining.
New York, NY: Association for Computing Machinery.
Shakhla, S., & B. S. 2018. Stock price trend prediction
using multiple linear regression. International Journal
of Engineering Science Invention (IJESI), 7(10), 29-33.
Tiago, O., Pedro, R., & Nadine, C.-R. 2014. The diffusion
stages of business intelligence & analytics (BI&A): A
systematic mapping study. Procedia Technology, 16,
172-179.
Tsiotsios, M., Angelopoulou, M. E., Kim, T.-K., Davison,
A. J., & Chourmouzios, A. 2014. Backscatter
compensated photometric stereo with 3 sources. 2014
IEEE Conference on Computer Vision and Pattern
Recognition, 2259-2266.
Advances in Artificial Intelligence for Stock Price Prediction: A Comprehensive Investigation of Models and Applications
55
