
Elderly Fall Detection Based on YOLO and Pose Estimation
Zhihan Ye
Faculty of Computing, Harbin Institute of Technology, Harbin City, Heilongjiang Province, 150006, China
Keywords: Fall Detection, YOLO, Pose Estimation, Population Aging.
Abstract: Aiming at the increasing risk of falls in the elderly, a fall detection method based on You Only Look Once
(YOLO) and Pose Estimation is proposed. The wearable and non-wearable fall detection methods are
reviewed. This paper selects a fast and accurate target detection algorithm YOLO. The fall detection data set
was used to compare different versions of YOLO (YOLOv5, YOLOv6 and YOLOv8), and finally the
accuracy and speed of YOLOv8 were selected. In order to distinguish between falling and lying down,
YOLOv8 and Pose Estimation (YOLOv8-Pose) are combined to track key points and motion patterns,
achieving a real-time fall detection accuracy of 92%. This method provides a reliable solution for elderly
health monitoring.
1 INTRODUCTION
The amount of elderly people worldwide is rising
quickly. The percentage of the population 65 and
older is predicted to increase from 10% in 2022 to
16% in 2050 (Chen, Ding, & Wang, 2023). Fall is one
of the major public health problems. About 28-35%
of people aged 65 and above fall every year. With the
increase of aging population, more and more people
will face the risk of falling. Falls in the elderly can
lead to serious health issues, including disability and
death. Even non-traumatic falls can cause anxiety,
depression, and reduced mobility, significantly
impacting quality of life (Xu, Ou, & Li, 2022).
Therefore, rapid fall detection can reduce these
risks. In this sense, a great deal of machine learning-
based research projects have been conducted in recent
years and can be broadly classified into two groups.
The first type relies on the use of wearable devices.
For example, Ishak uses smart phones to collect
sensor data such as accelerometers, gravity and
gyroscopes, and then processes machine learning
algorithms (Ishak, Habaebi, Yusoff, and Islam, 2021).
Although this method is very popular, the elderly
often forget to wear equipment, and there are
limitations in battery capacity. The second category
is non-wearable solutions. For example, Maitre used
ultra-wideband (UWB) radar and Convolutional
Neural Network - Long Short Term Memory (CNN-
LSTM) architecture for fall detection, but walls,
doors and furniture will reduce the quality of recorded
data (Maitre, Bouchard, and Gaboury, 2021).
Besides, Feng uses camera and attention guided Long
Short Term Memory (LSTM) for fall detection (Feng,
Gao, Wang, Zhao, Song, and Li, 2020).
In this study, YOLO was chosen to use, which is
popular and fast, and has a high accuracy rate, to
predict falls. First, fall data set was searched for the
relevant on Kaggle, and finally selected the Fall
Detection Dataset (Uttej Kumar Kandagatla, 2021)
with more data sets then other. After that, the data set
was tested on different versions of YOLO, and then
compared the accuracy and other indicators. Finally,
the most suitable YOLOv8n model is selected, and
the YOLOv8-Pose is added to improve the fall
detection algorithm, which distinguishes normal
lying down from falling to reduce the probability of
miscarriage of justice.
2 METHODS
2.1 Dataset
The dataset comes from Utej Kumar Kandagatla
(2021), which covers fall images collected from
various sources, including the most famous open
source dataset, the UR fall detection dataset (Kwolek,
and Kepski, 2014), and includes its custom fall
detection dataset. It contains two file directories
(images and labels). Two subdirectories are present in
the picture directory: val (111 images) is used for
10
Ye and Z.
Elderly Fall Detection Based on YOLO and Pose Estimation.
DOI: 10.5220/0013486500004619
In Proceedings of the 2nd International Conference on Data Analysis and Machine Learning (DAML 2024), pages 10-17
ISBN: 978-989-758-754-2
Copyright © 2025 by Paper published under CC license (CC BY-NC-ND 4.0)

validation and train (374 photos) is used for training.
Two subdirectories, train and val, which hold text
files with matching picture tags are also located in the
tag directory.
2.2 YOLO Architecture
YOLO is mainly composed of Backbone, Neck and
Head. The Backbone is in charge of taking
meaningful characteristics out of the input image,
which is often a Convolutional Neural Network
(CNN) that records hierarchical data at various sizes.
The Neck, which gathers and refines the features
extracted by the Backbone network, is the segment
that sits between the Head and the Backbone. Head is
responsible for target detection, including prediction
bounding box, category and confidence.
The YOLO algorithm's main concept is to convert
the target detection task into a regression issue by
utilizing the entire image as input and a neural
network to forecast the boundary box position and
classification. First, YOLO divides the input image
into a fixed size grid. For each grid, YOLO predicts a
fixed number of bounding boxes. Each bounding box
contains the position (center coordinates and width
and height) and confidence of the bounding box, as
well as the category of the target. A CNN is used to
carry out a single forward transfer and predict the
position and category of all bounding boxes at the
same time. YOLO uses multi task loss function to
train the network, including position loss, confidence
loss and category loss. In addition, in the predicted
bounding box, there may be multiple overlapping
boxes, and YOLO uses the Non-Maximum
Suppression (NMS) algorithm to screen the best
bounding box.
Three different YOLO for comparison were
chosen to use: YOLOv5, YOLOv6, and YOLOv8.
They have different improvements.
YOLOv5 (Chen, Ding, and Li, 2022) improves
upon YOLOv4 with enhancements like Mosaic
Augmentation, AutoAnchor box calculation, and
Channel-wise Spatial Pyramid Network (CSPNet) for
better efficiency and reduced computation, while
maintaining the Feature Pyramid Networks (FPN) +
Pyramid Attention Network (PAN) Neck structure.
YOLOv6 (Li, Li, Geng, Jiang, Cheng, Zhang, Ke, Xu,
and Chu, 2023) introduces scalable Backbone and
Neck designs with EffificientRep for small models
and CSPStackRep for larger ones, using an Anchor-
free paradigm and hybrid channel strategy to reduce
computational costs and improve accuracy. YOLOv8
(Jocher, Chaurasia, and Qiu, 2023) integrates CSPNet
with Darknet53, employs advanced activation
functions like SiLU, and optimizes feature extraction
and loss function computation for better performance
and edge deployment efficiency.
2.3 Pose Estimation
The YOLO training dataset alone cannot distinguish
between falling and lying down, making it difficult to
accurately detect falls in the elderly. To address this,
Pose Estimation is added to detect abnormal motion
patterns, as falls typically occur within 1.5 seconds
suggested by Lu, and Chu (2018). YOLOv8-Pose is
used for pose estimation, identifying key points of the
human skeleton. The study involves calculating
motion speed and angle to detect falls. If the hip or
shoulder speed exceeds a threshold, or if the torso
angle is below a certain level, a potential fall is
flagged. The time between the start and end of the fall
is then checked. If within the threshold, a fall is
confirmed.
3 RESULTS
3.1 Dataset Analysis Results
Because the same dataset is used, the output of labels
correlogram by different versions of YOLO are
similar. Here is a unified analysis.
For the histogram on the diagonal from Figure 1,
it can be seen that the histogram distribution of the X
and Y coordinates looks concentrated, which means
that most of the boundary boxes are concentrated in
the middle of the image. The histogram distribution
of width and height is relatively uniform, indicating
that objects with different scales are within the
detection range.
The scatter plot of X and width, Y and width from
Figure 1 shows a certain negative correlation, which
means that the objects in the middle area of the image
are usually larger (the width is larger), while the
objects at the edge may be smaller. The scatter plot of
X and height, Y and height from Figure 1 also showed
a similar trend, and there was a certain negative
correlation between height and position.
The relationship between the center points X and
Y from Figure 1 or Figure 2 illustrates the distribution
of the center of the bounding box in the image. The
points are mainly concentrated in the middle of the
image, which reflects that the detected objects mostly
appear in the central area of the image.
The scatter plot of width and height from Figure 1
or Figure 2 shows that there is a certain positive
Elderly Fall Detection Based on YOLO and Pose Estimation
11
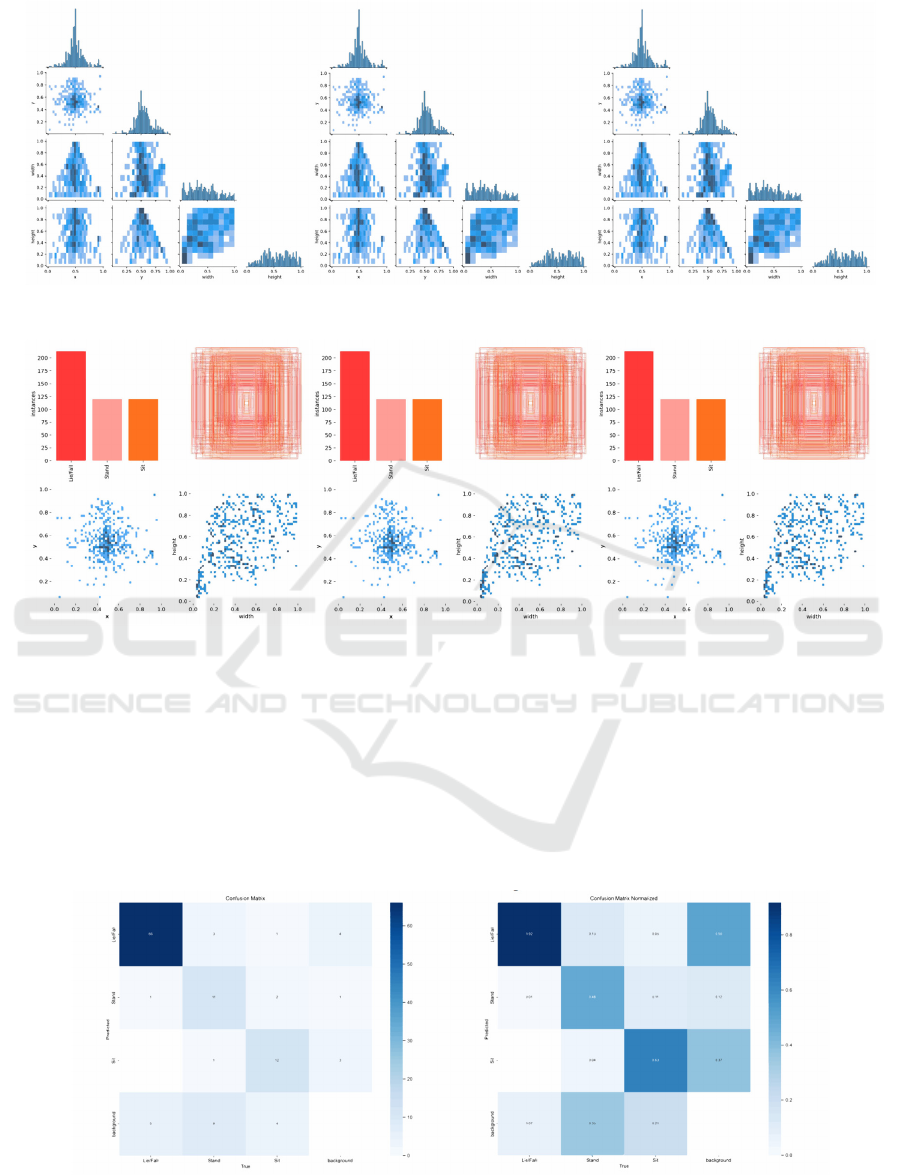
Figure 1: Labels Correlogram of YOLOv5, YOLOv6 and YOLOv8.
(Picture credit : Original)
Figure 2: Labels of YOLOv5, YOLOv6 and YOLOv8. (Picture credit : Original)
correlation between them, that is, the width and
height change in proportion.
3.2 Comparison Results of Different
Versions of Yolo
3.2.1 Confusion Matrix Results
Through the Confusion Matrix and Confusion Matrix
Normalized from Figure 3 to Figure 5, the errors
made by different versions of YOLO models are
evident. YOLOv5 and YOLOv8 show fewer
confusions in predictions, with YOLOv8 almost not
confusing different classes, while YOLOv6
frequently confuses the two classes of Stand and
background, mistakenly recognizing Stand as the
background class.
Figure 3: Confusion Matrix & Confusion Matrix Normalized of YOLOv5. (Picture credit : Original)
DAML 2024 - International Conference on Data Analysis and Machine Learning
12
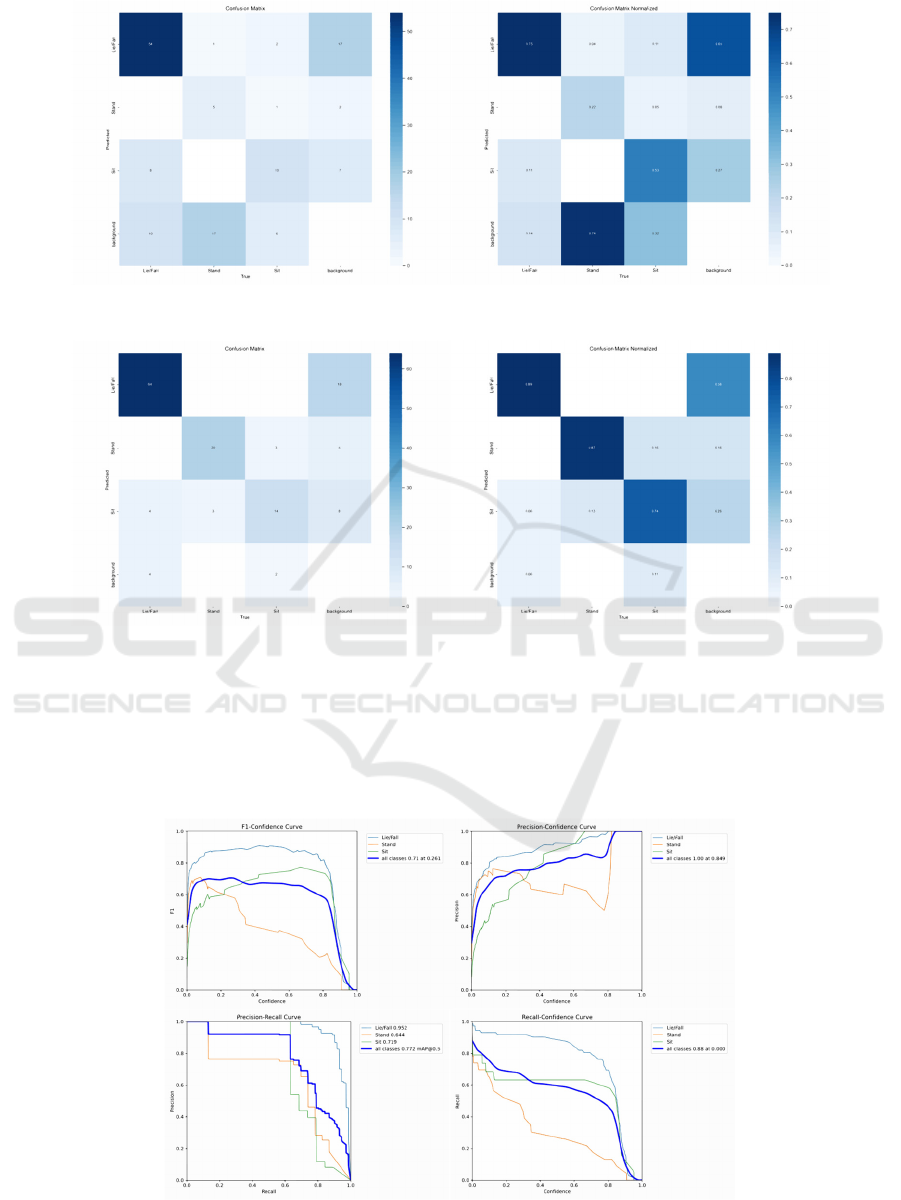
Figure 4: Confusion Matrix & Confusion Matrix Normalized of YOLOv6. (Picture credit : Original)
Figure 5: Confusion Matrix & Confusion Matrix Normalized of YOLOv8. (Picture credit : Original)
3.2.2 Curve Results
The F1-Confidence curve from Figure 6 to Figure 8
indicates that the best F1 scores for YOLOv5,
YOLOv6, and YOLOv8 occur at confidence levels of
0.261, 0.515, and 0.550, respectively, corresponding
to F1 scores of 0.71, 0.50, and 0.79. The Precision-
Recall curve shows that all categories of YOLOv6
exhibits a steep decline in precision with increasing
recall, while YOLOv5 and YOLOv8 maintain more
stable Precision and Recall, except for a rapid
decrease in Precision for the Sit.
Figure 6: F1-Confidence, Precision-Confidence, Precision-Recall, Recall-Confidence Curve of YOLOv5. (Picture credit :
Original)
Elderly Fall Detection Based on YOLO and Pose Estimation
13
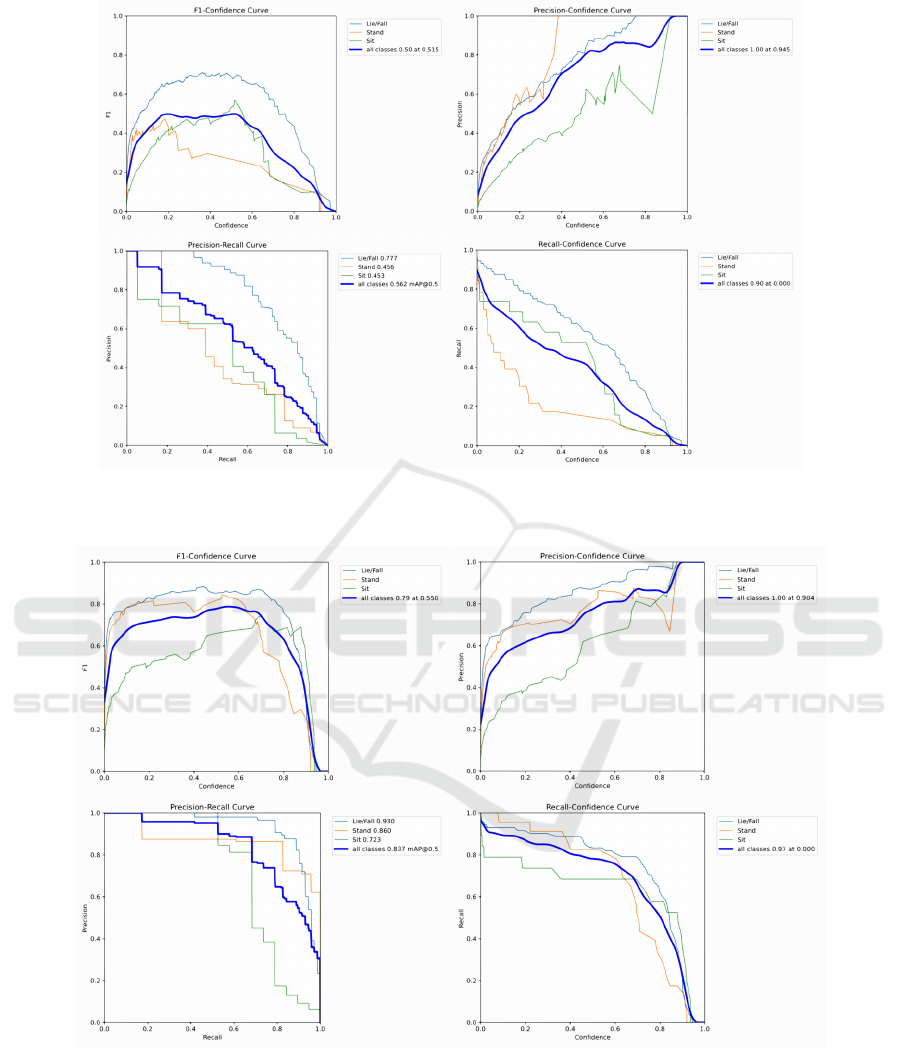
Figure 7: F1-Confidence, Precision-Confidence, Precision-Recall, Recall-Confidence Curve of YOLOv6. (Picture credit :
Original)
Figure 8: F1-Confidence, Precision-Confidence, Precision-Recall, Recall-Confidence Curve of YOLOv8. (Picture credit :
Original)
3.2.3 Results of Various Indicators
From the box_loss curve, obj_loss curve, and cls_loss
curve obtained from the training and validation sets
in Figure 9, it is evident that YOLOv6 is the model
with the most inaccurate positioning, the most
inaccurate ability to identify the target, and the most
inaccurate classification. Even in the validation
DAML 2024 - International Conference on Data Analysis and Machine Learning
14
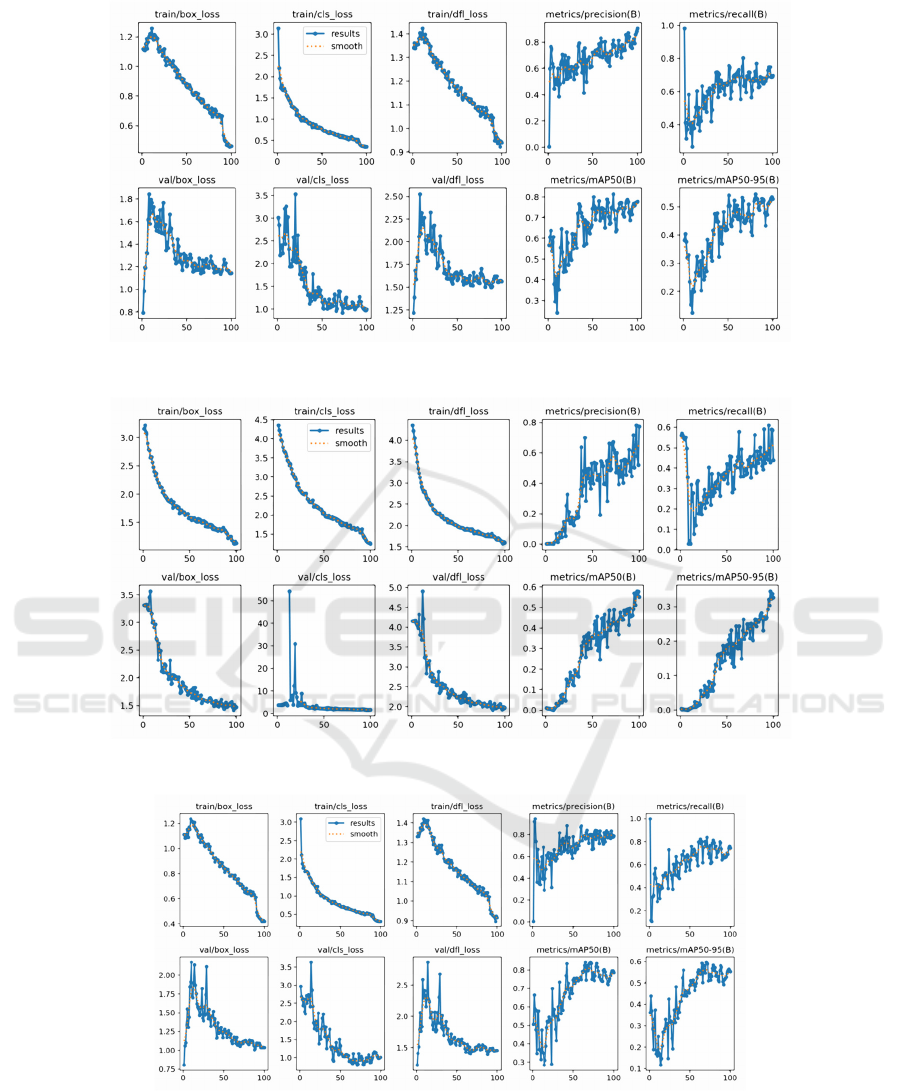
Figure 9: Results of YOLOv5. (Picture credit : Original)
Figure 10: Results of YOLOv6(Picture credit : Original)
Figure 11: Results of YOLOv8(Picture credit : Original)
set, the cls_loss curve is almost always near 0.
However, there is no significant difference between
YOLOv5 and YOLOv8 from Figure 10 to Figure 11,
but the minimum box_loss of YOLOv8 is the most
accurate positioning, the minimum obj_loss is the
most accurate to determine the ability of the target,
and the minimum cls_loss is the most accurate
classification.
Elderly Fall Detection Based on YOLO and Pose Estimation
15
3.2.4 Results Table
For Precision (P), Recall (R), mAP50, and mAP50-
95 from Table 1 to Table 3, YOLOv6 performs worst,
while YOLOv5 and YOLOv8 have little difference.
In addition, the model parameters trained by
YOLOv5 are the minimum, and the number of
floating-point operations required to process an
image is the minimum. The training model of
YOLOv8 is similar to that of YOLOv5 in preprocess
per image, influence per image and postprocess per
image. The model trained in YOLOv6 has the largest
number of parameters and floating-point operations,
and long time for preprocess per image, influence per
image and postprocess per image.
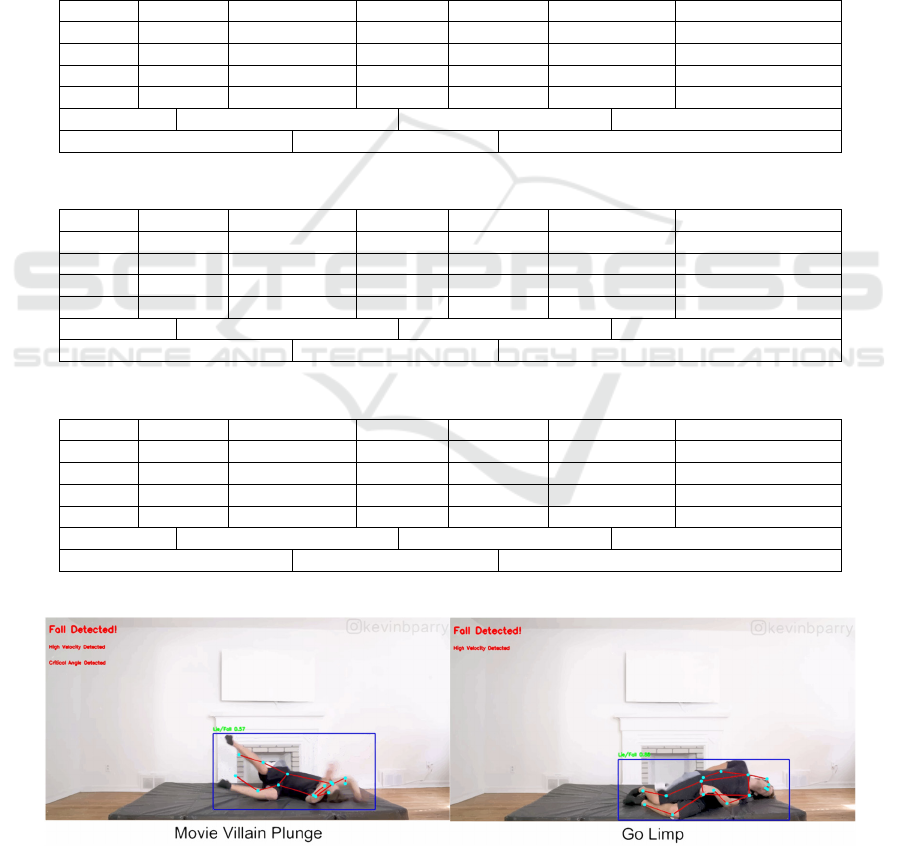
3.3
YOLOV8
+ Pose Estimation
YOLOv8 was chosen for fall detection due to its
strong performance indicators, supplemented by Pose
Estimation using YOLOv8-Pose and the yolov8x-
pose-p6.pt weight file. Testing was conducted on the
50 Ways to Fall video uploaded by Kevin Parry,
achieving a final accuracy of 92%. Figure 12 shows
the results of part of the test.
Table 1: Results of YOLOv5
Class Ima
g
es Instances P R mAP50 mAP50-95
all 111 114 0.75 0.68 0.772 0.545
Lie/Fall 72 72 0.851 0.917 0.952 0.664
Stan
d
22 23 0.739 0.492 0.644 0.426
Sit 19 19 0.66 0.632 0.719 0.544
S
p
eed 0.2ms
p
re
p
rocess
p
er ima
g
e 1.5ms inference
p
er ima
g
e0.9ms
p
ost
p
rocess
p
er ima
g
e
193 la
y
ers 193 la
y
ers 2503529
p
arameters
Table 2: Results of YOLOv6
Class Images Instances P R mAP50 mAP50-95
all 111 114 0.781 0.428 0.562 0.345
Lie/Fall 72 72 0.813 0.602 0.777 0.481
Stan
d
22 23 1 0.155 0.456 0.25
Sit 19 19 0.532 0.526 0.453 0.305
Speed 0.3ms preprocess per image 1.3ms inference per image 1.3ms postprocess per image
142 layers 4234041 parameters 11.8 GFLOPs
Table 3: Results of YOLOv8
Class Ima
g
es Instances P R mAP50 mAP50-95
all 111 114 0.805 0.77 0.837 0.597
Lie/Fall 72 72 0.896 0.819 0.93 0.669
Stan
d
22 23 0.861 0.806 0.86 0.555
Sit 19 19 0.658 0.684 0.723 0.567
Speed 0.2ms preprocess per image 1.5ms inference per image 1.0ms postprocess per image
168 la
y
ers 3006233
p
arameters 8.1 GFLOPs
Figure 12: YOLOv8 + Pose estimation fall detection some results (Picture credit : Original)
DAML 2024 - International Conference on Data Analysis and Machine Learning
16

4 CONCLUSIONS
The analysis shows that the YOLO version produces
similar label correlation diagrams due to the use of
the same dataset, the bounding box is concentrated in
the center of the image, the object size is negatively
correlated with the position, and the width is
positively correlated with the height. The analysis
reveals that YOLOv8 has the best performance with
minimal class confusion and highest F1 scores, while
YOLOv6 performs the worst with frequent errors and
inefficiencies, and YOLOv5 has the smallest model
size and computational requirements. According to
the final results, the elderly fall detection based on
YOLO and Pose Estimation has a high accuracy and
is very reliable.
For future research work, because YOLO is a
small and effective algorithm invented for faster and
more accurate industrial application, it can also
transplant the code to Raspberry Pi in the future, or
even make a car that can automatically follow elder
for fall detection, so as to achieve a fully intelligent
practical application.
REFERENCES
Chen, C., Ding, S., & Wang, J. (2023). Digital health for
aging populations. Nature medicine, 29(7), 1623–1630.
Chen, T., Ding, Z., and Li, B. (2022). Elderly fall
detection based on improved yolov5s network. IEEE
Access, 10:91273–91282.
Feng, Q., Gao, C., Wang, L., Zhao, Y., Song, T., and Li,
Q. (2020). Spatio-temporal fall event detection in
complex scenes using attention guided lstm. Pattern
Recognition Letters, 130:242–249. Image/Video
Understanding and Analysis (IUVA).
Ishak, A. N., Habaebi, M. H., Yusoff, S. H., and Islam, M.
R. (2021). Wearable based-sensor fall detection
system using machine learning algorithm. In 2021 8th
International Conference on Computer and
Communication Engineering (ICCCE), pages 53–57.
Jocher, G., Chaurasia, A., and Qiu, J. (2023). Ultralytics
yolov8.
Kwolek, B. and Kepski, M. (2014). Human fall detection
on embedded platform using depth maps and wireless
accelerometer. Computer Methods and Programs in
Biomedicine, 117(3):489–501.
Li, C., Li, L., Geng, Y., Jiang, H., Cheng, M., Zhang, B.,
Ke, Z., Xu, X., and Chu, X. (2023). Yolov6 v3.0:A
full-scale reloading.
Lu, K.-L. and Chu, E. T.-H. (2018). An image-based fall
detection system for the elderly. Applied Sciences,
8(10).
Maitre, J., Bouchard, K., and Gaboury, S. (2021). Fall
detection with uwb radars and cnn-lstm architecture.
IEEE Journal of Biomedical and Health Informatics,
25(4):1273–1283.
Uttej Kumar Kandagatla. (2021). Fall Detection Dataset
[Data set]. Kaggle.
Xu, Q., Ou, X., & Li, J. (2022). The risk of falls among
the aging population: A systematic review and meta-
analysis. Frontiers in public health, 10, 902599.
Elderly Fall Detection Based on YOLO and Pose Estimation
17
