
Exploring the Influence of NACA0018 Airfoil Attack Angle on the
Airflow Characteristics Based on CFD
Hechong Chen
1a
,
Hao Mei
2b
and Guyu Yi
3c
1
School of Mechanical Science and Engineering, Huazhong University of Science and Technology, Wuhan, 430074, China
2
International Business School, Henan University, Kaifeng, 475004, China
3
Air Traffic Management, Civil Aviation University of China, Tianjin, 300300, China
Keywords: NACA0018, CFD, Turbulence Model, Attack Angle, Aerodynamic Characteristics.
Abstract: In order to explore the influence of aerodynamic characteristics on aircraft flight performance and analyze the
effect of attack angle on the aerodynamic performance of NACA0018 airfoil, numerical simulation of
NACA0018 airfoil has been established by using FLUENT software. Firstly, by comparing the results of
computational models and experimental values, the numerical boundary conditions and turbulence models
applicable to airfoil calculations were determined. Secondly, combined with the principle of lift improvement,
the pressure and velocity field of NACA0018 at 0 ° and 4 ° two attack angles were analyzed. The
experimental results show that increasing the attack angle can significantly improve the lift, that is, the lift of
the airfoil at a 4 ° attack angle is greater than that 0 °. This study provides a reference for wing design and
aerodynamic performance analysis, which can optimize wing shape and structure based on changes in attack
angles under different flying conditions. In the future, further research will be conducted on the matching
between wing attack angles and wing types, flap lengths, flap deflection angles during different flight stages,
in order to optimize the aircraft performance comprehensively.
1 INTRODUCTION
In recent years, with the advancement of high-
performance computers, computational fluid
dynamics (CFD) has become a core technology in the
field of aerospace research. Researchers have studied
the impact of aircraft lift on the aerodynamic
performance of wing profiles, as well as the design
and failure issues of aircraft lift devices, through
numerical simulation methods. The NACA0018
airfoil, as a classic airfoil, has become a standard
model for wing aerodynamics research due to its
simple geometric shape and wide application. Attack
angle(AoA) can improve wing lift within a certain
range to meet various flight requirements by
increasing lift to varying degrees through attack
angle, especially during take-off and climb phases
(Fan, Pang, and Liu, 2004). Therefore, it is very
significant to understand the NACA0018 airfoil
a
https://orcid.org/0009-0001-8965-1592
b
https://orcid.org/0009-0007-9317-4390
c
https://orcid.org/0009-0005-3566-0070
aerodynamic characteristics on aircraft controling
and wing designing.
As the attack angle increases, the air velocity
flowing through the wing will increase, the air
pressure will decrease, and the lift coefficient (CL)
will increase. When flying at a constant altitude, the
increase on CL indicates the decrease in required
ground speed. During take-off, the aircraft must
reach sufficient speed and attack angle conditions to
balance its lift and gravity. At the end of the ground
acceleration phase, the aircraft begins to lift its front
wheels. During this phase, it is necessary to maintain
acceleration and increase the attack angle to obtain
greater lift. The ground effect gradually decreases
until it leaves the ground (Airbus, 2002).
During level flight, lift and drag are balanced, and
the lift limit is reached when CL equals CLmax. At
this point, if the attack angle increases, stall will
occur. At high attack angles, the airflow separates
from the upper surface of the wing. If the attack angle
Chen, H., Mei, H. and Yi, G.
Exploring the Influence of NACA0018 Airfoil Attack Angle on the Airflow Characteristics Based on CFD.
DOI: 10.5220/0013444600004558
In Proceedings of the 1st International Conference on Modern Logistics and Supply Chain Management (MLSCM 2024), pages 497-504
ISBN: 978-989-758-738-2
Copyright © 2025 by Paper published under CC license (CC BY-NC-ND 4.0)
497
continues to increase, the separation point of the
airflow becomes unstable and rapidly fluctuates back
and forth. As a result, the pressure distribution
constantly changes and alters the position and
magnitude of lift. This effect is called chattering,
which manifests as intense vibrations. When AoA
reaches its maximum value, the separation point
moves further forward, and the airflow on the upper
surface achieves total separation. This phenomenon
leads to a significant loss of lift, known as stall
(Airbus, 2002).
Although attack angle technology has been
widely applied in aviation, simulation research on the
influence of different geometric parameters,
especially attack angle, on the aerodynamic
performance of airfoils is still relatively scarce. The
daily operation of large aircraft is related to the safety
of personnel and property, as well as the efficiency of
airlines. The refined design of aircraft components is
of great significance in ensuring that aircraft
manufacturing meets design and airworthiness
requirements. With the continuous development of
aviation technology, higher requirements have been
put forward for wing design (Wang Chunyan, 2023).
This study used the NACA0018 airfoil as the
research object. In the simulation environment, visual
flow fields were obtained under different
configurations by changing the attack angle. The
changes in lift, drag, and speed coefficients were
analyzed based on the exported data. This method
allows for the evaluation of the overall aerodynamic
performance of the wing under dynamic conditions,
providing a reference for aircraft design.
2 METHOD
2.1 Establishment of Geometric
Structure of Flow Field
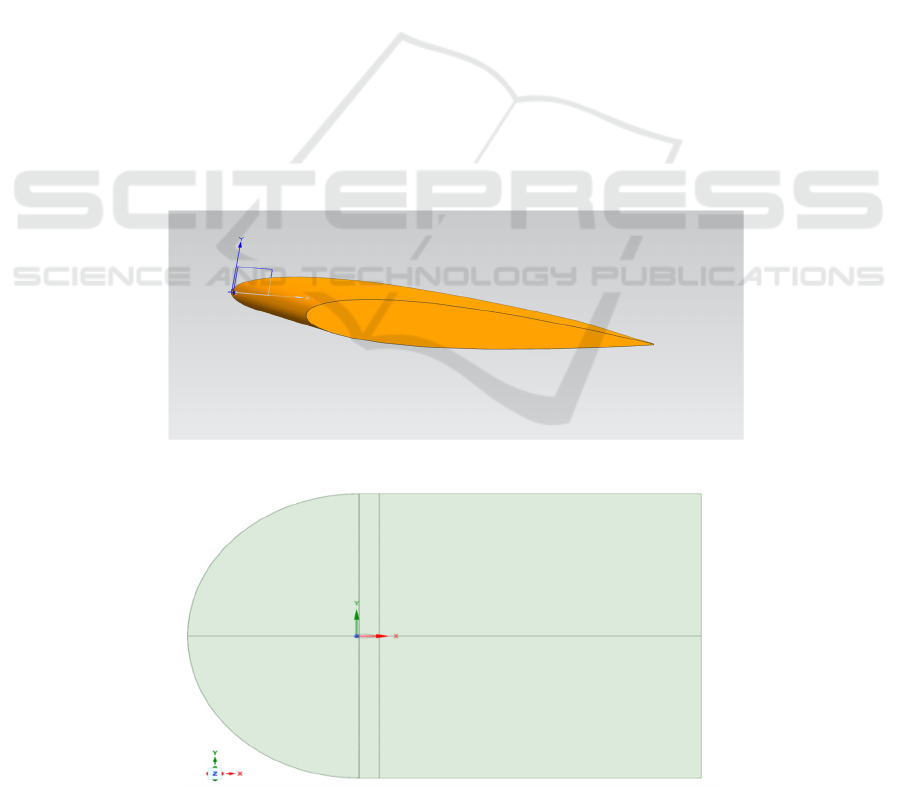
The basic airfoil studied in this paper is NACA 0018,
its chord length is set to 1000mm, and it is modeled
in ug, as shown in Figure 1.
To create the flow field model, use a benchmark
equal to 15 times the airfoil's chord length, that is, the
diameter of the C-type area and the side length of the
square area are 15000mm. From the front center of
the airfoil section, the center line extends 100mm
inward as the circle center of the C-type flow field,
and the line extends 15000mm towards the rear edge
as the axis to draw the square flow field area,as shown
in the Figure 2.
According to Figure 3, the hollow airfoil section
Figure 1: NACA 0018 3D model.
Figure 2: Flow field model.
MLSCM 2024 - International Conference on Modern Logistics and Supply Chain Management
498
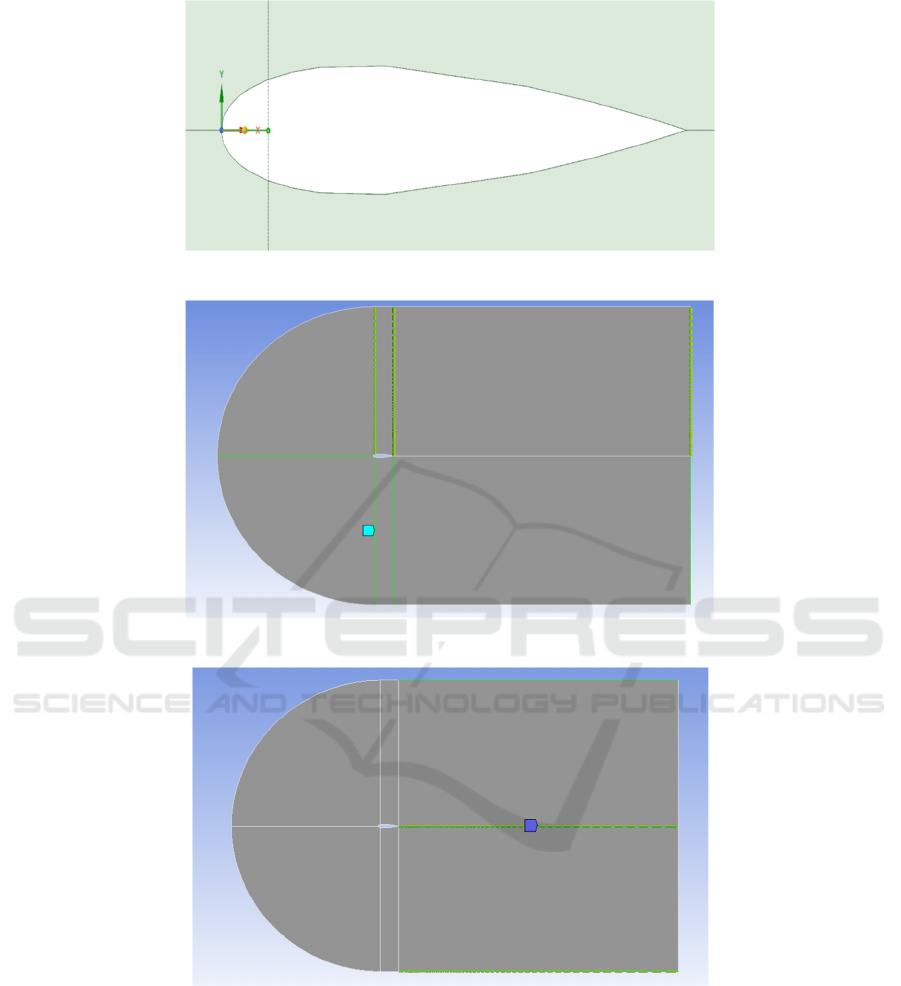
Figure 3: Flow field model details.
Figure 4: The first set of edge size adjustment.
Figure 5: Second set of edge sizing adjustments.
area serves as the boundary between the airfoil and
the flow field area. The whole flow field is divided
into six regions with the center of the C-shaped flow
field and the apex of the tail edge of the airfoil as the
boundary (Apostol E I, Țîțu A M, 2023).
2.2 Grid Division
The boundary of each region of the flow field is
dimensioned in order to achieve a finer meshing of the
area near the airfoil surface. The boundary of the
region is named after the overall direction of the
diverting field.
The six vertical lines and the horizontal lines that
meet the airfoil's leading edge are taken as the first
group for edge size adjustment,as shown in Figure 4.
As seen in Figure 5, there are 200 partitions, a 40000
bias factor, and bias in the vicinity of the airfoil's
Exploring the Influence of NACA0018 Airfoil Attack Angle on the Airflow Characteristics Based on CFD
499
surface. The second set of lines for adjusting edge
sizing is the three long horizontal lines that follow the
airfoil's rear edge, with the number of partitions of
200 and the bias factor of 40000, also biased towards
the area close to the airfoil surface,as shown in the
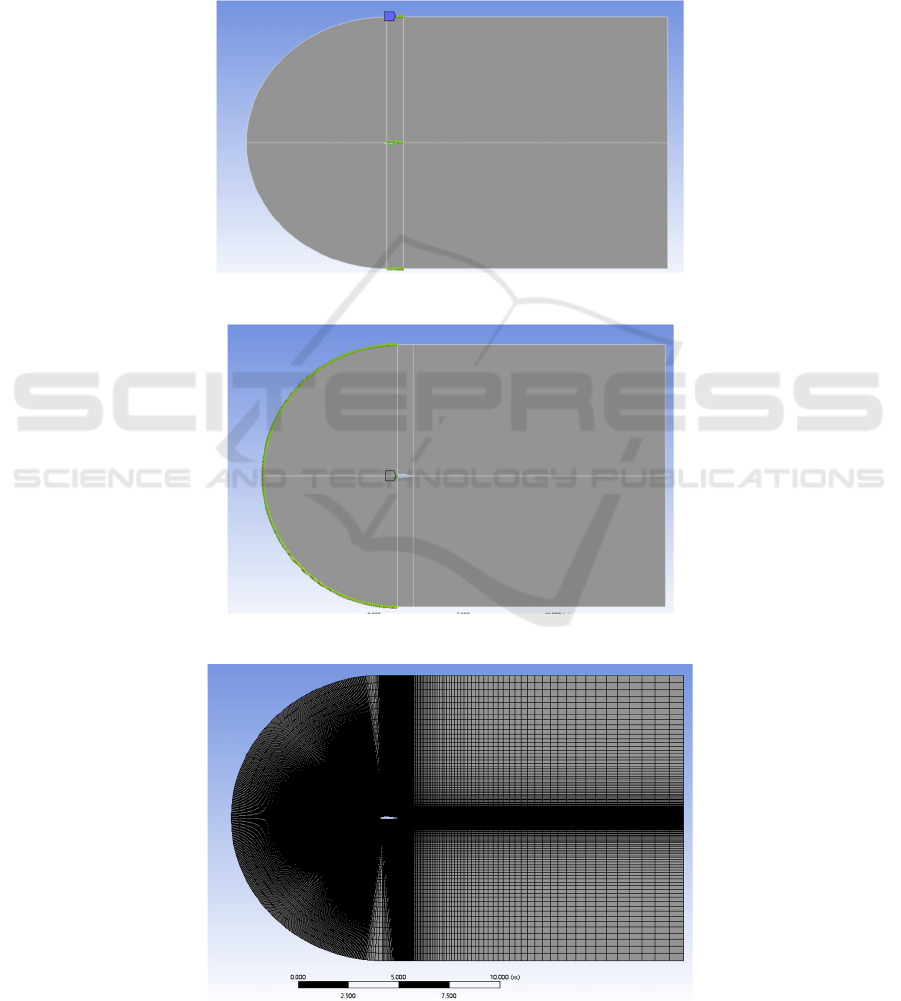
Figure 6. According to the Figure 7, the two trailing
edge curves of the airfoil along with the short
horizontal lines on either side are used as the third set
for edge sizing, with a number of partitions of 300 and
no bias. The fourth group for edge dimensional
adjustment consists of the two airfoil leading edge
curves and the two quarter arcs, with the number of
partitions being 300 and without bias. Finally, six
areas are selected for face grid division, and
quadrilateral grid structure is adopted (Kaya M N,
Kok A R, Kurt H, 2021).
Generate the final mesh division and specfic
details shown in the Figure 8 and Figure 9.
Figure 6: Third set of edge size adjustments.
Figure 7: Fourth set of edge size adjustments.
Figure 8: Grid division results.
MLSCM 2024 - International Conference on Modern Logistics and Supply Chain Management
500
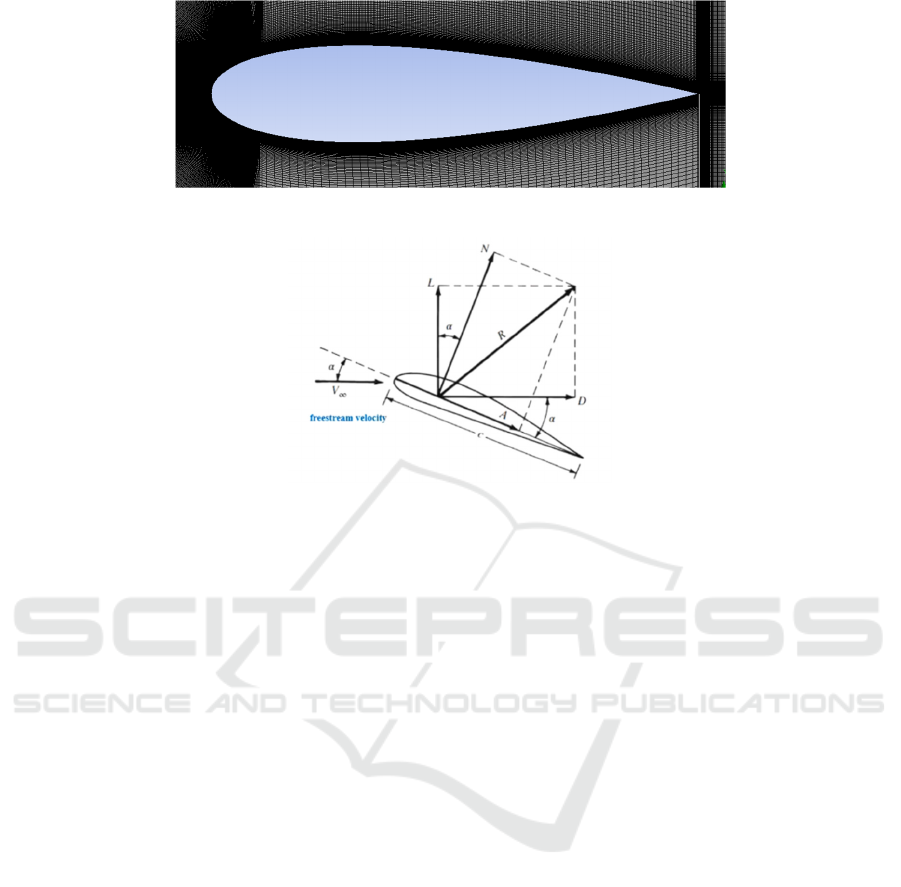
Figure 9: Grid division details.
Figure 10: The relationship between the Angle of attack and the lift and drag coefficients.
2.3 Experimental Setup
The solver used in the experiment adopts the pressure
base type, the velocity format is absolute velocity, and
the plane transient measurement does not consider the
influence of gravity. The viscous SST k-omega model
is used for the flow field model (Molaa A A,
Abdulwahid M A, 2024). Second-order upwind
format was used for the discrete equation format, and
the COUPLED method was chosen for the pressure-
velocity coupling. The fluid used to fill the flow field
is air with a density of 1.225kg/m
3
and a viscosity of
1.7894*10-5kg/(m · s). Working conditions
Atmospheric pressure is 101325Pa. Set the residual to
10-6 and the number of iterations to 1000.
Experiment with 0° Angle of attack first. In the
velocity inlet, choose the velocity definition method
of the Components, because the Angle of attack is 0,
so do not set the speed in the Y direction, set the speed
in the X direction to 33m/s, the concentration of
turbulence is 5% and the ratio of turbulence viscosity
is 10. The gauge pressure of the pressure outlet is 0.
Set the force vector directions for drag to 1 and 0
(corresponding vectors for X and Y, same below), and
the force vector directions for lift to 0 and 1,
respectively. Initialize and iterate the calculation to
get the result of the response.
Then experiment with 4ºangle of attack. Similar
setup, but due to the change of the Angle of attack,
the direction of the velocity and the direction of the
force vector of the lift resistance must be changed in
response. According to the relevant theoretical
knowledge, the relationship between the Angle of
attack and the lift force and the drag coefficient can
be obtained as seen in the Figure 10.
First of all, for the inlet velocity is changed.,as
shown in the figure 10, the velocity in X direction is
and the velocity in Y direction is (Li S, Li Y, Yang C,
et al, 2018).Therefore, the inlet velocity is changed to
32.93m/s in X direction and 2.31m/s in Y direction in
the setting of inlet velocity. Accordingly, according to
the results in the Figure 11, the direction of the force
vector of the resistance is set to 0.998 and 0.07, and
the direction of the force vector of the lift is set to -
0.07 and 0.998. The final result is obtained by
iterative calculation under such conditions.
3 EXPERIMENTAL RESULTS
The lift force, drag coefficient and corresponding
pressure and velocity cloud maps at 0° and 4°
attack angles were obtained through the experiment.
The first is the result of 0° angle of attack. As
shown in Figure 11, in the static pressure diagram, the
pressure distribution around the airfoil is basically
gentle and uniform. Two blue areas on the upper and
lower parts of the airfoil represent two low pressure
areas. Since they are symmetrical airfoil, the pressure
in the both parts of the airfoil is basically the same.
Exploring the Influence of NACA0018 Airfoil Attack Angle on the Airflow Characteristics Based on CFD
501
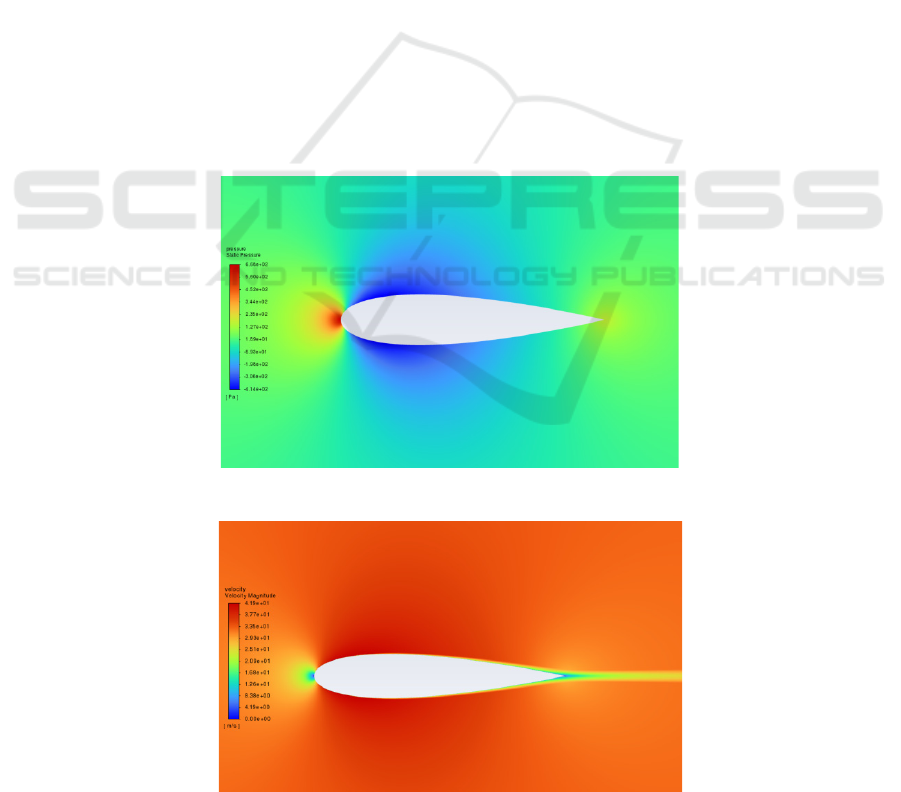
The leading edge's stagnation point has a high-
pressure area, and a slightly pressurized area is
formed in the back edge of the wing. In the velocity
distribution cloud diagram, as shown in Figure 12, the
velocity at the stagnation point of the leading edge is
very low, and a long wake is generated at the trailing
edge, while the velocity above and below the airfoil is
high (Sun X, Zhou D, 2022). At the position close to
the wall, the velocity is basically zero due to the
absence of external environmental conditions. The
distribution of the two images at 0ºangle of attack
corresponds closely to the theoretical distribution, and
the results of simulation are satisfactory.
The next is the simulation results at 4ºangle of
attack. According to Figure 13, the static pressure
diagram shows that the high pressure stagnation point
area moves down due to the presence of the attack
Angle.what’s more, an obvious low pressure area is
generated above the airfoil. Such results meet our
experimental expectations, that is to say, the lift force
of the airfoil is significantly improved under this
condition (compared with the condition of 0° attack
angle). Similarly, in the velocity distribution diagram,
as shown in Figure 14, it can be seen that the velocity
of the area above the wing is larger, while the
stagnation point area moves down, and the wake rises
slightly. The simulation results at an Angle of attack
of four degree show that the airfoil's lift increases,
which is in line with the experimental expectation,
and verifies the important influence of the attack
angle on the aerodynamic characteristics of the
airfoil. The experimental results show that different
angles of attack have significant effects on the
aerodynamic performance of airfoil, especially the
generation and distribution of lift. Designers can
optimize the wing shape and structure according to
the change of the angle of attack under different flight
conditions to improve aircraft performance in
different flight stages (Liu et al, 2022). For example,
a wing with a larger Angle of attack can be designed
during takeoff and landing phases to enhance lift,
while it can be optimized for a smaller angle of attack
to reduce drag during cruise phases. Studying the
pressure distribution and velocity field at different
attack angles can help design and optimize the shape
of the wing and improve the lift and aerodynamic
efficiency of the aircraft (Huang S, Hu Y, Wang Y,
2021). Through simulation, the performance of the
wing in different flight states can be predicted, so as
to optimize its shape and structural design.
Figure 11: 0ºpressure cloud image.
Figure 12: 0ºvelocity cloud image.
MLSCM 2024 - International Conference on Modern Logistics and Supply Chain Management
502
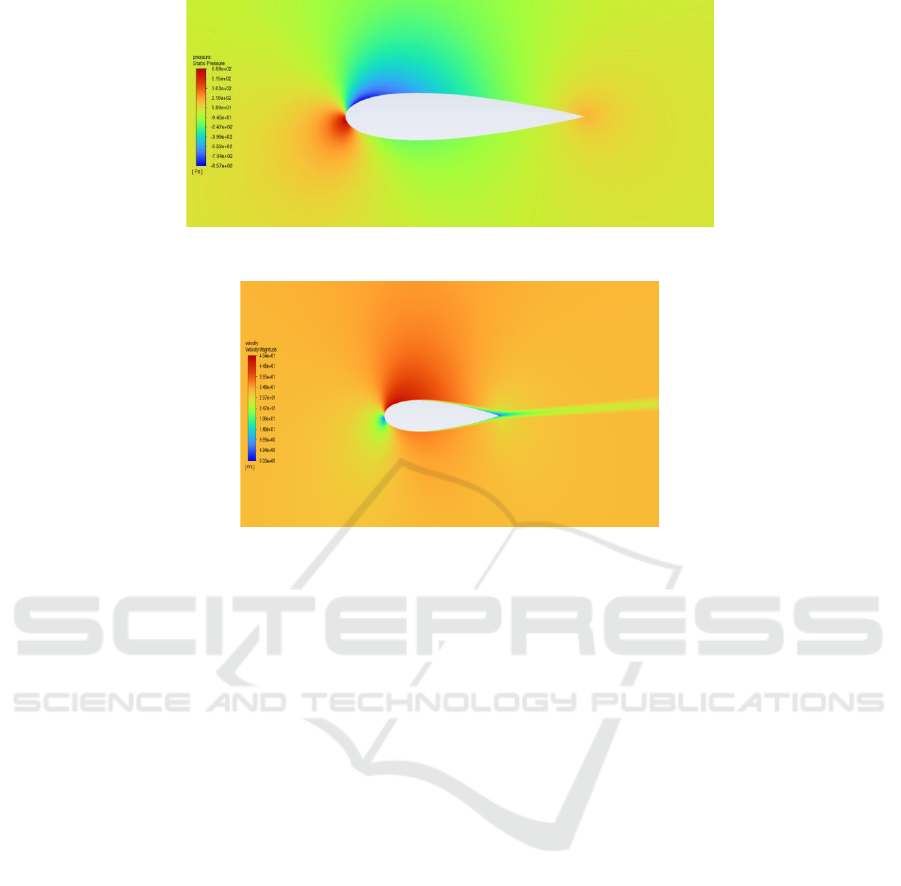
Figure 13: 0ºpressure cloud image.
Figure 14: 0ºvelocity cloud image.
4 CONCLUSION
In this paper,The NACA0018 airfoil's aerodynamic
performance at different angles of attack is analyzed
by means of computational fluid dynamics (CFD).
The experimental results show that, compared with 0
° attack angle, the lift of the wing at 4° attack angle
is improved, the velocity in the lower part of the wing
is reduced, and the pressure is increased. Such
analysis is not only a key theoretical understanding of
airfoil behavior, but also a practical design that helps
to optimize the performance of the wing in different
stages of flight, such as take-off, cruise and landing.
The results of this study will contribute to the wider
field of fluid dynamics and aerodynamics by
validating theoretical predictions and providing data
that can be used to improve computational models. In
addition, the findings will be directly applied to
improving aircraft performance through better wing
design, ultimately enabling more efficient and safer
flight operations.It is hoped that in the future, more
accurate CFD simulations will help designers better
understand the attack angle ’ s effect on lift and
optimize the design of the wing. Furthermore, It is
considered that Lift force and attack angle are non -
linear. In the future, the research on nonlinear
dynamics will be strengthened to improve wing
performance and achieve safer and more efficient
flight operations.
AUTHORS CONTRIBUTION
All the authors contributed equally and their names
were listed in alphabetical order.
REFERENCES
Airbus. 2002. Mastering aircraft performance. 43,
142. 35-36.
Apostol, E., I., Țîțu, A., M. 2023. CFD Simulation of
the Aerodynamic Characteristics of the NACA
0018 Symmetrical Profile. The International
Symposium for Production Research., 423-431.
Fan, J., Pang, Y., Liu, Zh. 1994-2024. NACA0012
airfoil Aerodynamic characteristics under
different flap deflection angles. Chinese Academic
Journal Electronic Press.
Huang, S., Hu, Y., Wang, Y. 2021. Research on
aerodynamic performance of a novel dolphin
head-shaped bionic airfoil. Energy, 214, 118179.
Kaya, M., N., Kok, A, R., Kurt, H. 2021. Comparison
of aerodynamic performances of various airfoils
Exploring the Influence of NACA0018 Airfoil Attack Angle on the Airflow Characteristics Based on CFD
503

from different airfoil families using CFD. Wind
and Structures, 32(3), 239-248.
Liu, Q., Miao, W., Bashir, M., et al. 2022.
Aerodynamic and aeroacoustic performance
assessment of a vertical axis wind turbine by
synergistic effect of blowing and suction. Energy
Conversion and Management, 271, 116289.
Li, S., Li, Y., Yang, C., et al. 2018. Design and testing
of a LUT airfoil for straight-bladed vertical axis
wind turbines. Applied Sciences, 8(11), 2266.
Molaa, A., A., Abdulwahid, M., A. 2024. Numerical
and experimental study of the impact on
aerodynamic characteristics of the NACA0012
airfoil. Open Engineering, 14(1), 20220506.
Sun, X., Zhou, D., 2022. Review of numerical and
experimental studies on flow characteristics
around a straight-bladed vertical axis wind turbine
and its performance enhancement strategies.
Archives of Computational Methods in
Engineering, 29(3),1839-1874.
Wang, Ch. 2023. Structural analysis and assembly
design of flaps for a certain type of aircraft. China
Science and Technology Information, 14, 38-41.
MLSCM 2024 - International Conference on Modern Logistics and Supply Chain Management
504
