
Optimization of Cold Chain Logistics Based on Dynamic Planning
Under Green Perspective
Yujie Ren
1a
, Guo Tang
2b
and Wenyue Zhou
3c
1
Reading Academy, Nanjing University of Information Science and Technology, Nanjing, 210044, China
2
College of Logistics and e-Commerce, Zhejiang Wanli University, Ningbo, 315100, China
3
College of Politics and Public Administration, Soochow University, Suzhou, 215127, China
Keywords: Cold-Chain Logistics, Path Optimization, Genetic Algorithm, Cost Analysis.
Abstract: This paper improves the solving effect of path optimization through ameliorate the traditional genetic
algorithm. As the optimization goal of the total cost of cold-chain distribution, with the constraint condition
of vehicle load capacity and customers’ requirement, build the optimal model. This research analyses the
influence of temperature and time on refrigeration cost and cargo damage cost, and applies exponential
function to describe the decay rule of fresh agricultural products. And this paper makes simulation experiment
in different strategy algorithm through improving the choosing strategy, crossover strategy and mutation
strategy in genetic algorithm, the result shows that improving strategy significantly impact the local solution
accuracy and convergence speed of algorithm. Thus, it effectively avoid to sink into the problem of local
optimum. This research provides a better plan of path optimization for distribution of cold-chain logistics. For
practical cases, this paper chooses Nanjing Weigang Dairy Co., Ltd and 15 residential quarters in Nanjing as
client site to analyse. In this case, through multiple runs to improve genetic algorithm, this paper gains a more
economic and more friendly-environment way to distribution, dramatically reduces the total cost and carbon-
dioxide emission, at the same time, also shortens the distribution time.
1 INTRODUCTION
With the improvement of economic growth and
residents’ life quality, the requirements of fresh
agricultural products increase daily, prompting the
quick development of cold-chain logistical industry
(Xu, 2021). Particularly, not only vehicles would
produce carbon emission, but also refrigerating
equipments are the important source of it. Facing the
global warming and the stress of carbon emission
reduction, optimizing the distribution path of cold-
chain logistics have become an urgent problem that
need to be solved.
Cold-chain logistics encompass the entire process:
manufacturing, consumption, disposal, storage,
transportation, and sale of products under low-
temperature conditions to ensure the safety and
quality products. In whole supply chain, the transport
link is crucial particularly, reasonable distribution
a
https://orcid.org/0009-0008-5876-2987
b
https://orcid.org/0009-0009-9999-8520
c
https://orcid.org/0009-0006-3993-3280
path optimization not only can guarantee the quality
of products and satisfy the needs of client, but also
can reduce the logistical cost actively.
Based on its national circumstances, China, being
a major agricultural country, has seen continuous
increases in the production of agricultural products
like vegetables, fruits, and meat (Xu, 2024).
In the current context of environmental policies,
reducing the carbon emission have become the global
focus (Cai et al., 2024; Hu et al., 2024; Wang et al.,
2024). Especially in logistical industry, because cold-
chain logistics have traits which are high energy
consumption, high carbon emission, so its feature
become the crucial point to optimize.
With the increasing global emphasis on
environmental protection, green cold-chain logistics
become the research highlights. Liu et al. developed
an optimization model for cold-chain logistics
distribution paths for fresh agricultural products,
490
Ren, Y., Tang, G. and Zhou, W.
Optimization of Cold Chain Logistics Based on Dynamic Planning Under Green Perspective.
DOI: 10.5220/0013444300004558
Paper published under CC license (CC BY-NC-ND 4.0)
In Proceedings of the 1st International Conference on Modern Logistics and Supply Chain Management (MLSCM 2024), pages 490-496
ISBN: 978-989-758-738-2
Proceedings Copyright © 2025 by SCITEPRESS – Science and Technology Publications, Lda.

incorporating freshness deterioration penalties and
carbon emission costs in addition to traditional fixed
costs, fuel costs, and time window penalty costs (Liu
et al., 2019). This study utilized an improved genetic
algorithm based on taboo search and validated the
model and algorithm with real-world cases,
demonstrating that including eco-friendly factors in
path optimization can promote sustainable cold-chain
logistics development. Wang optimized cold-chain
logistics distribution paths with time windows using
a genetic algorithm, incorporating a penalty function
and time window to accurately describe multi-path
distribution problems, effectively reducing
distribution costs and mileage (Wang, 2022). Lv et al.
focused on the application of the simulated annealing
algorithm (Lv et al., 2020). They enhanced the
algorithm's local solution accuracy and convergence
speed by adjusting the Metropolis Rules' acceptance
rate, emphasizing the importance of algorithm
parameter selection on optimization effectiveness and
encouraging further development. Ni and Katarzyna
optimized urban agricultural products' cold-chain
distribution systems from a low-carbon perspective,
analyzing factors affecting carbon emissions
comprehensively (Ni and Katarzyna, 2024). They
built a corresponding mathematical model and
validated its feasibility and effectiveness by
optimizing distribution paths using a genetic
algorithm. The study of Pan and Gan focused on
introduce optimization of cold-chain logistics
distribution paths about carbon emission costs (Pan
and Gan, 2016). Jia used ant colony heuristic
algorithm and MATLAB to gain solution. Jia put
forward the research about optimizing cold-chain
logistics distribution path for agricultural product e-
commerce from carbon neutral perspective, using
ecological theory approach and combining Ant
Colony Optimization (ACO) algorithm to explore
cold-chain logistics distribution in city ecological
systems, and the author sought to minimize operating
costs while taking ecological and environmental
considerations into account (Jia, 2022). Qian
introduced a carbon tax into the model by
constructing carbon emission functions while Zhou
and Lu built a multi-objective model with time
window (Qian, 2016; Zhou and Lu, 2019). Two
researches all used genetics algorithm and ACO
algorithm to build models to solve, and then validated
the validity of model through actual cases.
2 HYPOTHESIS AND SYMBOL
DESCRIPTION
2.1 Problem Hypothesis
Traditional logistics distribution optimization has
primarily focused on minimizing economic costs,
often overlooking environmental factors. However,
with global emphasis on energy conservation and
emission reduction policies, reducing carbon
emissions during logistics distribution has become a
critical research area. To define the research scope,
this paper will establish some basic assumptions.
Hypothesis 1: Consider only one distribution
centre. The deliver goods are all temperature sensitive
products which customers need.
Hypothesis 2: Each delivery truck begins its route
at the distribution center and returns there after
completing its deliveries.
Hypothesis 3: All delivery trucks have the same
known load capacity, and the total demand served by
each truck must not exceed this capacity.
Hypothesis 4: It is assumed that the distribution
trucks travel at the same speed at a constant rate,
without taking into account the restrictions of vehicle
flow and road conditions and natural disasters in the
delivery process.
Hypothesis 5: To save delivery resources and
improve vehicle utilization, each customer is served
by one delivery truck, and each truck can provide
delivery services to multiple customers.
Hypothesis 6: The geographic locations of the
distribution center and customers are known. The
quantities demanded by customers, the expected
delivery service times, and the pickup and delivery
service hours are known. Each delivery task must be
completed within a service time frame acceptable to
the customer. It is advisable to maintain all given
values.
Based on these hypotheses: A fleet of vehicles
used for transportation with identical refrigeration
equipment starts from a fresh produce distribution
centre, serving for several customers, and go back to
delivery centre after completing the distribution tasks.
Each specific location of the customer and the
quantity of fresh produce required are predetermined.
Each customer can be served only by a delivery truck.
In the delivery process, fresh products may
experience a decrease in freshness, which can lead to
lower customer satisfaction and thus incur additional
penalty costs. Even so the freshness of products can
be considered in a perfect condition (100%). No
customer will return the products because of the
Optimization of Cold Chain Logistics Based on Dynamic Planning Under Green Perspective
491

reduction of the freshness. On the premise of ensuring
the need of customer products, following time
window restrictions below the load capacity of each
delivery truck, the research takes the penalty costs
caused by carbon emission and the loss of freshness
into consideration, aiming to plan a distribution route
with the lowest total cost to maximize the distribution
efficiency and minimize the cost of cold chain
logistics enterprises.
2.2 Symbol Description
The correlation parameter quantity can be described
as: There are M delivery trucks are available for
deployment, and the truck is numbered as1~m. It
defines a completely symmetric network diagram
G=
𝑣, 𝜀
, 𝑣=
0,1,2, ⋯, 𝑛, 𝑛+1
represents a
collection of all nodes, point 0 and point 𝑛+1 are
considered as the delivery centers, 𝑁
= {1,2, ⋯, 𝑛}
represents a collection of all the customer, ε=
{
𝑖, 𝑗
|𝑖, 𝑗∈𝑁, 𝑖≠𝑗} represents a collection of all the
paths. Other symbols are shown in Table 1.
Table 1: Description of model symbols.
S
y
mbol Instruction
𝐶
The overall cost of cold-chain logistics from
an eco-friendly perspective
𝐶
Fixed operating cost
𝐶
Vehicle transportation cost
𝐶
Refrigeration cost
𝐶
Cost of goods loss
𝐶
Time window cost
𝐶
Cost of carbon emissions
𝑃
Fixed cost of delivery vehicle delivery
𝑠
Fuel cost per unit distance of the delivery
vehicle
𝑠
Cooling cost per unit distance travelled by the
delivery vehicle
𝑠
Cooling cost per unit time of unloading of
delivery vehicle
𝑠
Waiting cost of the delivery vehicle per unit
time
𝑠
Overtime cost of the delivery vehicle per unit
of time
𝑑
Distance between customer point 𝑖 and 𝑗
𝑣
Speed of the delivery vehicle
𝑇
Time required for the delivery vehicle to
unload at the customer's point 𝑗
𝐹
Initial freshness of goods
𝐶
Maximum potential loss cost per unit of good
𝐾
Attenuation index
𝑐
Cost per unit of carbon emissions
𝑒
Emission coefficient of 𝐶𝑂
𝑄
Maximum cargo capacity of the delivery
vehicle
3 MODELING PROCESS
3.1 Objective Function Analysis
This paper considers that the total cost of cold chain
logistics and distribution of agricultural products
includes the following components: fixed usage cost,
vehicle transportation cost, refrigeration cost, cargo
damage cost, time window cost, and carbon emission
cost.
Fixed utilization cost: Fixed costs refer to the
costs spent on vehicle wear and tear, maintenance,
depreciation, and hiring drivers for distribution
vehicles during the distribution process. Where the
decision variables are:
𝑥
=
1, 𝑣𝑒ℎ𝑖𝑐𝑙𝑒 𝑚 𝑡𝑟𝑎𝑣𝑒𝑙𝑠 𝑓𝑟𝑜𝑚
𝑐𝑒𝑛𝑡𝑒𝑟 𝑡𝑜 𝑐𝑢𝑠𝑡𝑜𝑚𝑒𝑟 𝑝𝑜𝑖𝑛𝑡 𝑗
0, 𝑣𝑒ℎ𝑖𝑐𝑙𝑒𝑠 𝑛𝑜𝑡 𝑑𝑒𝑝𝑎𝑟𝑡𝑒𝑑
(1)
Fixed cost of use is:
𝐶
=
∑∑
𝑥
∙𝑃
(2)
Vehicle Transportation Costs: These costs primarily
pertain to the fuel expenses incurred during vehicle
operation. They are proportional to the distance
traveled by the vehicle and can be calculated
accordingly, can be obtained as vehicle transportation
costs:
𝐶
=
∑∑∑
𝑥
∙𝑠
∙𝑑
(3)
where 𝑠
is the cost of fuel consumption per unit
distance traveled by the delivery vehicle and 𝑑
is the
distance traveled by the vehicle between customer
points 𝑖 and 𝑗.
Refrigeration costs: Since all distribution vehicles
are equipped with refrigeration equipment, which
works mainly by consuming refrigerant, the
refrigeration cost of the vehicle during transportation
mainly refers to the total cost of refrigerant consumed
by the refrigeration equipment. It is assumed that each
delivery vehicle can deliver all the fresh food in the
vehicle in only one transportation, and the
refrigeration equipment will not work on the way
back because there is no fresh food in the vehicle.
Considering that the refrigerant consumption is
affected by the external environment, it is necessary
to calculate the total refrigeration cost by considering
the refrigeration cost during transportation and
unloading separately 𝐶
. The cost of refrigeration
during transportation is:
𝐶
=
∑∑∑
𝑥
∙𝑠
∙𝑑
(4)
The cost of refrigeration during unloading is:
𝐶
=
∑∑∑
𝑥
∙𝑠
∙𝑇
(5)
where 𝑠
is the cost of refrigeration per unit distance
traveled by the delivery truck, 𝑠
is the cost of
refrigeration per unit time unloaded, and 𝑇
is the time
MLSCM 2024 - International Conference on Modern Logistics and Supply Chain Management
492

required to unload at the customer point 𝑗. Thus, the
cost of refrigeration 𝐶
is:
𝐶
= 𝐶
+ 𝐶
(6)
Cargo damage costs: Cargo damage cost refers to the
corruption cost of fresh food due to time and
temperature changes during transportation. Among
them, the time-induced spoilage cost accompanies
both transportation and unloading processes, while
the temperature-induced spoilage cost mainly occurs
in the unloading process. Therefore, it is necessary to
consider the cargo spoilage costs in the two stages of
transportation and unloading separately.
Meanwhile, this paper introduces the food
spoilage function based on exponential decay to
describe the process of food freshness decreasing
with time, and assume that all delivery trucks are
traveling at a uniform speed with speed 𝑣. The
expense incurred due to damage to cargo during
transportation is: 𝐶
=
∑∑∑
𝑥
𝐶∙
1 −𝐹
∙𝑒
. The cost of cargo damage
during unloading is: 𝐶
=
∑∑∑
𝑥
𝐶∙
1 −𝐹
∙𝑒
.
where 𝐹 is the initial freshness (100%); 𝐶 is the
maximum potential cost of loss per unit of
commodity, i.e., the cost at 100% freshness; and 𝐾 is
the decay index, which indicates the rate of decay of
freshness over time, and whose value depends on the
rate of spoilage of a particular food item and the
storage conditions. Therefore, the cost of cargo
damage 𝐶
is:
𝐶
= 𝐶
+ 𝐶
(7)
Time Window Costs: These costs arise when a
delivery vehicle fails to arrive at the customer's
location within the specified time window. This
includes waiting costs for vehicles that arrive too
early and overtime costs for delayed arrivals.
𝐶
𝑖
=
𝑠
𝑖
−𝑡
,0≤𝑡
< 𝑖
0, 𝑖
≤𝑡
≤𝑖
𝑠
𝑡
−𝑖
, 𝑖
< 𝑡
(8)
Where 𝑠
is the waiting cost of the delivery truck per
unit of time and 𝑠
is the overtime cost of the delivery
truck per unit of time. Therefore, the time window
cost 𝐶
is:
𝐶
=
∑∑
𝐶
𝑖
(9)
Carbon Emission Costs: According to the standards
of green logistics, not only fuel costs but also carbon
emission costs need to be considered when
calculating costs. Carbon emission cost refers to the
expense incurred from purchasing the necessary
carbon emission allowances in the carbon trading
market. The carbon emissions caused by the logistics
process are mainly due to the direct and indirect
carbon dioxide emissions brought about by the
consumption of various energy sources and
substances in the logistics process, so carbon dioxide
emissions are an important part of the study of carbon
emission costs. Specifically, the cost of carbon
emissions is the product of the carbon dioxide
emission factor of the fuel, the fuel consumption and
the carbon trading price. The carbon emission cost
𝑒
𝑖, 𝑗
incurred by the distribution trucks traveling at
customer point 𝑖 and customer point 𝑗 is:
𝑒𝑦
= 𝑐
𝑒
∅
+
∅
∗
∅
𝑦
𝑑
(10)
where 𝑐
is the cost per unit of carbon emissions, 𝑒
is the 𝐶𝑂
emission factor, ∅
and
∅
∗
∅
are the
intercept and slope, respectively. 𝑄 is the maximum
load capacity of the delivery truck, and 𝑦
is the load
capacity of the delivery truck between customer point
𝑖 and customer point 𝑗. Thus, the cost of carbon
emissions 𝐶
is:
𝐶
=
∑∑
𝑀∙𝑒𝑥
(11)
3.2 Constraints Analysis
Combined with the real situation of the problem, the
cold chain logistics optimization model under the
specific green perspective makes the following
constraints:
Constraint 1: All transport vehicles return to the
distribution center uniformly after the distribution is
completed.
∑
𝑥
=
∑
𝑥
≤1
, 𝑖=0,𝑚=1,2,⋯, 𝑀 (12)
Constraint 2: Distribution is completed by one and
only one transportation vehicle per customer point.
∑∑
𝑥
=1,∀𝑖∈𝑁
(13)
Constraint 3: The load of all transportation
vehicles shall not exceed the maximum load of the
vehicle itself.
∑
𝑦
≤𝑀𝑄, ∀𝑗∈𝑁 (14)
3.3 Planning Model
In summary, this paper establishes a cold chain
logistics optimization model under the green
perspective, and the objective function is to minimize
the total cost 𝐶 of cold chain logistics and
distribution:
𝑀𝑖𝑛𝑪= 𝐶
+ 𝐶
+ 𝐶
+ 𝐶
+ 𝐶
+ 𝐶
(15)
Optimization of Cold Chain Logistics Based on Dynamic Planning Under Green Perspective
493
𝑠. 𝑡.
⎩
⎪
⎨
⎪
⎧
∑
𝑥
=
∑
𝑥
≤1, 𝑖=0,
𝑚=1,2,⋯, 𝑀
∑∑
𝑥
=1,∀𝑖∈𝑁
∑
𝑦
≤𝑀𝑄, ∀𝑗∈𝑁
(16)
4 METHODOLOGIES
By simulating biological evolution, genetic algorithm
helps improve the quality of solutions. Genetic
algorithm is widely used in path planning, scheduling,
and resource allocation.
4.1 Genetic Algorithm Process
The vehicle path planning problem is a significant
topic in operations research. Currently, heuristic
algorithms are primarily used to address this problem,
with genetic algorithms from modern heuristic
methods being widely applied. Genetic algorithms are
global probabilistic search methods that mimic
biological evolution, combining survival of the fittest
with random information exchange. Their core
characteristics are reflected in basic genetic
operations and population exploration strategies.
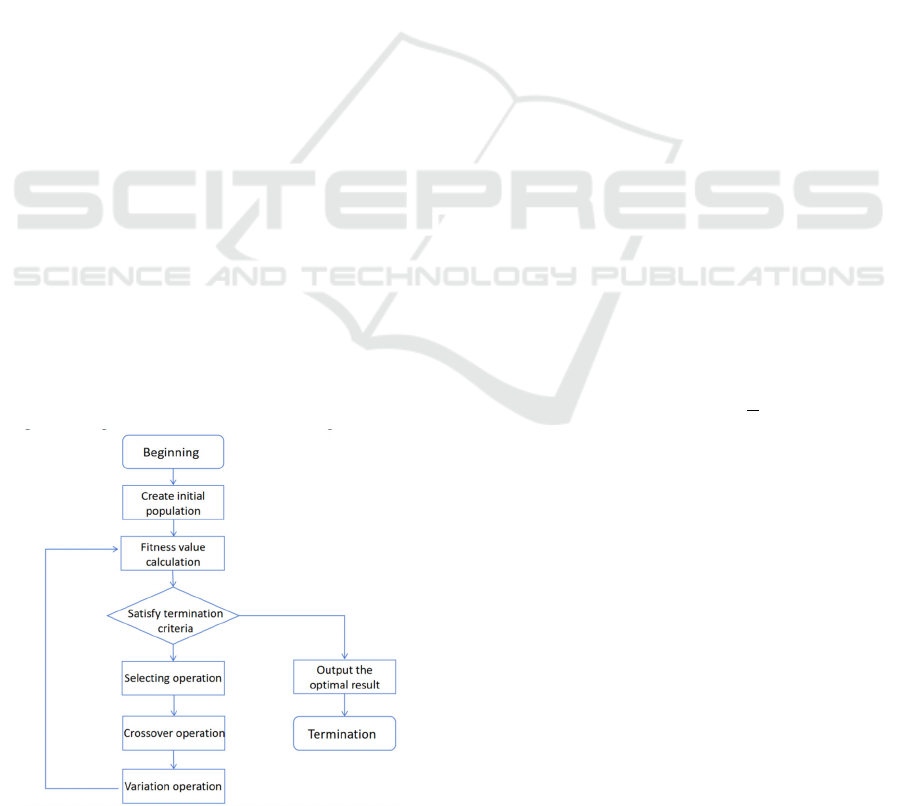
Genetic algorithms begin with a population
containing potential solutions, composed of a certain
number of genetically coded individuals. Through
continuous processes of selection, crossover, and
mutation, individuals are optimized, passing
excellent genes to the next generation to improve
offspring adaptation. During this iterative evolution,
the optimal or satisfactory solution to the problem is
eventually decoded from the best individual in the
final generation population. The specific operations
of genetic algorithms are illustrated in Figure 1 below:
Figure 1: Brief flowchart of the genetic algorithm
4.2 Genetic Algorithm Design
According to the analysis above, the main steps of the
genetic algorithm include encoding, initial
population, fitness calculation, termination, choosing,
crossover, variation.
Step 1: Encoding. Vehicle routing planning is a
sequential optimization problem. Though the binary
coding is widely used, it is not suitable to solve this
kind of problems, because it can result in a large
number of invalid solutions.
In the natural number coding method, No. 0 for
Distribution Centre. 𝑀Cars start from the delivery
center, delivering goods which is numbered as
1,2, ⋯, 𝑁 to the fresh supermarket stores, and go back
to the delivery centre. Once the number of a grocery
store is determined, it will not be changed. The
chromosome length of each distribution line is 𝑀+
𝑁+1.
Step 2: Initial population. The beginning of the
genetic algorithm is forming the initial population. If
the scale of the population is too small, it may result
in insufficient samples and affect the result of
searching. If the scale is too large, the amount of
computation will increase, which may extend
convergence time. Thus, the author uses
randomization to generate an initial population of
100.
Step 3: Fitness value calculation involves
assessing each chromosome by its fitness value. A
higher fitness value indicates an individual with better
quality, whereas a lower fitness value signifies a
poorer quality individual. Poorer individuals are
eliminated through selection or competition.
Expressed by the formula is 𝑓
=
and 𝑓
represents
the fitness value of the 𝑖
chromosome.
Step 4: The termination principle determines
when to stop the algorithm. If the termination criteria
are met, evolution stops. If not, selection, crossover,
and mutation are performed, followed by another
fitness calculation. The individual with the best
fitness value in the final generation, which
corresponds to the lowest cost delivery path, is
considered the optimal solution for path optimization
in cold chain logistics from a green perspective.
Step 5: Selecting operation. Selecting operation is
a process to select relatively good individuals from
the parent population. The research uses roulette
selection strategy, ensuring the differences and
diversity of the progeny population individual, and
can make full use of all available paths to improve
bandwidth utilization.
MLSCM 2024 - International Conference on Modern Logistics and Supply Chain Management
494
To calculate the probability of selection 𝑃
, it will
use the fitness value 𝑓
of individual 𝑖:
P
𝑖
=
𝑓
∑
𝑓
(17)
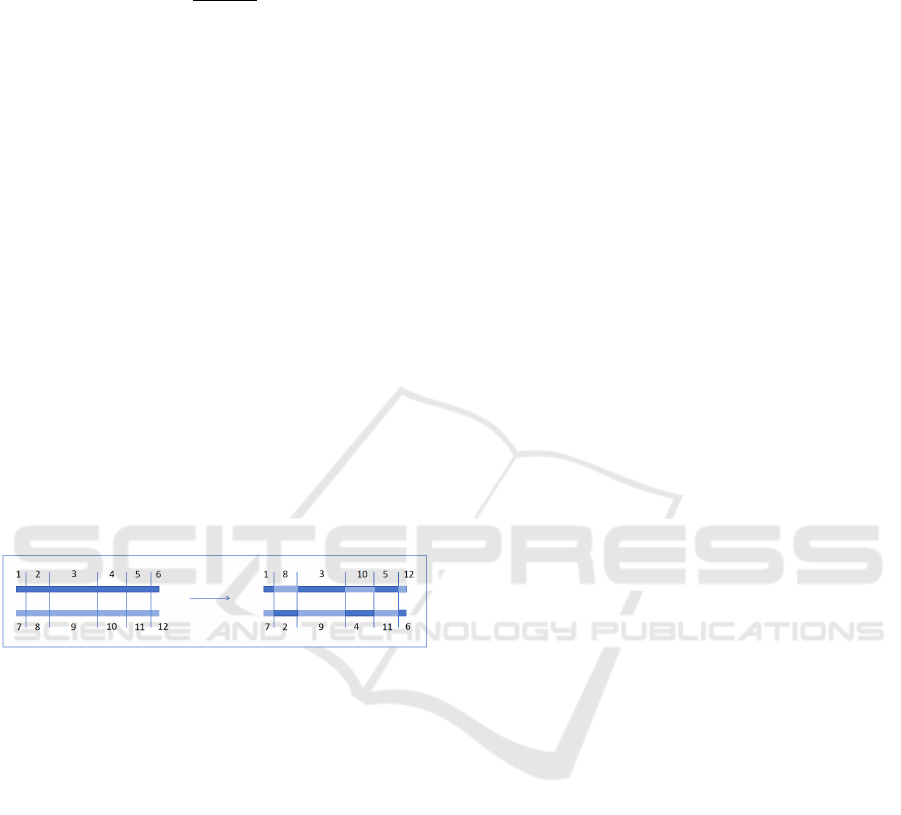
Step 6: Crossover operation. Crossover operation
in the genetic algorithm is to select a certain location
in two or more individuals and swap or replace these
positions to form new individuals. The multi-point
crossover approach to crossover operations is used. It
random selects multiple intersections and exchange
the part between these points of the two individuals.
The numbers and positions of the
Individuals can be different. The multi-point
crossover approach can intersect more gene
fragments and increase the Individual diversity
according to Figure 2. The operation process is as
follows:
Step 1: Segment and number two individuals of
the parent-Parent entity 1: 1,2,3,4,5,6;Parent entity
2: 7,8,9,10,11,12.
Step 2: Find the corresponding customer location
in two parent individuals to start the crossover
operation: 2-8, 4-10, 6-12.
Step 3: Retain positions 1, 3, and 5 of parent entity
1 and positions 7, 9, and 11of parent entity 2.
Step 4: Form two new individuals.
Figure 2: Multipoint crossover.
Variation operation: Variation operation in the
genetic algorithm is to replacement and change
certain genes in the selected individual's
chromosomes to form new individuals. According to
the difference of the coding method, the Binary
variation and real-valued variation are used in this
research.
Binary variation: Choose a variable position
randomly. Then change the value of the gene at the
location of the mutation from "0" to "1", or change
from "1" to "0" to create a new individual.
Real-valued variation: Use another random real
number in the fixed scope to replace genetic value in
the original variant position to generate a new
individual.
Location-based mutation methods: First, two
variation positions are randomly selected. Then the
gene at the second mutation location was moved to
the front of the first mutation location;
Variation based on order: First, two variation
positions are randomly selected. Then exchange the
genes on the two variation positions.
4.3 Example Analysis
In the optimization study of the delivery task of
Nanjing Weigang Lotion Co. Ltd, the author used an
improved genetic algorithm with parameter settings
for 15 neighborhoods in Nanjing as customer points.
The algorithm parameters are set as follows:
population size ( 𝑃
= 100 ), crossover probability
(𝑃
=0.82), mutation probability (𝑃
=0.14), and
maximum number of iterations (𝑀𝑔= 500).
Statistical analysis of 20 runs of the algorithm
gives us the following average results:
The average results reveal that the total cost is
approximately $3,670.15, with a total time
expenditure of about 490.29 minutes and a CO2
emission of 45.56 kilograms.
In all runs, the optimal distribution scenario
consistently involves using five transportation
vehicles. This scenario achieves a total cost of
$3,645.88, a total time of 470.92 minutes, and a CO2
emission of 42.89 kilograms.
These data suggest that the use of improved
genetic algorithms can significantly optimize
distribution efficiency while reducing total cost,
distribution time, and environmental impact.
Therefore, the author recommend that Nanjing
Weigang Emulsion Co. consider implementing this
strategy to improve distribution efficiency and
environmental friendliness.
5 CONCLUSION
The distribution of fresh agricultural products not
only require high efficiency, but also the quality and
timeliness of products, it make that cold-chain
logistics have higher cost than traditional logistics.
Besides, not only vehicle, but also refrigerating
equipment all would produce carbon emission. Thus,
when facing the stress of global warming, optimizing
the distribution path of cold-chain logistics have
become the urgent problems.
Based on this, the paper considers various
components contributing to the total cost of cold-
chain logistics distribution for fresh agricultural
products, including fixed-use costs, vehicle
transportation costs, refrigeration costs, cargo
damage costs, time-window costs, and carbon
emission costs. By combining these factors with the
actual conditions of the issue, the paper develops an
Optimization of Cold Chain Logistics Based on Dynamic Planning Under Green Perspective
495

optimization model aimed at minimizing the total cost
from a green perspective. This research contributes to
achieving green logistics and sustainable
development by ensuring food freshness and quality
while reducing carbon emissions. By utilizing
MATLAB software, the study employs selection,
crossover, and mutation operations to implement the
genetic algorithm solving process. In the case study
of Nanjing Weigang Dairy Co., Ltd.'s distribution
mission, the research successfully reduced the total
cost, overall time consumption, and carbon dioxide
emissions to a certain extent, thereby enhancing
distribution efficiency and environmental friendliness.
Although the contents of this paper could provide
some reference value for cold-chain logistics
distribution path for fresh agricultural products, and
prompt green cold-chain logistics industry to have
further development, the model built by this paper is
confined to some hypothesis and constraint
conditions, so this research also exist some
deficiencies. In further research, the temperature
outside the vehicle in actual distribution could be
taken into cold-chain distribution account to optimize
distribution path from deeper and more diverse
directions.
AUTHORS CONTRIBUTION
All the authors contributed equally and their names
were listed in alphabetical order.
REFERENCES
Cai, W., et al. 2024. Report on carbon emissions from urban
infrastructure in China (2023). Urban and Rural
Construction, 6, 52-61.
Chunrong, N., Katarzyna, D., 2024. Research on
optimization of agricultural products cold chain
logistics distribution system based on low carbon
perspective. Inter. Journal of Information Systems and
Supply Chain Management (IJISSCM), 17(1).
Hu, W., Zhang, J., Wang, H., 2024. Current situation and
improvement path of carbon emission data quality
management in China. Social Science Dynamics, 18-23.
Liu, Y., Wang, K., Yang, Z., et al. 2019. Optimization of
cold chain logistics distribution path considering
carbon emissions and freshness. Journal of Jiangxi
Normal University (Natural Science Edition), 43(2),
188-195.
Lü, C., Shao, K., Zhang, S., et al. 2020. Optimization of
fresh food cold chain logistics distribution path.
Computer Technology and Development, 30(11), 168-
173.
Lü, P., 2013. Research on optimization model of logistics
network considering carbon emissions. Computer
Applications and Research, 30(10), 2977-2980.
Pan, Q., Gan, H., 2016. Optimization of cold chain logistics
distribution path considering carbon emissions.
Practice and Recognition of Mathematics, 46(2), 62-68.
Pei, Y., et al. 2021. Genetic algorithm with embedded
screening operation and its application in welding path
planning. Journal of Mechanical Design and Research,
37(2), 109-113.
Qian, G., 2016. Research on optimization of fresh
agricultural products cold chain distribution path
considering carbon emissions. Beijing Jiaotong
University.
Qiu, X., 2024. Current status and enlightenment of foreign
agricultural products cold chain logistics development.
National Circulation Economy, 37-40.
Wang, J., 2022. Optimization of cold chain logistics
distribution path based on genetic algorithm. Academic
Journal of Computing & Information Science, 5(13).
Wang, J., Li, D., Wang, H., et al. 2024. Status, influencing
factors, and reduction measures of carbon sequestration
and emission reduction in typical agricultural
ecosystems in China. Chinese Agricultural Science
Bulletin, 40(6), 67-74.
Xu, C., 2024. Analysis of factors affecting high-quality
development of agricultural products cold chain logistics.
Logistics Technology, 47(2), 150-152+156.
Xu, P., 2021. "The 14th Five-Year" Cold Chain Logistics
Development Plan Released: A Modern Cold Chain
Logistics System Will Be Fully Established by 2035.
China Food Industry.
Xin, J., 2022. Research on the optimization of cold chain
logistics distribution path of agricultural products e-
commerce in urban ecosystem from the perspective of
carbon neutrality. Frontiers in Ecology and Evolution,10.
Zou, J., Lu, Z., 2019. Research on optimization of fresh
agricultural products cold chain logistics distribution
path considering carbon emissions. Logistics
Technology, 42(8), 46-52.
MLSCM 2024 - International Conference on Modern Logistics and Supply Chain Management
496
