
Model of Coastline Dynamic and Community Adaptation Based on
Local Wisdom in Sungai Pinang Village, West Sumatra, Indonesia
Ikhwan Ikhwan, Triyatno Triyatno and Dedi Hermon
Department of Sociology, Faculty of Social Sciences, Universitas Negeri Padang, Indonesia
Keywords: Shoreline Dynamic, Abrasion, Akresion, Equilibrium State and Adaptation, Local Wisdom.
Abstract: Climate change-induced seasonal shifts often result in environmental problems that impact environmental
change. Seasonal changes cause environmental problems, including biotic and abiotic ecological impacts from
coastal dynamics. This work aims to create a geographical model of shoreline dynamics from 2013 to 2023
and a community adaptation model based on local knowledge. The methodology used in this study is
quantitative and includes a spatial approach and field survey. The results showed shoreline dynamics related
to equilibrium, accretion, and abrasion in the study area. The dynamics of the coastline that occurred from
2013–2023 in abrasion caused the coastline to retreat between 15 m and 18.50 m, and accretion caused the
land to increase by 6.7 m to 10.10 m. The community adaptation model is based on dominant local wisdom
in cultural aspects, where strong local wisdom and religious values can cause the community to adjust when
coastline dynamics occur. Thus, it is necessary to develop local wisdom values to reduce losses due to
coastline dynamics.
1 INTRODUCTION
Climate change lately has often impacted the global
environment, especially the problem of natural
disasters (Zeng et al., 2021; Zhang et al., 2023).
Climate change also impacts changes in coastlines,
where changes in coastlines are often caused by
changes in weather in a place that are often called
seasonal changes. This seasonal change is much
influenced by the sun's apparent motion around the
earth, so that it will cause differences in air pressure
in both the northern and southern hemispheres. This
difference in air pressure will cause wind movement
on the earth's surface, where the wind moves from
areas with high air pressure to areas with low air
pressure (Zhang et al., 2023; Zacharias et al., 2022).
The problem of seasonal changes will also impact
changes in coastlines, especially in the tropics. The
tropics have two seasons: the rainy and dry seasons
(Yu et al., 2019; Valois et al., 2023). Climate change
is a major factor in the issue of coastal change,
specifically about seasonal variations. This seasonal
shift will influence the height of waves near the coast
and wind direction and intensity variations. High
waves heading near the coast will affect how the
coastline changes (Ullah et al., 2021; Tang et al.,
2023). One of the problems caused by this southern
season is the problem of abrasion or changes in the
coastline, which has much impact on damage to
settlements, facilities, and infrastructure close to the
coast.
One tropical area that often experiences abrasion
problems or changes in coastline, especially in the
southern season, is the Pinang River area, located
about 100 km south of Padang City. This Pinang
River area is a village in the southern Pesisir Regency,
which is included in one of the Koto XI Tarusan
District villages. The problem of shoreline dynamics
in this area often causes damage to the collapse of
trees around the coast, while damage to settlements,
facilities, and infrastructure only occurs so much.
This situation is suspected because the people who
live in this area have local wisdom they have believed
in since ancient times and inherited from their
ancestors. This local wisdom, they believe, can
reduce losses due to seasonal changes that impact
coastline changes in the form of abrasion, accretion,
and equilibrium states.
Many previous researchers have researched
coastline changes (Zhang et al., 2023; Tang et al.,
2023; Ntim-Amo et al., 2022), but have but have yet
to discuss community adaptation much, especially
using local wisdom values. Here, the author focuses
Ikhwan, , Triyatno, and Hermon, D.
Model of Coastline Dynamic and Community Adaptation Based on Local Wisdom in Sungai Pinang Village, West Sumatra, Indonesia.
DOI: 10.5220/0013416500004654
In Proceedings of the 4th International Conference on Humanities Education, Law, and Social Science (ICHELS 2024), pages 267-278
ISBN: 978-989-758-752-8
Copyright © 2025 by Paper published under CC license (CC BY-NC-ND 4.0)
267
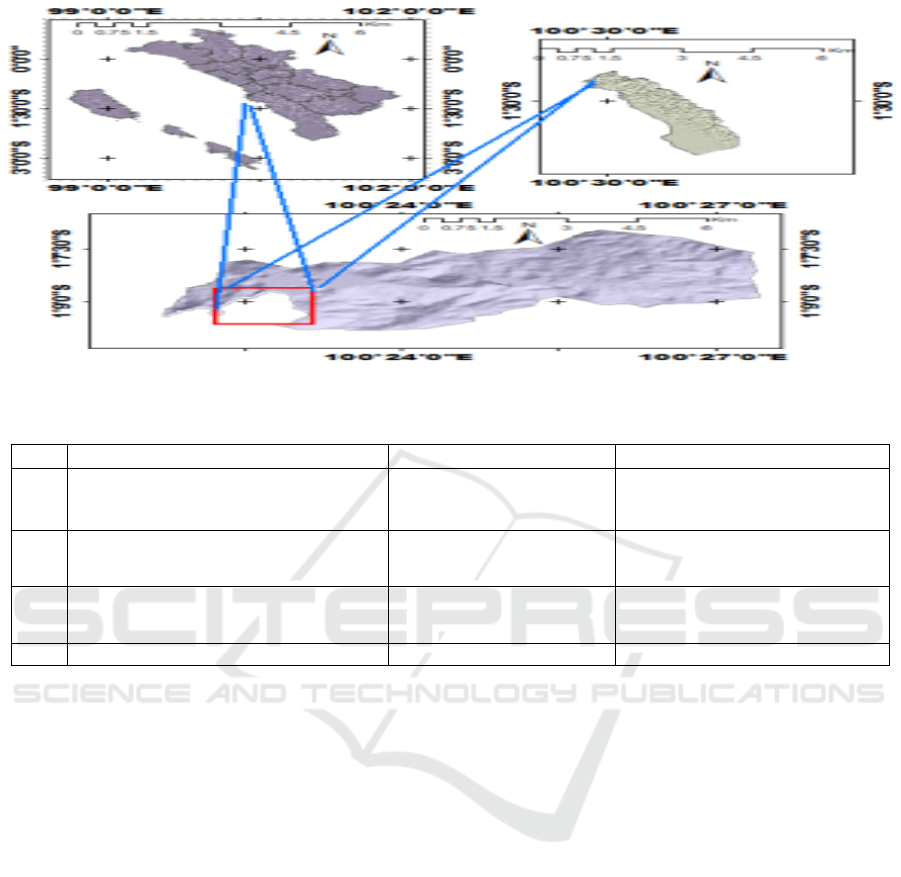
Figure 1: Research Area.
Table 1: Required Data.
No Data Source information
1 Landsat 8 OLI imagery data in 2013,
2018, and 2023
USGS Shoreline dynamic
2 DEMNAS Geospatial Information
Agency
Hillshade
3 Wind Speed Data USGS Determining the direction of the
wind
4 Field data Field surveys Local wisdom
mainly on modelling coastline changes using DSAS
analysis and adaptation models of communities
occupying coastal areas using local wisdom analysis.
This research is expected to contribute to the
development of science, especially on the problem of
coastline change and adaptation, as information for
the community, especially about coastal land use, and
a basis for policymakers, especially in overcoming
climate change problems. The study aims to model
and analyze shoreline dynamics and the influence of
local wisdom values on community adaptation when
facing shoreline dynamic problems.
2 MATERIAL AND METHODS
2.1 Research Area
This study is being conducted in the community of
Sungai Pinang. This region is part of one of the Koto
XI Tarusan District villages and is likewise rural in
the southern Pesisir Regency. The Painan area, the
capital of the South Pesisir district, is about 80 km
north of the Pinang River area, which is situated in
the southern portion of Padang. The following image
provides more information:
2.2 Material and Research Setting
To carry out dynamic shoreline modelling, both
primary and secondary data are needed, where
secondary data is obtained from related institutions
and primary data is obtained directly in the field. The
secondary data needed in this study is Landsat 8 OLI
satellite images from 2013, 2018, and 2023. This data
was obtained from USGS earth explorers, LC
20130609, 20180103, and 20230112. The primary
data needed in the field is structured interviews about
community adaptation based on local wisdom
conducted by people living in Sungai Pinang village
during the shoreline dynamic. Shoreline data for
2013, 2018, and 2023 are required to more
comprehensively examine shoreline changes in the
research region over ten years.
ICHELS 2024 - The International Conference on Humanities Education, Law, and Social Science
268
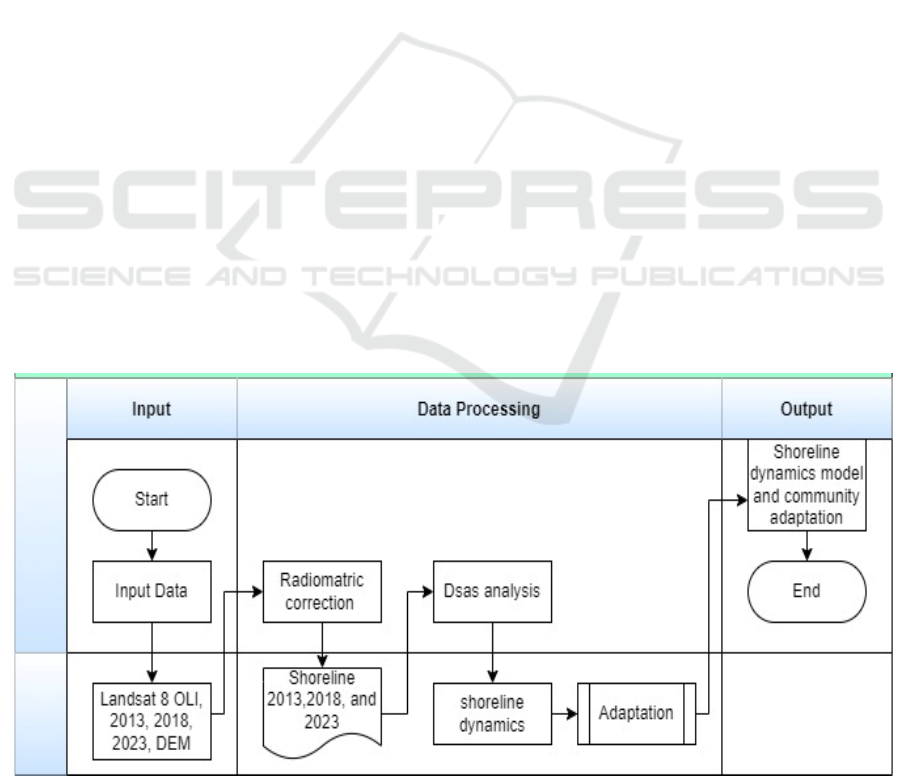
The pre-field, field, and post-field phases of this study
were conducted in multiple stages, which are
described below: Pre-field stage, The activities
carried out at this stage include collecting references
in the form of relevant journals and downloading
Landsat 8 OLI image data from the USGS website to
obtain Landsat 8 OLI images for 2013, 2018, and
2023, as well as DEM data obtained from DEMNAS,
the Indonesian geospatial information agency. After
the satellite image data is obtained, the activities are
to make radiometric corrections to improve the image
of aerosol scattering in the air and perform flash (Yu
et al., 2019; Attaran et al., 2024). After the satellite
imagery is corrected, the activities carried out are
digitizing onscreen to obtain the coastline of the
research area in 2013, 2018, and 2023. The 2013,
2018, and 2023 coastlines are used as the basis for
dynamic shoreline analysis and modelling using
DSAS tools in ArcGIS software. The results of this
shoreline dynamic modeling and analysis are spatial
models. Making questionnaires, which were
structured lists of inquiries regarding how the local
population in the study region adjusted to shoreline
change, was another of the pre-field stage duties. To
ensure the final version of this questionnaire is
effective, it must be evaluated before being given to
field responders.
At this stage of the activity, the field stage is to
distribute questionnaires to respondents, which are
selected based on purposeful sampling, namely
samples taken based on specific objectives. The
response samples were heads of families and
community leaders who knew about shoreline
dynamics and community adaptation. Based on local
wisdom and at this stage, the author also asked
respondents about shoreline dynamics due to abrasion
and accretion.
Following field activities, the steps of
gathering respondent interview results (Duijndam et
al., 2023; Parven et al., 2022), tabulating data,
confirming the validity of data, and performing
statistical analysis are carried out in order to ascertain
the impact of each variable on the dynamics of the
coastline and to enhance the outcomes of the coastline
dynamics modeling with actual conditions in the
field. The next activity is the preparation of reports
and journals. More details can be seen in the
following framework:
2.3 Methodology
The geographical model of shoreline changes was
determined using Landsat 8 OLI satellite images, and
it is necessary to make radiometric corrections to
improve the quality of satellite images (Ntim-Amo et
al., 2022; Roy et al., 2022), especially from thin cloud
cover and aerosol scattering in the air. The formulas
used for radiometric correction are as follows:
𝐿
=𝑀
𝑄
+𝐴
−0
( 1)
Where L
λ
is top atmospheric (TOA), spectral radians
in W/(m
2
. S
r
.μm), M
L
is a specific band of
multivariate rescaling factor from metadata, AL is
additive rescaling, Q
cal
is standard product pixel value
(DN) calibration, and 0
i
is calibrated from Landsat.
Figure 2: Research framework.
Model of Coastline Dynamic and Community Adaptation Based on Local Wisdom in Sungai Pinang Village, West Sumatra, Indonesia
269

To determine the magnitude of shoreline
dynamics in the research area, (Attaran et al., 2024;
Roy et al., 2022) the following formulation is used:
𝑁𝑆𝑀
(.
=𝑑
𝑑
(2)
Where d
ij
is the distance between the coastline and
baseline in the vertical section, and the EPR value can
be formulated as follows:
𝐸𝑃𝑅
()
=𝑎
.()
(3)
T
j+1
is the time of shoreline at j + 1, while T
j
is the
time at j.
To determine the quality of the spatial
modelling, it is necessary to carry out an accuracy test
that is adjusted to field conditions, (Vajjarapu &
Verma, 2021) an accuracy test is used using the kappa
index with the following formulation:
𝐾𝑎𝑝𝑝𝑎=
(4)
𝐾𝑎𝑝𝑝𝑎= 𝐾
𝑥 𝐾
(5)
Where P
0
is the correct sample proportion, P
e
is the
accuracy level, P
Max
is the number of samples taken
in each class, K
Histo
is a value that has a magnitude
between 0 and 1, where the value 1 indicates the
correct value, while 0 indicates the incorrect result,
K
Loc
is a value between -1 and 1, where the value -1
indicates the wrong location and the value 1 indicates
the correct value. To identify the community adaption
model based on local knowledge in the research area,
(Tang et al., 2023; Parven et al., 2022) an interesting
sample of respondents was used based on
proportional random samples using the following
formulation:
𝑛=
()
(6)
Where n is the total number of homes, e is the 5%
design margin of error, and n is the sample size. The
following are the research variables that field
respondents will complete:
Table 2: Variables used in the study.
No Variable Code Score
1 Physical P
Types of buildings P
1
Permanent, 1; semi-
p
ermanent, 2; and non-
p
ermanent, 3
Land selection P
2
Own 1, rent, 2, customar
y
land, 3
Buildin
g
materials P
3
Concrete, 1, semi-concrete, 2, wood, 3
Distance from beach P
4
150 m, 1, 50-150m, 2, and < 50m, 3
2 Social S
Gende
r
S
1
Female, one and male, 2
A
g
e S
2
25-35.1, 35-50.2 and > 50.3
Education S
3
Elementary School-Junior High, 1, High School, 2, and
College 3
Family members S
4
Two persons, 1, 2-4 persons, 2, > four persons, 3
Kinshi
p
relationshi
p
s S
5
None, 1, onl
y
a few relatives; 2, almost all relatives; 3
The role of communit
y
leaders S
6
Never, 1, when there is abrasion, 2, often, 3
Peo
p
le's attitude to abrasion S
7
Unres
p
onsive, 1, ordinar
y
, 2, and
p
erce
p
tive, 3
3 Economics E
Livelihoo
d
E
1
Civil servant, 1, farmer, 2, fisherman, 3
Income E
2
3,000,000, 1, 1,500,000-3,000,000, 2, < 1,500,000, 3
Side livelihoo
d
E
3
Self-em
p
lo
y
ed, 1, farmer, 2, and laborer, 3
Distance from market E
4
< 1 km, 1.1-2 km, 2, and > 3 km, 3
Hel
p
famil
y
members E
5
None, 1, rarel
y
, 2, and routine, 3
4 Culture C
Local knowledge for adaptation C
1
None, 1, 2-3 local wisdom, 2, and > three local wisdom, 3
Mutual ai
d
C
2
None, 1,
p
eriodic, 2, and routine, 3
Reli
g
ion C
3
Other reli
g
ions, 1, Christianit
y
, 2, Islam, 3
Customar
y
deliberations C
4
None, 1, rarel
y
, 2, and routine, 3
Migration/Migration C
5
None, 1, only within the territory, 2, outside the territory, 3
5 Adaptation based on local wisdom
Source: Data analysis in 2024
ICHELS 2024 - The International Conference on Humanities Education, Law, and Social Science
270
A B
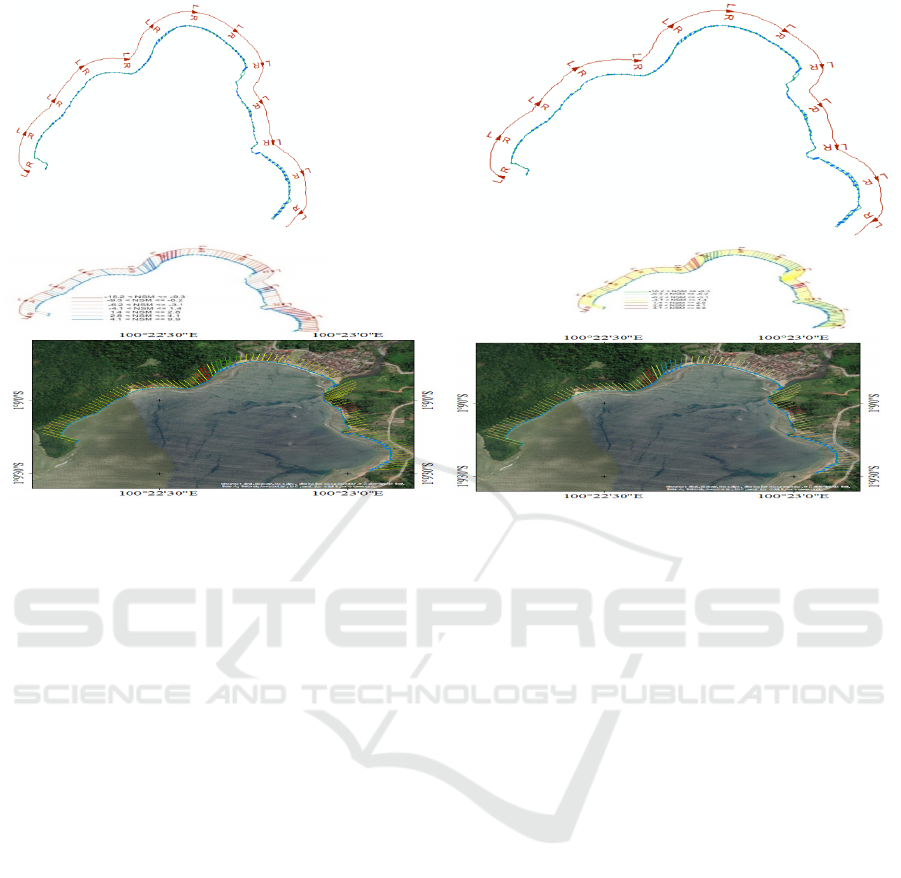
Figure 3: Coastlines from 2013 to 2018 and coastlines from 2018 to 2023.
A B
Figure 4: Shoreline dynamics that occurred between 2013 and 2018 and shoreline dynamics that occurred between 2018 and
2023.
The next stage is taking field data using the head of
the family as a sample of respondents. The results of
the respondents' answers are processed using static
linear regression to determine community adaptation
models based on local wisdom values, which can be
formalized as follows:
𝑌
𝑌
=𝛽
+𝛽
𝐿
+𝛽
𝐿
+ 𝜀
,𝑖=
1…,𝑁 (7)
𝑌
,
= 𝛽
+ 𝛽
𝐻
+ 𝛽
𝐻
+ 𝜀
,
𝑖=
1….,𝑁 (8)
L is the associated explanatory variable, and H is the
related control variable. y
Low-effort
and y
High-effort
represent intentions to participate in low-effort and
high-effort activities, respectively.
3 RESULTS AND DISCUSSION
3.1 Results of the Research
In order to observe the three elements of the spatial
shoreline dynamics model for abrasion, accretion,
and equilibrium state parameters, the coastal spatial
abrasion model was constructed in 2013, 2018, and
2023. The shoreline did not shift between 2013 and
2018, however from 2018 and 2023, there was
abrasion, accretion, and equilibrium state, as seen in
the Figure 3.
The aforementioned image illustrates the
shoreline dynamics that took place between 2013 and
2018 as well as between 2018 and 2023. Abrasion,
accretion, and equilibrium states are examples of
shoreline dynamics that have occurred in the studied
area, or the coastline has remained unchanged. The
figure 4 shows further information regarding the
shoreline dynamics that take place in the study area.
The figure 4 shows that from 2013 to 2023, there
has been a shoreline dynamic in the form of abrasion,
which is between 4 m and 18 m, and accretion, which
occurs between 1.4 m and 4.1 m. Only a tiny part of
the coastline of the study area has a fixed coastline or
equilibrium state. This is because most of the primary
material in the study area is sand, either coarse sand
or fine sand. This sand material is the material that
experiences the most shoreline dynamics in the form
of abrasion and beach accretion. In contrast, on the
coastline, in the form of rocks and front of it, there are
coral reefs that will experience a fixed coastline or
equilibrium state because the presence of coral reefs
in the front will cause waves to break before reaching
the coastline, so that wave
Model of Coastline Dynamic and Community Adaptation Based on Local Wisdom in Sungai Pinang Village, West Sumatra, Indonesia
271
A B
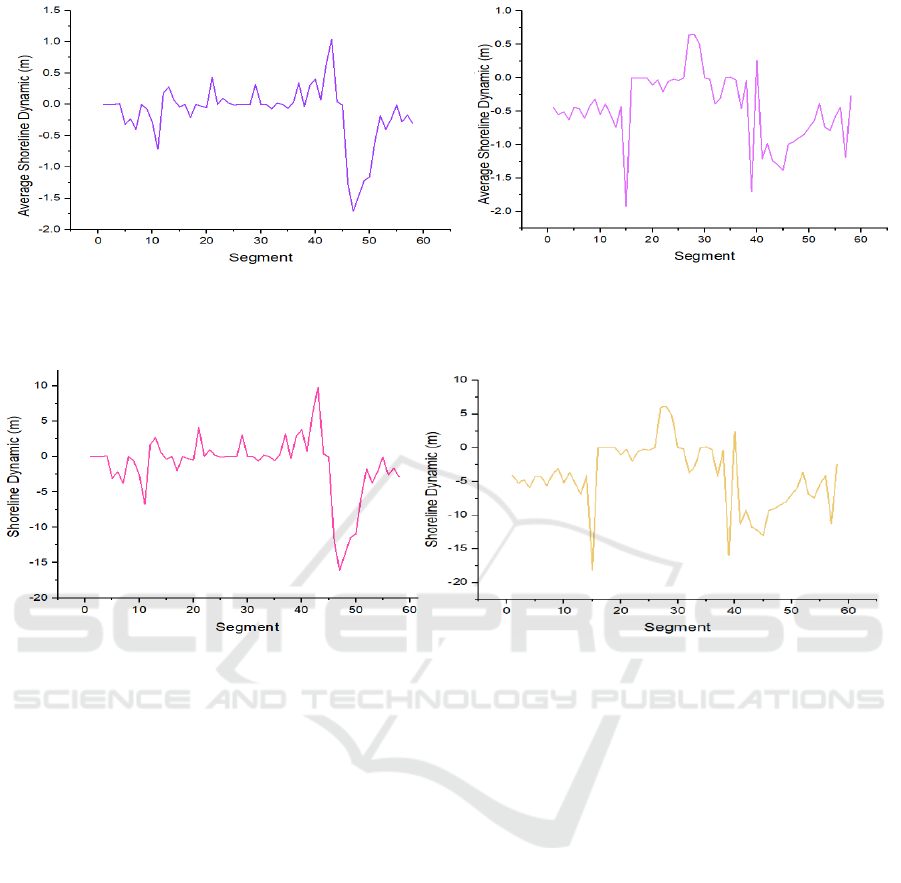
Figure 5: Average shoreline dynamic, A 2013–2018 and B 2018–2023.
A B
Figure 6: Shoreline dynamics from 2013 to 2023.
energy has been reduced before reaching the
coastline. Additional information is shown in the
Figure 5.
The figure 5 shows that in the study area,
shoreline dynamics occurred in both abrasion,
accretion, and equilibrium states (fixed coastline) in
2013–2018 and 2018–2023. The average shoreline
dynamic in the form of coastal abrasion in this area
from 2013 to 2018 was 1.75 m, and from 2018 to
2023, the average abrasion occurred was 1.8 m. The
average shoreline dynamic value accretion from 2013
to 2018 was 1.1 m, and from 2018 to 2023, the
average accretion was 0.75 m. More details about the
shoreline dynamics that occur in the research area can
be seen in the Figure 6.
The figure 6 shows that in the study area, a
shoreline dynamic occurred from 2013 to 2023.
Whereas the shoreline dynamic value in the form of
abrasion that occurred in 2013–2018 was the highest
at 15 m and the highest accretion was 10.1 m, in
2018–2023, the highest shoreline dynamic value in
the form of abrasion was 18.50 m, and the highest
accretion was 6.7 m. For more details, the comparison
of shoreline dynamic values that occurred in the
research area from 2013 to 2023 can be seen in the
following Figure 7.
The figure 7 compares shoreline dynamic values
in the study area from 2013 to 2018 (bottom) and
2018 to 2023 (top). Shoreline dynamic that occurred
from 2013 to 2018 (bottom image) showed that the
study area had the highest value of shoreline dynamic
in the form of coastal abrasion, which was 15 m, and
beach accretion that occurred, which was 10.1 m,
while shoreline dynamic in the form of coastal
abrasion that occurred from 2018 to 2023 showed that
the highest value of shoreline dynamic in the form of
abrasion was 18.50 m and the highest accretion was
6.7 m. The results of the comparative analysis show
that in 2018–2023, shoreline dynamics in the form of
abrasion that occurred in the study area were more
dominant when compared to accretion that
occurred in 2013–2018. This was more influenced by
ICHELS 2024 - The International Conference on Humanities Education, Law, and Social Science
272
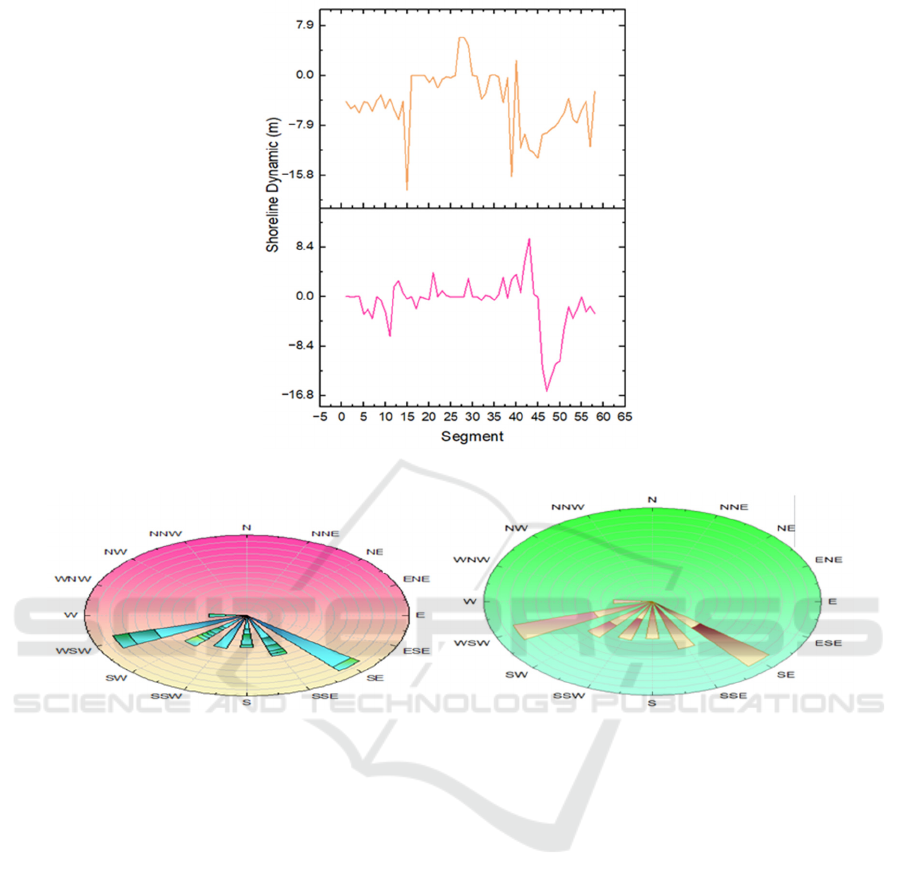
Figure 7: Comparison of coastal dynamics values from 2013 to 2018 and 2028 to 2023.
A B
Figure 8: A Angle of Incidence of Shoreline Dynamic Causes of 2013–2018, Fig. B Angle of incidence of shoreline dynamic
causes in 2028-2023
destructive energy coming from the sea in the form
of the angle of arrival of waves and the anchoring
force on the beach in the form of beach constituent
materials. The results of the model acuuration rate
show a Shoreline Dynamic validation value in 2023–
2018 of 0.87 and 2028–2023 of 0.89, which shows
that the Shoreline Dynamic model is acceptable. For
more details on the direction of waves coming to the
beach in the study area, see the following Figure 8:
3.2 Adaptation
Adaptation is an activity carried out consciously by
people who inhabit an area based on their
knowledge, usually in the form of local wisdom, to
reduce losses caused by a natural disaster. For more
details on adaptation models carried out by the
community based on local wisdom in the research
area, see the table 2.
The table 2 shows the distribution of community
adaptation data based on local awareness in the study
area in dealing with shoreline dynamics, abrasion,
accretion, and equilibrium state. The table 2 shows
the minimum score value of 1 and the highest score
of 3 from respondents' answers, with the highest
deviation standard of 0.76. For more details, the
distribution of community adaptation data based on
local wisdom values can be seen in the following
Figure 9.
The Figure 9 shows that the distribution of
community adaptation data based on local wisdom
in dealing with shoreline dynamics, both abrasion,
accretion, and equilibrium state, is spread
commonly. Thus, this data can be continued in
modelling. For more details on the adaptation model
of society in the research area in facing shoreline
dynamics, both abrasion, accretion, and equilibrium
state can be seen in the table 3.
Model of Coastline Dynamic and Community Adaptation Based on Local Wisdom in Sungai Pinang Village, West Sumatra, Indonesia
273
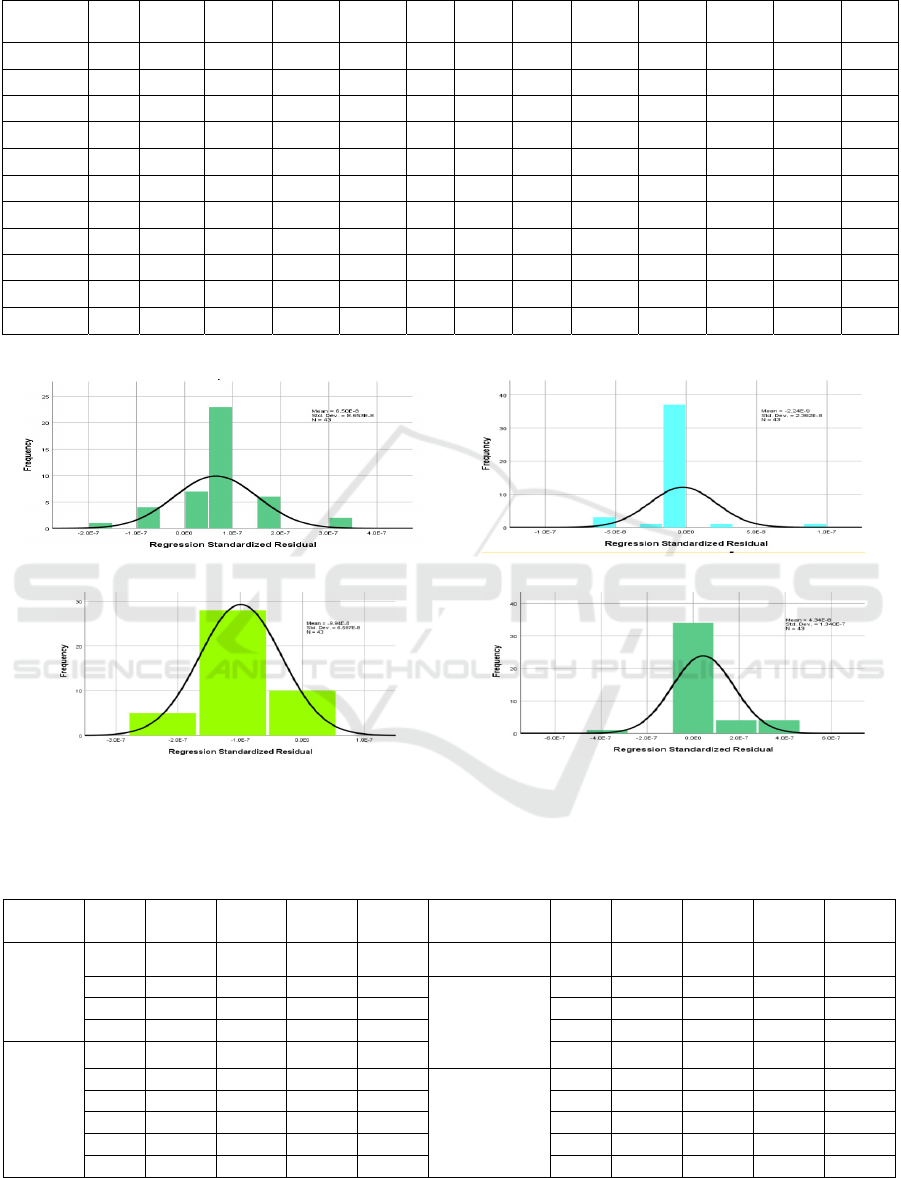
Table 2: Descriptive statistical analysis.
Va
r
N Min Max Mean
Std.
Erro
r
s
d
Va
r
N Min Max Mean
Std.
Erro
r
s
d
P
1
43 1.00 3.00 2.48 .107 .70 E
1
43 3.00 3.00 3.00 .00 .00
P
2
43 1.00 3.00 2.86 .07 .51 E
2
43 1.00 3.00 2.60 .08 .54
P
3
43 1.00 3.00 2.65 .104 .68 E
3
43 1.00 3.00 2.69 .07 .51
P
4
43 1.00 3.00 2.65 .104 .68 E
4
43 1.00 3.00 2.44 .12 .76
S
1
43 1.00 2.00 1.93 .039 .25 E
5
43 1.00 3.00 2.58 .11 .73
S
2
43 1.00 2.00 1.93 .039 .25 C
1
43 1.00 3.00 2.76 .07 .48
S
3
43 1.00 3.00 2.02 .062 .41 C
2
43 1.00 3.00 2.72 .09 .63
S
4
43 1.00 3.00 1.95 .046 .31 C
3
43 1.00 3.00 2.74 .08 .54
S
5
43 2.00 3.00 2.69 .070 .46 C
4
43 2.00 3.00 2.74 .06 .44
S
6
43 1.00 3.00 2.83 .065 .43 C
5
43 1.00 3.00 2.60 .10 .66
S
7
43 2.00 3.00 2.88 .049 .32Adp 43 45.00 59.00 53.81 .43 2.80
Source: Data analysis in 2024
A B
C D
Figure 9: Local wisdom-based distribution of adaptation model data A stands for the physical aspect, B for the social aspect,
C for the economic aspect, and D for the cultural aspect.
Table 3: Coeffients model of adaptations.
Model code B
Std.
Erro
r
Beta Si
g
Model code B
Std.
Erro
r
Beta Si
g
1
Physic
P
1
1.000 .000 .388 .0013
S
7
1.000 .000 .324 .0033
P
2
1.000 .000 .285 .0037 3
Economic
E
1
1.000 .000 .379 .0032
P
3
1.000 .000 .379 .0026 E
2
1.000 .000 .360 .0025
P
4
1.000 .000 .379 .0037 E
3
1.000 .000 .537 .0037
2
Social
S
1
2.000 .000 .383 .0036 E
4
1.000 .000 .513 .0035
S
2
1.000 .000 .303 .0047 4
Culture
C
1
1.000 .000 .400 .0038
S
3
1.000 .000 .226 .0039 C
2
1.000 .000 .525 .0014
S
4
1.000 .000 .345 .0035 C
3
1.000 .000 .449 .0013
S
5
1.000 .000 .321 .0045 C
4
1.000 .000 .368 .0016
S
6
1.000 .000 .241 .0034 C
5
1.000 .000 .550 .0026
Source: Data analysis, 2024.
ICHELS 2024 - The International Conference on Humanities Education, Law, and Social Science
274
A B
C D
Figure 10. A. Variable of Physic, B. Social, C. Economic, and D. Culture to Community Adaptation.
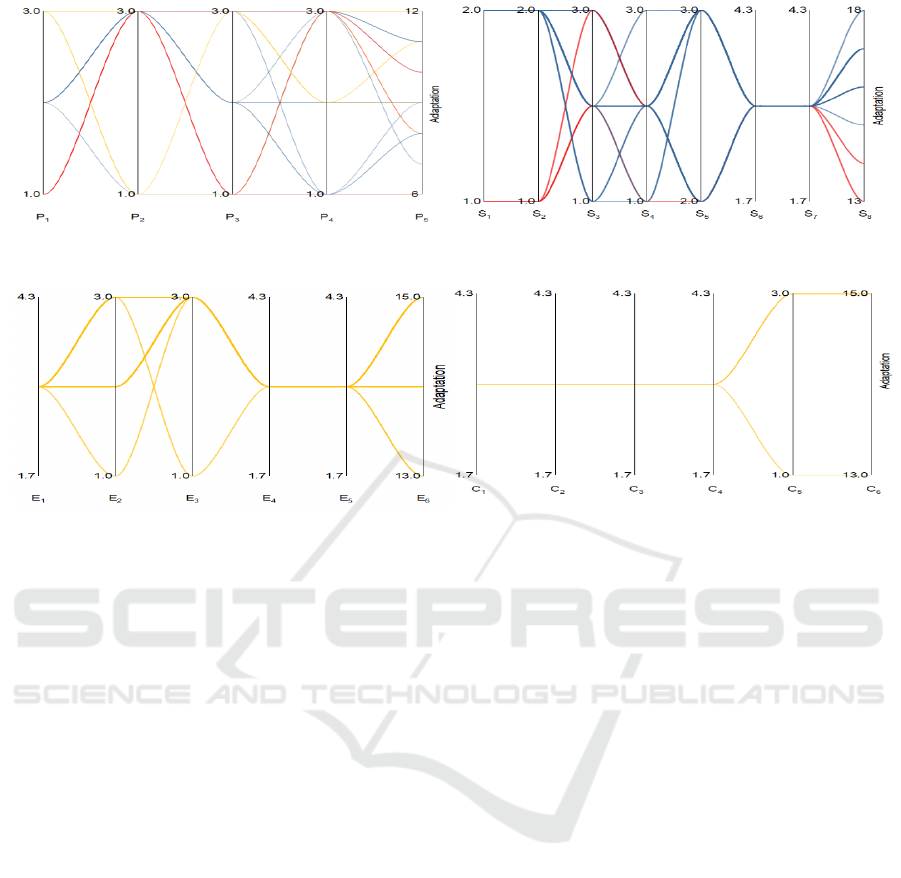
The table 3 shows a significant influence between
the independent and dependent variables, namely the
community adaptation model based on local wisdom
values in the research area, with a significance value
of less than 0.005. For more details, the community
adaptation model based on local wisdom values in the
research area can be seen in the following Figure 10:
The Figure 10 illustrates that the community
adaptation model is based on local wisdom values in
the research area, including physical, social,
economic, and cultural factors. Physical aspects that
affect the adaptation model in the research area are
the types of buildings around the shoreline, namely
more dominant non-permanent buildings and
building materials in wood. This phenomenon occurs
because people prefer houses that have wood
material. After all, this house can be moved when
shoreline dynamics occur, incredibly abrasion. Social
aspects that influence the adaptation model are the
role of community leaders and community attitudes,
where the role of community leaders and community
attitudes is crucial in dealing with shoreline
dynamics. Community leaders generally provide
direction to the public about the weather conditions,
especially about seasonal conditions that can cause
shoreline dynamics, and the community will prepare
themselves for the seasonal conditions. Generally,
people do not go to sea to catch fish in certain seasons
caused by high waves. The economic aspect that
affects the adaptation model is livelihood, and in the
study area, most have livelihoods in the form of
fishermen who are very dependent on marine
products. Cultural aspects influenced the adaptation
model, namely the existence of local knowledge or
values adopted by the community and passed down
from the older generation to the younger ones in
verbal form, namely, if they are afraid of large waves,
do not establish settlements near the coast. This
condition shows that the people are living near the
coastline must be prepared for shoreline dynamics,
such as abrasion, accretion, and equilibrium state.
Religion is another cultural factor that influences the
adaptation model from a cultural perspective. People
living on the coast in the research area are
predominantly muslim, so they believe that shoreline
dynamics occur due to the will of The Almighty. For
more details on the community adaptation model
based on local wisdom values in the research area as
a whole, see the following Figure 11:
Model of Coastline Dynamic and Community Adaptation Based on Local Wisdom in Sungai Pinang Village, West Sumatra, Indonesia
275
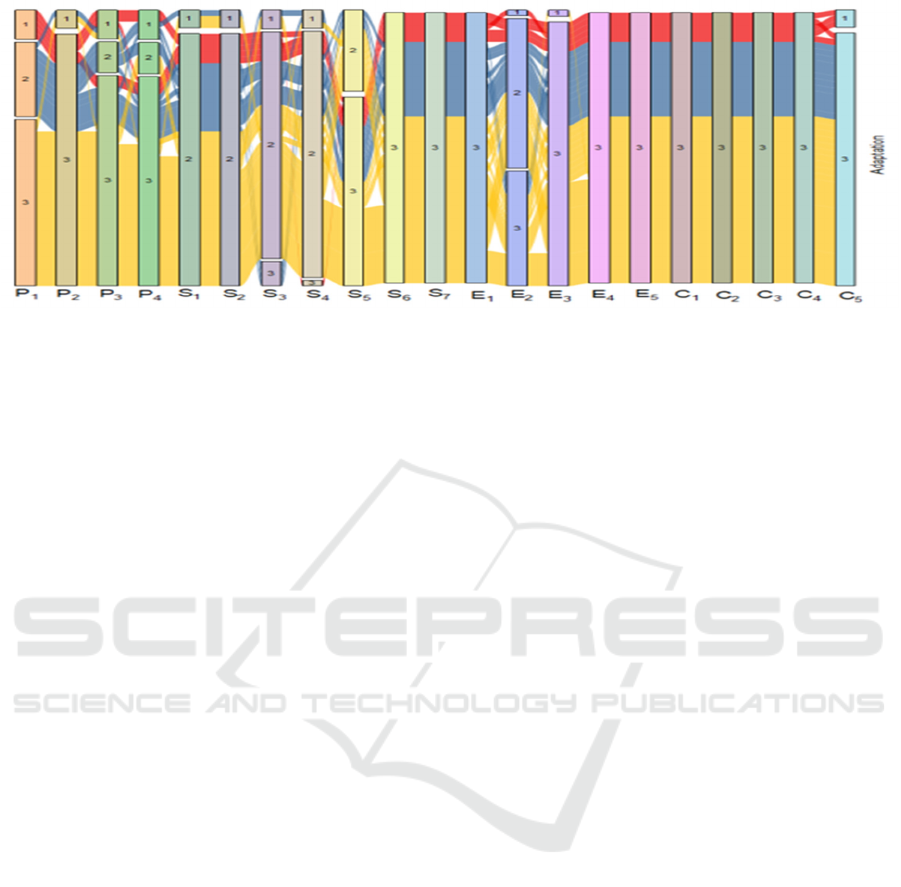
Figure 11: Adaptation model from physical, social, economic, and cultural aspects.
Overall, the Figure 11 demostrates the aspect that
has a significant influence on the adaptation model of
society based on local values to shoreline dynamics is
the cultural aspect, where people in the study area
have occupied this area from the past, especially from
their ancestors. They have long had local knowledge
of shoreline dynamics obtained from their
grandmothers. Another aspect that influences the
adaptation model of society based on local values is
the economic aspect, which is in the form of
livelihoods. The livelihood of people in this area is
generally fishermen, who are very dependent on
marine products, so they prefer to live near the coast
because it is easier to go to sea.
3.3 Discussion
Shoreline dynamics in the study area can be separated
into three categories based on the findings of earlier
studies: abrasion, accretion, and equilibrium
condition. Coastal dynamics are greatly influenced by
seasonal elements, or more precisely, meteorological
issues. The predominant coastline dynamic during the
south wind season is abrasion. In contrast, in the north
wind season, the shoreline dynamic occurs in
accretion, and the season does not influence the
equilibrium state. Equilibrium state coastlines
generally occur in areas with rugged rocks, so these
rocks are more resistant to destructive forces coming
from the sea. Shoreline dynamics in the form of
abrasion often cause problems for people who live
near the coast, especially in areas that have sandy
beaches that have not experienced the process of rock
compaction. Rocks in this area will easily undergo an
abrasion process that causes the coastline to retreat
and impact community settlement buildings (Parven
et al., 2022; Roy et al., 2022). The shoreline dynamic
in the form of abrasion in the study area from 2013 to
2023 is 15 m to 18.50 m, thus impacting community
settlements. Shoreline dynamics in accretion
generally do not cause problems for the community
because the land in the coastal area increases, causing
the land to become more expansive (Mercado et al.,
2020; Mavhura et al., 2021). Shoreline dynamics in
accretion occurred in the study area between 6.7 m
and 10.10 m. The community in the research area
often refers to the addition of land around the coast as
growing land that individuals cannot own. This land
is owned by a tribe or tribe inhabiting the area, so the
use of this land is regulated based on customary law
that applies to the research area and is thoroughly
utilized by the tribe or tribe that owns the growing
land. The damage caused to the research area due to
shoreline dynamics could be better because the
people who live there have reasonably good
adaptability to facing shoreline dynamic problems in
abrasion, accretion, and equilibrium states.
The results of modelling community adaptation
based on local wisdom values in the research area in
physical, social, economic, and cultural aspects show
that the more dominant cultural aspects affect
community adaptation, especially the local
knowledge of the community, which states that if they
are afraid of big waves, do not live near the beach.
This principle shows that people in the study area are
already aware of the impending dangers of seasonal
changes, especially if they erect residential buildings
near the coast. Another cultural aspect that influences
community adaptation based on the values of local
wisdom in the research area is religion, where the
people who inhabit the majority of research areas are
Muslims, who are often referred to as Muslims
(Attaran et al., 2024; Lai et al., 2023). The strong
public belief in religion causes people to be more
confident in facing the shoreline dynamic. Another
aspect that affects community adaptation in this
ICHELS 2024 - The International Conference on Humanities Education, Law, and Social Science
276

research area is the physical aspect, namely the type
of building material used in buildings close to the
beach (Attaran et al., 2024; Anik et al., 2021;
Scherzer et al., 2019), namely wood and stilt houses
so that the building of this house can be moved to a
safer area when abrasion comes. The transfer
of residential buildings was carried out
mutually cooperatively by the people who inhabit the
research area under the direction of community
leaders.
4 CONCLUSION
In the study field, shoreline dynamics can be broken
down into three categories: equilibrium state,
accretion, and abrasion. Shoreline dynamics in
abrasion cause the coastline to retreat, while shoreline
dynamics in accretion cause the land around the coast
to become more expansive, often referred to by the
community in the study area as growing land. This
growing land is owned by a tribe or tribe occupying
the research area whose use is regulated by customary
law and may not be traded and fully utilized by the
tribe and passed on to future generations according to
the mother's lineage. The model of community
adaptation in the research area that is very influential
is the cultural aspect, where with the maritime
cultural aspect, the community will still choose to live
around the coast. The strong adaptation of the
community to the research area causes the community
to adjust when there is a shoreline dynamic problem.
Thus, the community adaptation model based on local
wisdom values can be applied to coastal areas. The
firm values of local wisdom cause the community to
be able to overcome the problem of coastline changes
that occur in their area.
REFERENCES
Anik, A. R., Rahman, S., Sarker, J. R., & Al Hasan, M.
(2021). Farmers’ adaptation strategies to combat
climate change in drought prone areas in Bangladesh.
International Journal of Disaster Risk Reduction, 65,
102562.
Attaran, S., Mosaedi, A., Qeidari, H. S., & Derakhshandeh,
J. F. (2024). Co-evolution of human and hydrological
system: Presenting a socio-hydrological approach to
flood adaptation in Kalat city, Iran. International
Journal of Disaster Risk Reduction, 102, 104292.
Duijndam, S. J., Botzen, W. J. W., Endendijk, T., de Moel,
H., Slager, K., & Aerts, J. C. J. H. (2023). A look into
our future under climate change? Adaptation and
migration intentions following extreme flooding in the
Netherlands. International Journal of Disaster Risk
Reduction, 95, 103840.
Lai, X., Wen, J., Shan, X., Shen, L., Wan, C., Shao, L., Wu,
Y., Chen, B., & Li, W. (2023). Cost-benefit analysis of
local knowledge-based flood adaptation measures: A
case study of Datian community in Zhejiang Province,
China. International Journal of Disaster Risk
Reduction, 87, 103573.
Mavhura, E., Manyangadze, T., & Aryal, K. R. (2021). A
composite inherent resilience index for Zimbabwe: An
adaptation of the disaster resilience of place model.
International Journal of Disaster Risk Reduction, 57,
102152.
Mercado, J. M. R., Kawamura, A., & Amaguchi, H. (2020).
Interrelationships of the barriers to integrated flood risk
management adaptation in Metro Manila, Philippines.
International Journal of Disaster Risk Reduction, 49,
101683.
Ntim-Amo, G., Yin, Q., Ankrah, E. K., Liu, Y., Twumasi,
M. A., Agbenyo, W., Xu, D., Ansah, S., Mazhar, R., &
Gamboc, V. K. (2022). Farm households’ flood risk
perception and adoption of flood disaster adaptation
strategies in northern Ghana. International Journal of
Disaster Risk Reduction, 80, 103223.
Parven, A., Pal, I., Witayangkurn, A., Pramanik, M., Nagai,
M., Miyazaki, H., & Wuthisakkaroon, C. (2022).
Impacts of disaster and land-use change on food
security and adaptation: Evidence from the delta
community in Bangladesh. International Journal of
Disaster Risk Reduction, 78, 103119.
Roy, B., Penha-Lopes, G. P., Uddin, M. S., Kabir, M. H.,
Lourenço, T. C., & Torrejano, A. (2022). Sea level rise
induced impacts on coastal areas of Bangladesh and
local-led community-based adaptation. International
Journal of Disaster Risk Reduction, 73, 102905.
Scherzer, S., Lujala, P., & Rød, J. K. (2019). A community
resilience index for Norway: An adaptation of the
Baseline Resilience Indicators for Communities
(BRIC). International Journal of Disaster Risk
Reduction, 36, 101107.
Tang, J., Liu, A., & Qiu, H. (2023). Early warning,
adaptation to extreme weather, and attenuation of
economic losses: Empirical evidence from pastoral
China. International Journal of Disaster Risk
Reduction, 86, 103563.
Ullah, F., Shah, S. A. A., Saqib, S. E., Yaseen, M., &
Haider, M. S. (2021). Households’ flood vulnerability
and adaptation: Empirical evidence from mountainous
regions of Pakistan. International Journal of Disaster
Risk Reduction, 52, 101967.
Vajjarapu, H., & Verma, A. (2021). Composite adaptability
index to evaluate climate change adaptation policies for
urban transport. International Journal of Disaster Risk
Reduction, 58, 102205.
Valois, P., Anctil, F., Cloutier, G., Tessier, M., & Herpin-
Saunier, N. (2023). Following up on flood adaptation in
Québec households four years later: A prospective
exploratory study. International Journal of Disaster
Risk Reduction, 94, 103782.
Model of Coastline Dynamic and Community Adaptation Based on Local Wisdom in Sungai Pinang Village, West Sumatra, Indonesia
277

Yu, J., Sim, T., Guo, C., Han, Z., Lau, J., & Su, G. (2019).
Household adaptation intentions to earthquake risks in
rural China. International Journal of Disaster Risk
Reduction, 40, 101253.
Zacharias, L., Christy, J., Roopesh, B. N., Binu, V. S., Das,
S. K., & Sekar, K. (2022). Development of an
instrument on psychosocial adaptation for people living
in a disaster-prone area. International Journal of
Disaster Risk Reduction, 68, 102716.
Zeng, X., Guo, S., Deng, X., Zhou, W., & Xu, D. (2021).
Livelihood risk and adaptation strategies of farmers in
earthquake hazard threatened areas: Evidence from
sichuan province, China. International Journal of
Disaster Risk Reduction, 53, 101971.
Zhang, Z., Yang, A., & Wang, Y. (2023). How do social
capital and village-level organizational trust affect
farmers’ climate-related disaster adaptation behavior?
Evidence from Hunan Province, China. International
Journal of Disaster Risk Reduction, 99, 104083.
ICHELS 2024 - The International Conference on Humanities Education, Law, and Social Science
278
