
Detection of Landslide-Prone Areas in Garut Regency Using
Composite Mapping Analysis and Geographic Information System
Ilham Badaruddin Mataburu
a
, Lia Kusumawati
b
and Ode Sofyan Hardi
c
Department of Geography, Universitas Negeri Jakarta, DKI Jakarta, Indonesia
Keywords: Landslide, CMA, GIS.
Abstract: Landslides represent one of the most frequent disasters in Garut Regency, resulting in various detrimental
impacts, including property damage, infrastructure impairment, and even loss of life. Identifying areas
susceptible to landslides can aid significantly in mitigation efforts. The objective of this study is to map these
landslide-prone regions within Garut Regency. The research employs a Composite Mapping Analysis (CMA)
model alongside Geographic Information System (GIS) technology, utilizing five parameters that influence
landslide occurrences: land use, slope, geology, rainfall, and elevation, in addition to one parameter for
comparing locations of previous landslides.The findings indicate that the CMA and GIS models, based on the
five parameters utilized, effectively contribute to understanding landslide occurrences, as evidenced by the
designated weight values of each parameter. Specifically, the geology, land use, and slope parameters
exhibited high weight values of 30.29, 29.84, and 17.71, respectively, highlighting their significant role in
landslide susceptibility in this region. The delineation of landslide-prone areas revealed that 9.99% of Garut
Regency is classified as having very high vulnerability, while 16.18% falls into the high vulnerability category,
predominantly located in the southern areas of the Cisompet, Pakenjeng, and Talegong sub-districts.
1 INTRODUCTION
Landslides are one of the most frequently occurring
natural disasters in Indonesia, often resulting in
significant loss of life and property. According to a
report by BNPB (2020), there were 726 landslide
incidents in 2019, leading to 114 fatalities and the
evacuation of 12.193 people due to the destruction of
homes. This marked an increase from the previous
year, which recorded 642 landslide events that also
resulted in casualties, injuries, and extensive damage
to residential buildings and critical infrastructure.
Garut Regency is classified as a high-risk disaster
area (BNPB, 2020), experiencing nine different types
of disasters frequently. From 2015 to 2019, 41
landslides occurred in this region resulting in six
fatalities and extensive damage to residential
buildings, requiring the evacuation of 433 people.
Landslides have also severely impacted critical
infrastructure, including roads and bridges, as well as
agricultural land. The high landslide risk in this
a
https://orcid.org/0009-0006-9338-1325
b
https://orcid.org/0000-0001-8334-8229
c
https://orcid.org/0009-0007-9691-5385
region is driven not only by geophysical factors but
also by extensive land-use changes, as forest areas
have been rapidly converted into agricultural land and
residential areas over recent years.
Identifying landslide-prone areas is essential for
effective disaster management. Efforts to reduce
disaster impacts through prevention, mitigation, and
adaptation strategies must begin with an
understanding of landslide susceptibility based on the
types of landslides across different landforms.
Therefore, knowledge of landslide vulnerability is
crucial (Mubekti & Fauziah, 2008; Susanti &
Miardini, 2019).
The use of Geographic Information System (GIS)
technology facilitates the identification of disaster-
prone areas, and its application in mitigation efforts
has been extensively studied. Developing GIS models
integrated with statistical methods has proven highly
accurate in detecting landslide susceptibility (Pasang
& Kubicek, 2020). Integrating various landslide
causative factors helps clarify the role of each
Mataburu, I. B., Kusumawati, L. and Hardi, O. S.
Detection of Landslide-Prone Areas in Garut Regency Using Composite Mapping Analysis and Geographic Information System.
DOI: 10.5220/0013408900004654
In Proceedings of the 4th International Conference on Humanities Education, Law, and Social Science (ICHELS 2024), pages 331-339
ISBN: 978-989-758-752-8
Copyright © 2025 by Paper published under CC license (CC BY-NC-ND 4.0)
331

indicator in influencing landslide potential (Mersha &
Meten, 2020). This approach is crucial for decision-
makers in formulating disaster-based spatial planning
for prevention and mitigation purposes. Therefore,
this study aims to map landslide-prone areas in Garut
Regency using the Composite Mapping Analysis
(CMA) model and GIS. This method is expected to
assess the contribution of each landslide-driving
factor both statistically and spatially
2 METHOD
2.1 Location
This research was conducted from May to September
2021 in Garut Regency, West Java Province.
According to the administrative division, the Garut
Regency consists of 42 subdistricts, 422 villages, and
21 urban villages.
2.2 Materials and Tools
The landslide-prone areas were analyzed using five
parameters in the form of spatial data (maps), namely
land use, slope, elevation, geology, and rainfall, as
well as landslide location points as comparison
parameters for determining weights and scores. The
analysis of landslide-prone areas was conducted
using Geographic Information System (GIS) software
with overlay functions. The tools used in this study
included GPS and ArcGIS 10.3 software.
2.3 Analysis Method
The landslide-prone areas were analyzed using the
Geographic Information System (GIS) overlay
method. The weighting and scoring for each
parameter affecting landslide susceptibility were
conducted using the Composite Mapping Analysis
(CMA) model. The weights and scores for each
parameter were determined by comparing the number
of observed landslide events with the expected
incidence of landslides in each region
(Boonyanuphap et al., 2001; Haryani et al., 2012).
The expected number of landslides represents the
total number of landslides that should ideally occur
within each area based on the area's total area. The
CMA mathematical formula for mapping landslide-
prone levels is as follows:
𝑇𝑅𝐿 =
∑
𝑊𝑖.𝑋𝑖
…………………(1)
Where:
• TRL is the landslide susceptibility level,
• Wi is the weight of parameter i, and
• Xi is the score for parameter i.
The weight Wi is formulated as:
𝑊𝑖 =
∑
……………………………(2)
Where:
• Mi is the average total observation for each
landslide susceptibility factor, and
• Xi is the score for each factor within each
parameter.
The score Xi is calculated as follow:
𝑋𝑖 =
.
∑
/
……………………..(3)
Where:
• Oi is the total observed landslide incidents,
and
• Ei ia the expected number of landslide
incidents.
The weight and score results from the CMA
model for each parameter were used as weights and
scores in the GIS analysis. All weights and scores
were then input as spatial data attributes for each
parameter. The overlay method was used to combine
all landslide-prone parameters, followed by
determining the susceptibility levels for each
landslide-prone area in the GIS environment.
Landslide susceptibility levels were divided into five
classes using the following equation:
𝐼=
………………........………..(4)
Where:
• I is the class interval distance,
• c is the highest score total,
• b is the lowest score total, and
• k is the desired number of classes.
3 RESULT
The paper size must be set to A4 (210x297 mm). The
document margins must be the following:
3.1 Score Values for Each Parameter
Each class within each parameter has a different
influence on landslide occurrence. The influence
value is measured through spatial comparison
between the distribution of landslide points and the
types and extents of each parameter, indicated by the
score value.
3.1.1 Land Use
Based on Table 1, the highest number of landslide
occurrences is found in dryland farming/garden land
use types. These areas are typically cultivated by the
ICHELS 2024 - The International Conference on Humanities Education, Law, and Social Science
332
Table 1. Area and Score of Land Use Parameter (Source: Data processing, 2021).
No. Land use Area (Ha) Area (%)
Number
landslide points
Score
1 Settlement 18.038,70 5.83 5 16.94
2 Building 1.09 0.00 0 0.00
3 Forest 63.714,43 20.58 1 1.12
4 Man
g
rove forest 32.09 0.01 0 0.00
5 Fish
p
on
d
17,31 0.01 0 0.00
6 Grassland 2.736,84 0.88 0 0.00
7 Waterbod
y
1.701,18 0.55 0 0.00
8 Garden 51.154,24 16.52 16 22.42
9 Irri
g
ated rice fiel
d
7.285,86 5.58 3 12.44
10 Rain-fed rice fiel
d
40.353,45 13.03 10 17.76
11 Shrubland 56.312,02 18.19 12 15.27
12 Dry fiel
d
57.981,82 18.73 9 11.12
13 Sand embankment 270.40 0.09 0
Total 309.599,43 100.00 56 97.07
Table 2. Area and Score of Elevation Parameter (Source: Data processing, 2021)
No. Elevation Area (Ha) Area (%)
Number landslide
points
Score
1 <500 82665,08 26.70 19 34.06
2 500 - 1000 120470,95 38.91 20 24.60
3 1000 - 1500 79680,82 25.74 15 27.89
4 1500 - 2000 22037,01 7.12 2 13.45
5 >2000 4745,57 1.53 0 0.00
Jumlah 309599,43 100.00 56 100.00
community as horticultural gardens with seasonal
crops. The root systems of these crops are not strong
enough to bind the soil effectively. Similarly, rain-fed
rice fields, which have shallow roots, also contribute
to soil stability issues. These two types of land use
have the highest scores in terms of their contribution
to landslide occurrences in the Garut Regency. Other
land use types with relatively high scores include
shrubland and dry fields (see Table 1). The
distribution of land use types and landslide points can
be seen in Figure 2a.
3.1.2 Elevation
The highest number of landslide occurrences is found
at elevations of 500–1000 meters above sea level (m
asl) and below 500 m asl. Generally, landslides rarely
occur at elevations above 1500 m asl. This is related
to land interventions from human activities, which are
typically conducted at elevations below 1500 m asl.
Areas at elevations above 1500 m are seldom utilized.
The highest scores based on spatial comparisons are
found at elevations <500 m asl and at elevations of
1000–1500 m asl (see Table 2). These areas are
generally located in the southern part and represent
the lowest areas within the study region. The spatial
distribution of elevation classes and landslide points
is presented in Figure 2b.
3.1.3
Rainfall
Rainfall plays an important role in landslide
occurrences (Tajudin et al., 2018). The infiltration of
water into the soil increases the soil mass and creates
a friction plane on the bedrock, making it more
slippery and causing the soil to become more prone
to movement (Paimin et al., 2009). The rainfall data
used in this study is the maximum daily rainfall,
divided into two classes. Based on the spatial
comparison calculations, both rainfall classes show
close score values (see Table 3). The higher score is
found in the rainfall class of 13.6–20.7 mm, with a
score of 50.25. This value does not differ significantly
from the score in the 20.7–27.7 mm class, which is
49.75. The distribution of rainfall classes and
landslide points is presented in Figure 2c.
Detection of Landslide-Prone Areas in Garut Regency Using Composite Mapping Analysis and Geographic Information System
333
Table 3. Area and Score of Rainfall Parameter (Source: Data processing, 2021)
No. Rainfall (mm/hr) Area (Ha) Area (%)
Number landslide
points
Score
1 13.6
–
20.7 192.768,91 62.26 35 50.25
2 20.7
–
27.7 116.830,52 37.74 21 49.75
Total 309.599,43 100.00 56 100.00
Table 4. Area and Score of Slope Parameter (Source: Data processing, 2021)
No. Slope Area (Ha) Area (%) Number landslide points Score
1 0 - 8 % 50.209,94 16.2 1 2.41
2 8 - 15 % 51.824,67 16.74 3 6.99
3 15 - 25 % 70.362,27 22.73 15 25.75
4 25 - 40 % 73.192,59 23.64 21 34.66
5 >40% 64.009,96 20.68 16 30.19
Total 309.599,43 100.00 56 100.00
3.1.4 Slope
Based on the slope, the study area is mostly
mountainous, with slopes greater than 15%. The
central to northern areas, as well as the southern
coastal area, are narrow plains with slopes of less than
15%. Landslide occurrences are found on slopes
greater than 15%, with the highest number of
occurrences in the 25–40% slope class. Based on
spatial comparison, the highest scores are in the 25–
40% and >40% slope classes. Score comparisons
show that the highest scores are in areas with slope
classes of 25–40% and >40%, with 21 and 16
landslide points, respectively. Subsequently, the
score decreases with decreasing slope class. The
score values and slope class distribution are presented
in Table 4 and Figure 2d.
3.1.5 Geology
Geology is related to soil stability in terms of
landslide potential; geological formations that are less
compact are more likely to detach and experience soil
movement, while more compact rocks tend to be
more resistant to soil movement which can lead to
landslides. Generally, the potential for soil movement
is associated with the properties of rocks in
responding to water or vibrations as landslide triggers
(Paimin et al., 2009). Geologically, the study area is
divided into 30 types of geological formations, most
of which are volcanic in origin, consisting of volcanic
rocks. The study area is dominated by tuff and breccia
rocks, pyroclastic deposits, and young volcanic rocks,
which are primarily found in the central to southern
parts of the study area (see Figure 2e). The score
values from the CMA analysis through spatial
comparisons between landslide points and geological
types indicate that out of 30 geological types in the
study area, only 7 contain landslide points with
varying numbers. The highest scores are found in reef
limestone and tuff and breccia members, with values
of 25.46 and 21.14, respectively. Other geological
types with relatively high scores include young
volcanic rocks, old volcanic breccia, and pyroclastic
deposits (see Table 5).
3.2 Weight of Each Parameter
Calculations using the CMA and SIG models,
according to Equation 2, yield the weight values for
each parameter in relation to its correlation with the
distribution of landslide occurrences. The weight of
each parameter correlates with the contribution of
each parameter to landslide occurrences, and the
results indicate that geology, land use, and slope
gradient parameters exhibit the highest weight values.
3.2.1 Delineation of Landslide Hazard Areas
Landslide hazard levels were calculated using GIS by
applying Equation 1 across all parameters, including
land use, slope, rainfall, elevation, and geology. The
analysis was conducted through overlay processes
and mathematical operations on the weight and score
values according to the equation below:
TRL = 29.84 SPL + 17.71 SLE + 7.73 SCH + 30.29
SGE + 14.43 SEle
Where:
ICHELS 2024 - The International Conference on Humanities Education, Law, and Social Science
334

Table 5. Area and Score of Geology Parameter (Source: Data processing, 2021)
No. Geology type Area (Ha) Area (%)
Number of
landslide
p
oints
Score
1 Breccia from old volcanic rocks 23.377,73 7.55 5 15.10
2 Lava from old volcanic rocks 588,56 0.19 0 0.00
3 Breccia from old volcanic products 1.175,29 0.38 0 0.00
4 Unaltered old volcanic products 16.10 0.01 0 0.00
5 Mandalawangi-Mandalagi volcanic formation 1.693,12 0.55 0 0.00
6 Pumice tuff and breccie 2.228,47 0.72 0 0.00
7 Sangianganjung volcanic rocks 156,11 0.05 0 0.00
8 Guntur-Pangkalan volcanic rocks 12.648,52 4.09 1 5.58
9 Young volcanic rocks 61.388,69 19.83 15 17.25
10 Loose recent sediments 16.918,58 5.46 0 0.00
11 Lava guntur 3.578,22 1.16 0 0.00
12 Kolovial 102,83 0.03 0 0.00
13 Olf volcanic efflata deposits 2.019,79 0.65 0 0.00
14 Alluvial 8.311,41 2.68 0 0.00
15 Old volcanic products 7.239,49 2.34 0 0.00
16 Papandayan volcanic efflata 3.821,86 1.23 0 0.00
17 Waringin-Bedil Andesite 6.064,75 1.96 0 0.00
18 Intrusive rocks 3.461,63 1.12 0 0.00
19 Koleberes formation 1.881,78 0.61 0 0.00
20 Pyroxene andesite 88,67 0.03 0 0.00
21 Pyroclastic deposits 45.556,77 14.71 7 10.85
22 Tuff and breccia members 86.839,23 28.05 26 21.14
23 Benteng formation 15.308,18 4.94 1 4.61
24 Lower benteng formation 61,21 0.02 0 0.00
25 Quartz diorite 116,87 0.04 0 0.00
26 Jampang formation 1.788,07 0.58 0 0.00
27 Alluvial dan coastal deposits 149.04 0.05 0 0.00
28 Andesite 197.62 0.06 0 0.00
29 Andesite hornblende 47.68 0.02 0 0.00
30 Coral reef limestone 2.773,14 0.90 1 25.46
Total 309.599,43 100.00 56 100.00
• TRL represents the landslide hazard level,
• SPL is the score for the land use parameter,
• SLE is the score for the slope parameter,
• SCH is the score for the rainfall parameter,
• SGE is the score for the geology parameter,
and
• SEle is the score for the elevation parameter.
The calculation results showed a minimum value of
431,11 and a maximum value of 2.844, 91.
Subsequently, the landslide hazard levels are divided
into 5 classes following Equation 5 as follows:
Detection of Landslide-Prone Areas in Garut Regency Using Composite Mapping Analysis and Geographic Information System
335
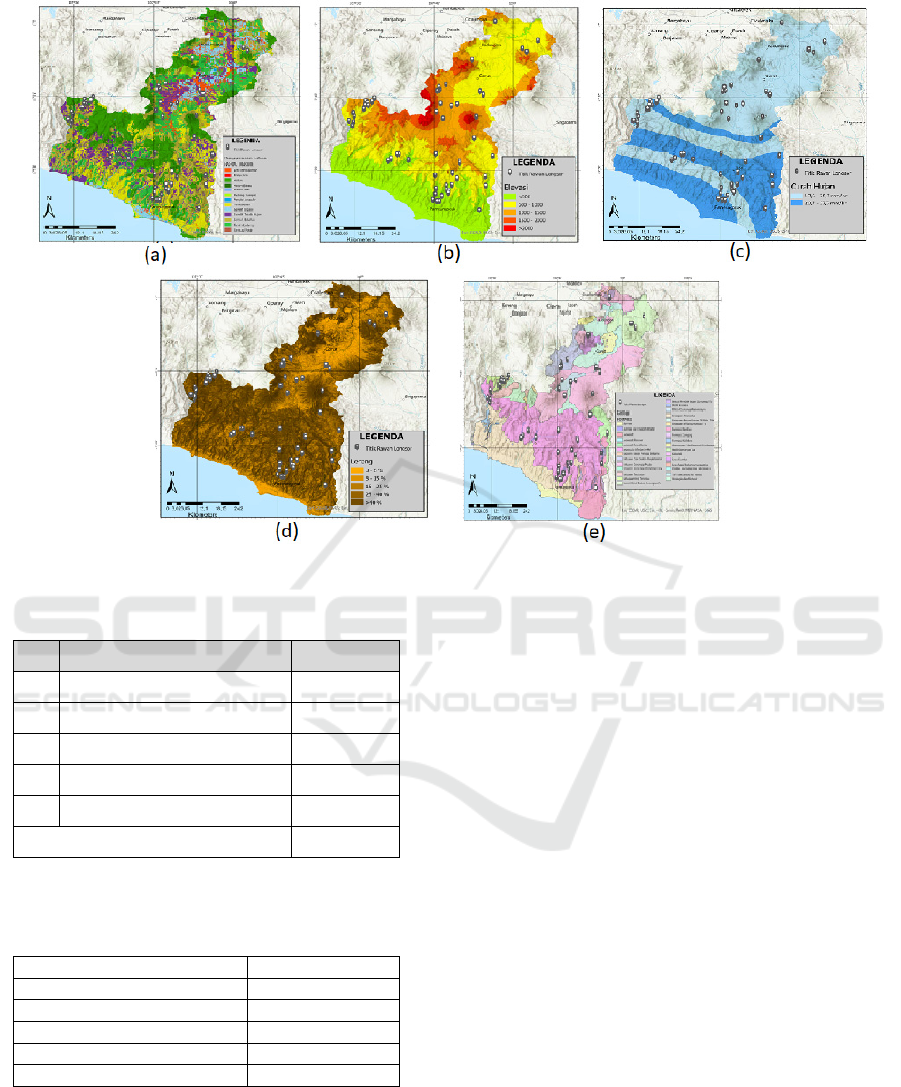
Figure 2: Map of (a) Land use; (b) Elevation; (c) Rainfall; (d) Slope; (e) Geology.
Table 6. Weight of Landslide Parameter
No Parameter Weight
1 Land use 29.84
2 Slope 17.71
3 Rainfall 7.73
4 Geology 30.29
5 Elevation 14.43
Total 100.00
Source: Data processing, 2021
Table 7. Landslide Hazard Class (Source: Data analysis,
2021)
Landslide Hazard Class TRL Value
Very low < 913.87
Low 913.87 - 1396,63
Moderate 1396,63 - 1879,39
Hi
g
h 1879,39 - 2362,15
Ver
y
hi
g
h > 2362,15
According to Table 7, areas with a very low landslide
hazard level constitute the largest area in the Garut
Regency, while areas with a very high hazard level
represent the smallest area (9.99%). These high-
hazard areas are generally distributed from the
southern to central parts and on the left side near the
border between Garut and Tasikmalaya Regencies.
This region consists of southern limestone hills and
areas surrounding the central and eastern volcanic
mountains in Garut Regency. It typically features
steep slopes and high rainfall, especially in
mountainous areas approaching borders with
neighboring regencies (see Figure 3).
The largest extent of very high hazard areas is
primarily found in Cisompet District, with significant
areas also in Cikelet District, Pakenjeng District, and
partially in Bungbulang and Banjarwangi Districts.
Similarly, high-hazard areas are concentrated in
Cisompet and Pakenjeng, which have the largest land
area in this category.
3.3 Discussion
The use of CMA and GIS models in landslide hazard
mapping, employing five determining parameters and
comparing them with landslide occurrence data,
effectively identifies areas with similar
characteristics across the five parameters and assesses
their hazard levels both statistically and spatially. The
application of GIS and the CMA model indicates that
landslide occurrences in Garut Regency are
influenced by specific factors: geological types of tuff
and breccia, land use for plantations, slopes between
5–40% and greater than 40%, elevations of 500–1000
ICHELS 2024 - The International Conference on Humanities Education, Law, and Social Science
336
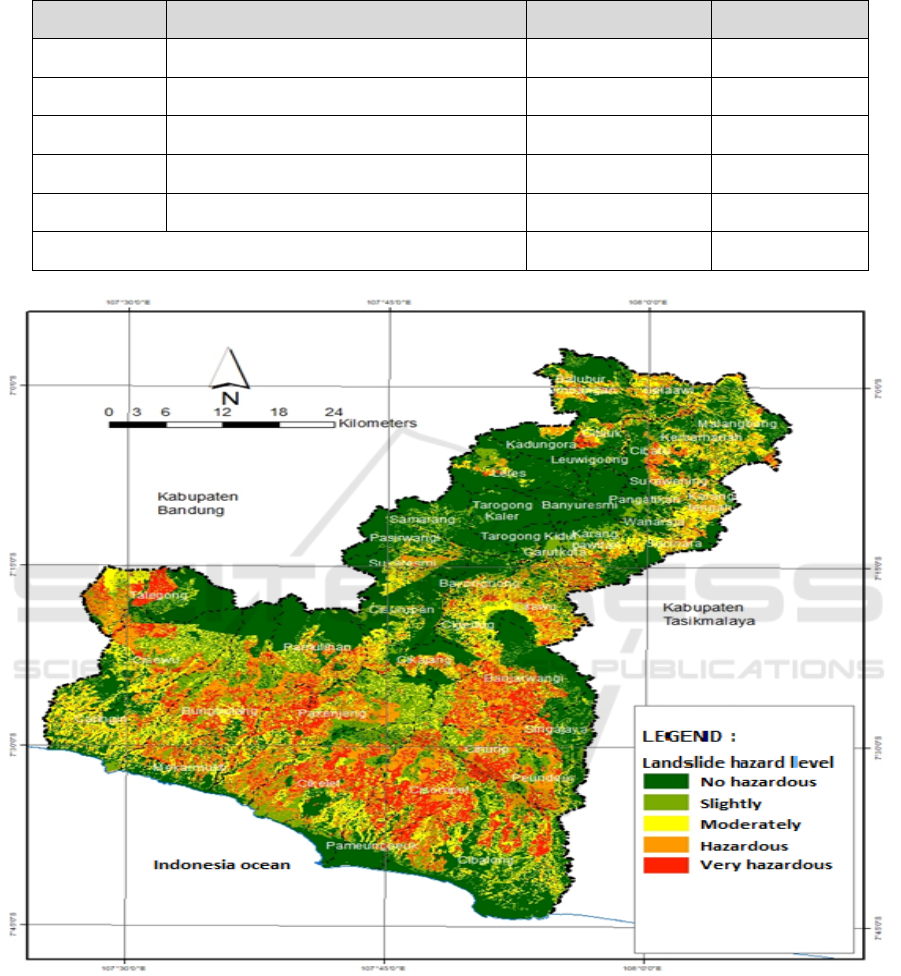
Table 8. Landslide Hazard Area in Garut Regency (Source: Data analysis, 2021)
No Landslide Hazard Level Area (ha) Area (%)
1 Not hazardous 130.145,85 42.04
2 Slightly hazardous 52.132,34 16.84
3 Moderately hazardous 46.295,13 14.95
4 Hazardous 50.094,38 16.18
5 Very hazardous 30.931,73 9.99
Total 309.599,43 100.00
Figure 3: Map of Landslide Hazardous in Garut Regency.
meters, and a generally even distribution concerning
rainfall.
Geology and land use are parameters closely
associated with landslide occurrences (Faizana et al.,
2015; Pasang & Kubicek, 2020). Research findings
indicate that these two parameters have the highest
weights based on landslide distribution in Garut
Regency. Landslide distribution is concentrated in
areas with geological types such as tuff and breccia
and young volcanic rocks, both of which formed from
past volcanic activity, particularly in the central to
northern regions (Sulaksana et al., 2014). The
southern part consists of karst hills, featuring varied
topography with steep to very steep slopes. Rock
layers that allow water to seep until reaching
Detection of Landslide-Prone Areas in Garut Regency Using Composite Mapping Analysis and Geographic Information System
337

impermeable layers can trigger slippage, leading to
landslides (Paimin et al., 2009).
Another determining factor for landslide occurrences
in the study area is land use, which relates to the land's
ability to respond to water. Landslides commonly
occur on agricultural lands, such as fields and dryland
farms. The incidence of landslides increases with the
rapid change in land use in this region, as Garut
Regency is among the areas with a high rate of land-
use change, especially around slopes and the foothills
of volcanic mountains, which are fertile for
horticulture or seasonal crops like corn, cabbage,
scallions, and other vegetables (Muldiana et al.,
2016). Intensive land-use changes, driven by
infrastructure development or agricultural expansion,
can increase landslide potential (Moresi et al., 2020;
Pasang & Kubicek, 2020). Agricultural activities in
Garut Regency occur on various topographies, with
dryland farming spread across hills and the foothills
to the slopes of mountains, including areas with
slopes > 25%. This situation disrupts soil stability and
potentially increases landslide occurrences
(Anbalagan et al., 2015). The type of land use affects
slope stability, as seasonal agricultural lands with
shallow-rooted crops decrease slope stability,
increasing the risk of landslides (Susanti & Miardini,
2019). Landslide events in Garut Regency primarily
occur on slopes > 25%, with land uses such as
plantations, fields, and shrublands.
4 CONCLUSIONS
The study produced several conclusions:
1. The use of GIS and the CMA model
effectively maps landslide hazard areas by
comparing five determining parameters with
the landslide occurrence parameter through
weighting and scoring of each parameter.
2. Geological factors, land use, and slope are
the parameters with the highest contribution
to landslide occurrences in Garut Regency.
3. The distribution of high and very high
landslide hazard areas is generally located in
the southern to central parts of Garut
Regency, which consist of a series of hills
and mountains, primarily in Cisompet and
Pakenjen Districts. Areas classified as
relatively non-hazardous to slightly
hazardous are typically found in the central
to northern and western regions, which have
gentler slopes, including Garut Kota,
Tarogong Kidul, Tarogong Kaler, and
Banyuresmi Districts.
RECOMMENDATIONS
The resulting landslide hazard map can serve as a
consideration in spatial planning as an initial step to
determine the type and location of land use allocation
as part of landslide disaster mitigation efforts in the
Garut Regency. For future research, the use of the
CMA model and GIS relies heavily on the number
and types of parameters applied. Additional
parameters should be included to obtain improved
results.
REFERENCES
Anbalagan, R., Kumar, R., Lakshmanan, K., Parida, S., &
Neethu, S. (2015). Landslide hazard zonation mapping
using frequency ratio and fuzzy logic approach , a case
study of Lachung Valley , Sikkim. Geoenvironmental
Disasters, 2(6), 1–17. https://doi.org/10.1186/s40677-
014-0009-y
Boonyanuphap, J., Suratmo, F. G., & Jaya, I. N. S. (2001).
Gis-based method in developing wildfire risk model
(Case study in Sasamba, East Kalimantan, Indonesia).
Jurnal Manajemen Hutan Tropika, 7(2), 33–45.
https://doi.org/10.7226/jmht.7.2.
Faizana, F., Nugraha, A. L., & Yuwono, B. D. (2015).
Pemetaan risiko bencana tanah longsor Kota Semarang.
Jurnal Geodesi Undip, 4(1), 223–234.
Haryani, N. S., Zubaidah, A., Dirgahayu, D., Hidayat, F. Y.,
& Junita, P. (2012). Model bahaya banjir menggunakan
data penginderaan jauh di Kabupaten Sampang. Jurnal
Penginderaan Jauh, 9(1), 52–66.
Mersha, T., & Meten, M. (2020). GIS-based landslide
susceptibility mapping and assessment using bivariate
statistical methods in Simada area , northwestern.
Moresi, F. V., Maesano, M., Collalti, A., Sidle, R. C.,
Matteucci, G., & Mugnozza, G. S. (2020). Mapping
Landslide Prediction through a GIS-Based Model : A
Case Study in a Catchment in Southern Italy.
Geosciences, 10(309), 1–22.
https://doi.org/doi:10.3390/geosciences10080309
Mubekti, M., & Fauziah, A. (2008). Mitigasi Daerah Rawan
Tanah Longsor Menggunakan Teknik Pemodelan
Sistem Informasi Geografis; Studi Kasus: Kecamatan
Sumedang Utara dan Sumedang Selatan. Jurnal Teknik
Lingkungan, 9(2), 121–129.
Muldiana, A., Sugandi, D., & Somantri, L. (2016).
Pemanfaatan citra landsat 8 untuk analisis penggunaan
lahan di Kabupaten Garut. Antologi Pendidikan
Geografi, 4(2), 73–80.
http://journal.ikippgriptk.ac.id/index.php/edukasi/articl
e/download/17/16
Paimin, Sukresno, & Pramono, I. B. (2009). Teknik Mitigasi
Banjir dan Tanah longsor (A. N. Ginting (ed.)).
Tropenbos International Indonesia Programme.
Pasang, S., & Kubicek, P. (2020). Landslide Susceptibility
Mapping Using Statistical Methods along the Asian
ICHELS 2024 - The International Conference on Humanities Education, Law, and Social Science
338

Highway, Bhutan. Geosciences, 10(430), 1–26.
https://doi.org/10.3390/geosciences10110430
Pellicani, R., Argentiero, I., Spilotro, G., Argentiero, I., &
Spilotro, G. (2017). GIS-based predictive models for
regional-scale landslide susceptibility assessment and
risk mapping along road corridors susceptibility
assessment and risk mapping along road corridors.
Geomatics, Natural Hazards and Risk, 5705.
https://doi.org/10.1080/19475705.2017.1292411
Sulaksana, N., Sukiyah, E., Sjafrudin, A., & Haryanto, E.
T. (2014). Karakteriristik geomorfologi DAS Cimanuk
bagian hulu dan implikasinya terhadap intensitas erosi
serta pendangkalan Waduk Jatigede. Bionatura-Jurnal
Ilmu-Ilmu Hayati Dan Fisik, 16(2), 95–102.
Susanti, P. D., & Miardini, A. (2019). Identifikasi
Karakteristik dan Faktor Pengaruh pada Berbagai
Tipe Longsor. 39(2), 97–107.
Tajudin, N., Ya’acob, N., Ali, D. M., Adnan, N., & Naim,
N. F. (2018). Rainfall – landslide potential mapping
using remote sensing and GIS at Ulu Kelang , Selangor
, Malaysia. IOP Conference Series: Earth and
Environmental Science, 012080, 1–8.
https://doi.org/doi :10.1088/1755-1315/169/1/012080
Detection of Landslide-Prone Areas in Garut Regency Using Composite Mapping Analysis and Geographic Information System
339
