
Pet Adoption Status Prediction Based on Multiple
Machine Learning Models
Honglin Lu
a
Computer Science, University of Washington, Seattle, U.S.A.
Keywords: Pet Adoption, Machine Learning Models, Artificial Intelligence.
Abstract: It is urgent and challenging to reasonably select machine learning algorithms and models to accurately predict
the adoption status of pets. In this paper, the prediction is a classification task for whether a pet will be
adopted or not which aims to reach the highest possible accuracy. Several models are used to predict the pet
adoption status based on some information in the given dataset on Kaggle and the evaluation is mainly based
on accuracy. For each model, pre-processing includes separating numerical and categorical columns and
dropping useless columns or editing some columns if necessary. Multiple parameters are involved in tests for
each model. The Artificial Neural Network (ANN) is designed to have four layers with the first three layers
using ReLu as activation functions and the last using Sigmoid. Different amounts of middle layer neurons and
epochs are tested in order to select the parameter with the highest accuracy to represent the model. By
comparing the accuracy of each testing result, it indicates the best performing model is the four-layer ANN
model with both the number of neurons in the middle layer and the amount of epoch to be around 60 and the
number of neurons in the first and third layers to be 20.
1 INTRODUCTION
Pets, nowadays, have become an indispensable part
of many people's lives. According to the pet
ownership statistic on Forbus in 2024, 66% of the
U.S. Households own at least one pet, which is about
86.9 million homes (Megna, 2024). Common
domestic pets include dogs, cats, birds, fish, rabbits,
lizards, etc. These pets play important roles in their
owners' lives, most commonly as companions. To
achieve a sense of belonging, the relationship
between pets and people is an important source of
social support and attachment (Hajek, 2024).
Moreover, pets can effectively improve owner’s
health from a variety of aspects, such as reducing
systemic hypertension, lowering hyperlipidemia and
promoting physical activity (Hussein, 2021). Many
professional jobs also require well-trained pets to
complete, such as guide dogs and detection dogs.
With the increasing demand for pets, pet adoption has
gradually become a current affair for pet protection
organizations and adoption agencies and shelters.
Therefore, it is critical and urgent to provide a
reasonable and accurate prediction of whether a pet
a
https://orcid.org/0009-0004-6168-9523
will be adopted, which can not only enhance the pet
adoption rate, but also provides superior resource
allocations in fundings and food.
As digitalization becomes more prevalent around
the world, Machine Learning (ML) and Artificial
Intelligence (AI) are developing rapidly. In order to
make ML and AI efficient, accurate, flexible and
diverse, various algorithms for intelligent machine
training, for example, random forest, decision tree,
logistic regression, etc., have been gradually
designed, developed, and widely applied in almost
every field. With the help of AI in Computed
Tomography (CT) image diagnosis, case screening,
intelligent analysis and diagnosis, and auxiliary
clinical diagnosis and treatment decision-making can
be more accurately and quickly (Hussein, 2021). In
the field of chemistry, a robust ML model can
expedite the identification of promising candidates
for experimental validation by efficiently predicting
the reaction outcome for any new choice of
substrates/catalyst (Zeng, 2024). Interestingly, in
recent years, there has been a lot of data research and
analysis on pets based on machine learning.
Mohammad et al. applied AI and ML techniques with
362
Lu, H.
Pet Adoption Status Prediction Based on Multiple Machine Learning Models.
DOI: 10.5220/0013331300004558
In Proceedings of the 1st International Conference on Modern Logistics and Supply Chain Management (MLSCM 2024), pages 362-367
ISBN: 978-989-758-738-2
Copyright © 2025 by Paper published under CC license (CC BY-NC-ND 4.0)
the biological perspective to predict and classify
canine personalities based on data derived from C-
BARQ database (Amirhosseini, 2024). Seon-Chil and
Sanghyun attempted using AI to predict a dog’s
health conditions based on the data provided by the
sensor attached on dogs, which resulted in an
accuracy of 87.5% with a discrepancy only in beagle
compared to the veterinarians’ analyses (Kim, 2024).
This paper will focus on the prediction of whether the
pet will be adopted or not from the shelter based on
data of some basic information and traits of the pet.
Multiple algorithms will be utilized to predict the
adoption status and further discussion on the
parameters and layers will be addressed.
The data set file is from Kaggle, “Predict Pet
Adoption Status Dataset”. This paper will first briefly
analyze the data set, including some basic
construction of the data and data visualization.
Multiple models, such as Random Forest, Decision
Tree, Logistic Regression, Neural networks with
Rectified Linear Unit and Sigmoid, will be tested with
different values for each parameter, for example,
n_estimators, min_samples_leaf, max_depth,
min_samples_split, etc. and by comparing the general
result of these models, the best option with higher
accuracy and efficiency will be selected with further
modification on the parameters and model structure
to ensure its best performance. Some possible future
developments and applications of this model
approach will also be addressed later.
2 METHOD
2.1 Dataset Preparation
The data information is from Kaggle, which offers an
in-depth overview of the factors that may affect a
pet's chances of being adopted from a shelter. The
data contains a total number of 2, 007 pets, or 2, 007
rows with 13 columns of pet characteristics and
attributes, such as pet type, breed, color, size, etc.
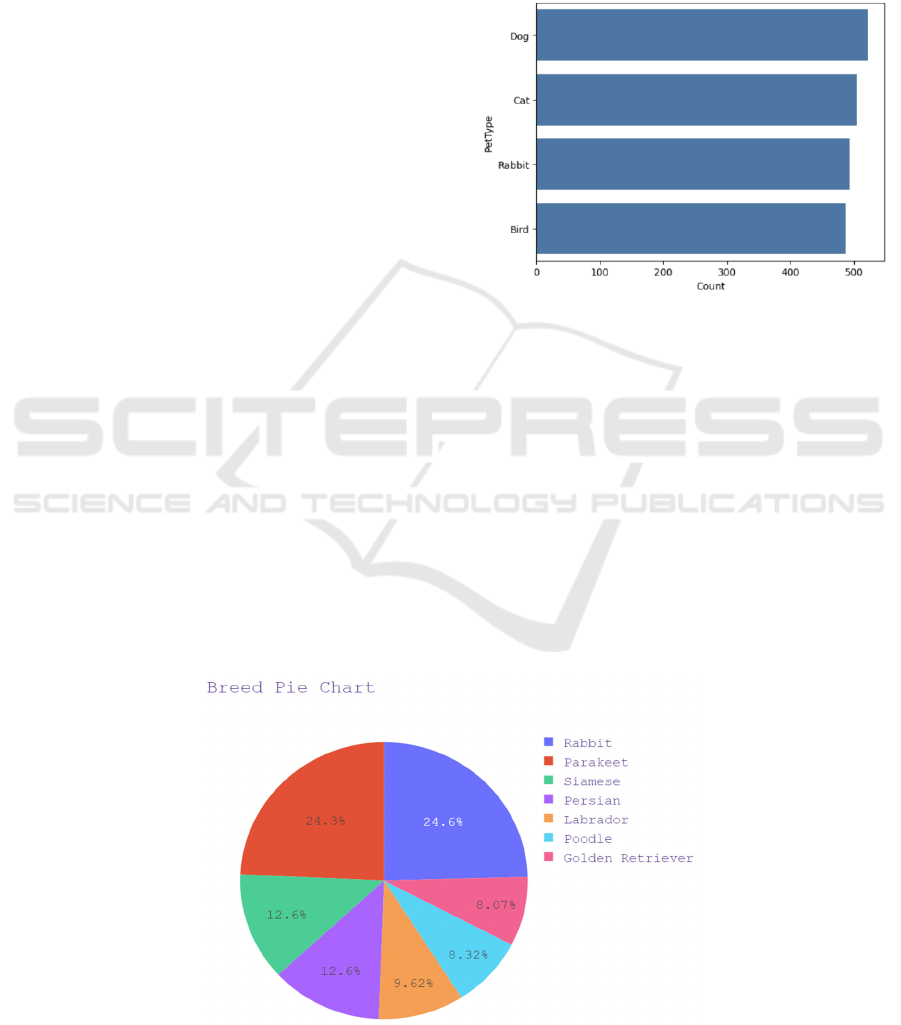
There are a total of four pet types: dog, cat, bird and
rabbit (the amount of each is shown in Figure 1) with
seven different breeds shown in Figure 2.
Figure 1: Pet type counts (Photo/Picture credit: Original).
Besides the pet type and breed, the rest data are
briefly shown in Figure 3 with bar diagrams. The
prediction is designed to be a classification task,
where for each pet, it will be predicted as adopted or
otherwise unadopted.
Before the model constructions and training, data
preprocessing is required for all the testing models. In
order to simplify the data, the first and last columns
which represent the pet ID and pet adoption
likelihood will be dropped and the target, adoption
likelihood, needs to be stored. For all models, 80% of
the data is splitted for training and the rest 20% for
testing; the random state is set to 42. Then, by
separating the numerical and categorical columns,
Figure 2: Breed percentile pie chart (Photo/Picture credit: Original).
Pet Adoption Status Prediction Based on Multiple Machine Learning Models
363
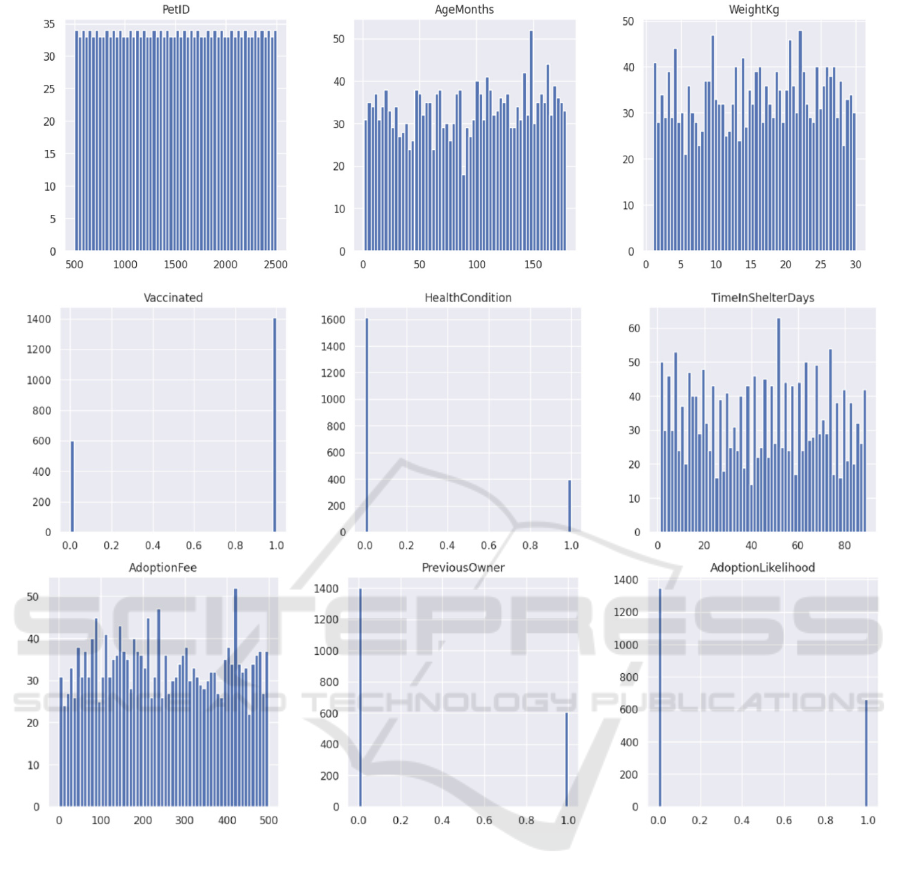
Figure 3: Other basic information data visualization (Photo/Picture credit: Original).
each null value in the numerical column will be filled
with mean and each categorical column will be
converted to a binary column.
2.2 Machine Learning Models-Based
Prediction
This study used four models: Random Forest (RF)
(Rigatti, 2017), Decision Tree (DT) (Song, 2015),
Logistic Regression (LR) (LaValley, 2008) and
Artificial Neural Network (ANN). RF, DT and LR are
constructed using sklearn, whereas tensorflow is
utilized for ANN construction. Models will be mainly
evaluated by their accuracies on predictions and the
time efficiency will also be slightly taken into
consideration.
2.2.1 Random Forest
RF operates by constructing a multitude of decision
trees during training. Generally speaking, by
averaging multiple decision trees each built on a
diverse subset of the data (bootstrap samples), RF has
a stable prediction performance and usually low risk
of overfitting; the data that is left Out-of-Bag (OOB)
can be used to estimate the model's performance,
providing an unbiased estimate of the test error
without needing a separate validation set. Individual
trees are trained separately but parallel which makes
RF scalable for large datasets. Here, for the adoption
prediction classification tasks, each tree in the forest
votes for a class, and the class with the most votes is
chosen as the final prediction.
MLSCM 2024 - International Conference on Modern Logistics and Supply Chain Management
364

In this study, RF is optimized using
GridSearchCV with four parameters. n_estimators
represent the number of trees in the forest, ranging
from 100 to 1000, where more trees can improve
accuracy but meanwhile increase computation time.
The maximum depth (max_depth) of each tree is set
to None (unlimited) or restricted to 10, 20, or 30. The
minimum number of samples (min_samples_split)
required to split an internal node is set to 2, 5, or 10,
influencing the model's complexity.
min_samples_leaf sets the minimum number of
samples required to be at a leaf node, ranging from 10
to 100, which controls overfitting by ensuring each
leaf has enough data.
2.2.2 Decision Tree
DT is a tree-like structure where each internal node
represents a decision based on a feature, each branch
represents the outcome of the decision, and each leaf
node represents the final output or decision. As
mentioned above in RF, the data will be splitted into
subsets until the outputs are pure at the leaf node. The
splitting usually happens from the root into two or
more homogeneous data sets based on the most
significant feature and recursively on each derived
subset. After the tree has been fully grown, if needed,
trees can be pruned by removing branches that have
little importance to avoid overfitting. Moreover, DT
can rank features by importance and the missing
values can be either ignored or by considering
multiple possible outcomes.
As stated, DT is part of RF. Therefore, the
parameters are similar, and for DT in this study,
max_depth from 10 to 70 or None, min_samples_split
between 2 and 20, and min_samples_leaf from 1 to 8.
Besides, the split strategy (splitter) is either "best" for
optimal splits or "random" for random splits.
2.2.3 Logistic Regression
LR is commonly used in binary classification tasks,
which fits the pet adoption prediction. The model
assumes a linear relationship between the
independent variables (the input) and the log-odds of
the dependent variable (the outcome). The logistic
function, also called sigmoid, will transform any real-
valued input to a value between 0 and 1 with the
formula, where z is the linear combination of input
features and their corresponding coefficients.
Usually, as well as in this study, the threshold is set
to 0.5, where a result greater than 0.5 predicts the
positive class, otherwise negative class. Besides
binary classification, LR can be extended to
multiclass classification using techniques like One-
vs-Rest (OvR) or softmax regression.
In this study, the inverse of regularization strength
(c) is set in the range from 0.01 to 100. Some optimize
options (solver) include ‘newton-cg', 'lbfgs' and 'sag',
which impacts convergence speed and model
accuracy.
2.2.4 Artificial Neural Network
ANN is characterized by its human brain’s structure,
usually consisting of multiple interconnected layers
of nodes, or "neurons," that process and transmit
information. The model stimulates how the human
brain processes input information and makes
reactions and decisions. Each neuron receives input,
passes it into the assigned activation function which
allows ANN to model non-linear relationships and
then conveys the output to the next layer. Connections
between neurons have weights, which determine the
strength of it. This weight and the bias added to the
input of neurons will keep being updated when the
error is propagated backward through the network.
This ANN model will be constructed with 3 layers
of Rectified Linear Unit (ReLU) and 1 more layer of
sigmoid as output layer. The first and last layers of
ReLU are set to have the same number of neurons
(20) as the input shape. The number of neurons in the
middle layer of ReLU will be the best option between
40 to 80. Adaptive Moment Estimation (Adam) is
chosen as the optimizer for faster convergence and
acceleration in the relevant direction and dampen
oscillations, with the loss set as 'binary_crossentropy'
and metrics set as 'accuracy'. Epochs will vary in
range from 30 to 90.
3 RESULT AND DISCUSSION
The training and testing accuracies for RF, DT and
LR models are shown in Table 1, and the test result
for ANN is listed in Table 2 and Table 3.
Table 1: Accuracy and AUC in training and testing.
RF DT LR
Accuracy
in Training 0.9495327103 0.9426791277 0.9158878505
Accuracy
in Testing 0.9129353234 0.9179104478 0.8855721393
AUC in
Train 0.9668213326 0.9842749416 0.9343185955
AUC in
Test 0.9207912458 0.9102553311 0.9225028058
Pet Adoption Status Prediction Based on Multiple Machine Learning Models
365

Table 2: Accuracy with epoch from 30 to 90 and number of middle layer neuron from 40 to 80.
Number of
Middle Layer
Neuron
Epoch = 30 Epoch = 40 Epoch = 50 Epoch = 60 Epoch = 70 Epoch = 80 Epoch = 90
40 0.9606 0.9655 0.9873 0.9936 0.9927 0.9954 0.9998
50 0.9718 0.9781 0.9883 0.9948 0.9974 1.0000 1.0000
60 0.9432 0.9772 0.9924 0.9984 0.9986 1.0000 1.0000
70 0.9557 0.9811 0.9906 0.9984 0.9998 1.0000 1.0000
80 0.9597 0.9913 0.9971 0.9983 1.0000 1.0000 1.0000
Average
Accurac
y
0.9582 0.9786 0.9911 0.9967 0.9977 0.9991 1.0000
Table 3: Loss with epoch from 30 to 90 and number of middle layer neuron from 40 to 80.
Number of
Middle
Layer Neu
r
Epoch = 30 Epoch = 40 Epoch = 50 Epoch = 60 Epoch = 70 Epoch = 80 Epoch = 90
40 0.1099 0.1066 0.0536 0.0331 0.0261 0.0215 0.0062
50 0.0918 0.0725 0.0458 0.0253 0.0201 0.0043 0.0034
60 0.1523 0.0714 0.0364 0.0171 0.0168 0.0093 0.0023
70 0.1071 0.0659 0.0361 0.0141 0.0060 0.0041 0.0046
80 0.1117 0.0473 0.0218 0.0183 0.0066 0.0043 0.0038
Average
Accurac
y
0.1146 0.0727 0.0387 0.0216 0.0151 0.0087 0.0041
Each data in Table 2 and Table 3 was the average
result of 5 training sessions with the corresponding
epoch and middle layer neurons. Clearly, by
comparing the data in two tables, ANN achieves a
general higher accuracy above 0.95 than the other
three models which have accuracy around 0.90.
Focusing on ANN, it can be seen that with the same
amount of middle layer neurons, as the epoch
increases, the accuracy generally increases and the
loss decreases. However, after reaching about 60
epochs, the increasing trend for accuracy and
decreasing trend for loss becomes somewhat
unpredictable, which shows that even though the data
with higher epochs have a better accuracy and less
loss, it may risk potential overfitting. Similarly, with
the same number of epochs, the suitable range for the
number of neurons lies around 60, where there is a
trend of increasing when less than 60 neurons and
almost no improvement when greater than 60
neurons. Therefore, the suitable model chosen in this
study, achieving an accuracy above 0.99, is a four-
layer ANN consisting of three layers of ReLu and one
more output layer as Sigmoid with both the number
of the middle ReLU layer neuron and epoch around
60 and the neurons in the first and last ReLU layers
set to 20.
There might be a bunch of reasons that ANN
outperformed in this study. As an activation function,
ReLU introduces non-linearity into the model,
allowing it to capture complex relationships in the
data. In contrast, DT may struggle with complex non-
linear patterns and LR models cannot even process
non-linear patterns. Furthermore, ANNs can
implicitly learn interactions between features through
their layered structure. Even though RF does consider
interactions through the aggregation of multiple
decision trees, they might still miss certain subtle
interactions that a neural network can learn. By using
gradient descent and backpropagation, ANN can
efficiently optimize complex loss landscapes and find
patterns that might be hard for non-gradient-based
methods to identify, such as tree-based methods using
greedy algorithms to split nodes, which might not find
the optimal splits for complex data structures.
Due to the limit of resources, device and time,
some complex parameters for RF, DT and LR are not
included in the test, such as criterion, max_feature,
tol, max_iter, etc. By adding these parameters, the
models may be enhanced in accuracy but will
definitely take much longer time to process.
Meanwhile, since each testing result recorded in
Table 2 and Table 3 is just the average of 10 training
results, there can be some bias due to the random
MLSCM 2024 - International Conference on Modern Logistics and Supply Chain Management
366

seed. More trials for each parameter may reflect a
more reliable and representative overview of the
accuracy of the setting. In order to possibly enhance
the accuracy of the prediction, in addition to the pet
information already included in the data set, some
other pet features and specific basic information can
be added into the data set such as sterilization,
biological antibody, inherent disease, etc. A very
representative or decisive information is likely to
greatly promote the accuracy and efficiency of the
model.
4 CONCLUSIONS
In this study, ML is used to predict the adoption status
for pets based on some specific pet characteristics and
information. After the preprocessing which removes
some useless columns and separate the categorical
and numerical columns, multiple models, including
RF, DT, LR and ANN are then applied into ML. In
order to find the most suitable model with the highest
accuracy, different parameters are tested and the
result shows that the 4 layers (3 layers of ReLu and 1
layer of Sigmoid) ANN model with epoch and the
number of neurons in the second ReLu layer both
around 60 and the neurons in the first and last ReLU
layers set to 20. For any future study with similar data
sets, it is essential to choose and evaluate the model
data-dependently, since if the data set is not complex
enough to warrant a deep learning approach, simpler
models, such as linear regression, naive bayes, etc.
may outperform an ANN or any model mentioned in
this study. Adding more representative and decisive
pet information is also encouraged in future ML
processes.
REFERENCES
Amirhosseini, M. H., Yadav, V., Serpell, J. A., Pettigrew,
P., & Kain, P. 2024. An artificial intelligence approach
to predicting personality types in dogs. Scientific
Reports, 14(1), 2404.
Hajek, A., Peltzer, K., Veronese, N., König, H. H., & Gyasi,
R. M. 2024. Pet ownership and psychosocial outcomes
among the oldest old in Germany during the Covid‐19
pandemic. Findings based on the nationally
representative “Old Age in Germany (D80+)”.
International journal of geriatric psychiatry, 39(7),
e6127.
Hussein, S. M., Soliman, W. S., & Khalifa, A. A. 2021.
Benefits of pets’ ownership, a review based on health
perspectives. J. Intern. Med. Emerg. Res, 2, 1-9.
Kim, S. C., & Kim, S. 2024. Development of a Dog Health
Score Using an Artificial Intelligence Disease
Prediction Algorithm Based on Multifaceted
Data. Animals, 14(2), 256.
LaValley, M. P. 2008. Logistic regression.
Circulation, 117(18), 2395-2399.
Megna, M. 2024. Pet ownership statistics 2024. Forbes.
https://www.forbes.com/advisor/pet-insurance/pet-
ownership-statistics/
Rigatti, S. J. 2017. Random forest. Journal of Insurance
Medicine, 47(1), 31-39.
Singh, S., & Sunoj, R. B. 2023. Molecular machine learning
for chemical catalysis: Prospects and challenges.
Accounts of Chemical Research, 56(3), 402-412.
Song, Y. Y., & Ying, L. U. 2015. Decision tree methods:
applications for classification and prediction. Shanghai
archives of psychiatry, 27(2), 130.
Zeng, Q., Sun, W., Xu, J., Wan, W., & Pan, L. 2024.
Machine Learning-Based Medical Imaging Detection
and Diagnostic Assistance. International Journal of
Computer Science and Information Technology, 2(1),
36-44.
Pet Adoption Status Prediction Based on Multiple Machine Learning Models
367
