
Improving Model Generalization in Songs’ Popularity Prediction
Based on Datasets with Diverse Distributions
Hongzhan Yao
a
Rutgers Preparatory School, New Jersey, U.S.A.
Keywords: Machine Learning, Songs’ Popularity Prediction, Model Generalization Performance.
Abstract: Online streaming music platforms offer publics a more convenient getaway to enjoy music. It also benefits
the music creators that getting fortunes from their songs. However, the factors for a songs’ success are not
apparent for most of the listeners. With the help of Artificial Intelligence, making prediction of songs
popularity gets easier. This study chooses an updated dataset including various song track information on
Spotify. Three relevant models including Random Forest, Decision Tree, K-Nearest Neighbor are train and
tested with different data splitting strategy and training strategy with the dataset about Spotify. Model’s
performances are analyzed and visualized after the test. The research attempt to improve the original models
with different improving strategies. The research finds that using more and relatively diverse data can help to
improve the performance of the data. Using data that corresponded to the target prediction task could strongly
improve the models on some specific tasks. Using random data to adjust original models may have negative
impact to the models’ performance.
1 INTRODUCTION
The online streaming music platforms provide people
a convenient and accessible way to listen to music as
the fast development of the internet. They facilitate
the distribution of music records and attract more
individual music creators to post their music online,
which forms a tremendous market all around the
world. The global music streaming market size was
estimated at USD 34.53 billion in 2022 and is
expected to grow at a Compound Annual Growth
Rate (CAGR) of 14.4% from 2023 to 2030
(Grandviewresearch, 2023). These online platforms
boot the popularity of the song tracks and make
fortunes for the artists. For every stream play, the
artists get about 0.0032 USD (Soundcharts, 2019). In
order to promote the income for musicians, machine
learning algorithms can be considered to predict the
popularity of songs.
In previous research, researchers made progress in
building models that reached a relatively high
accuracy. Feng tested multiple algorithms in
popularity prediction of music and concluded that
XGBOOST achieved the best performance (Feng,
2023). Similar to Feng’s research, 2010s research
a
https://orcid.org/0009-0007-4684-7759
from Stanford University applied three ways to
predict the popularity of the songs and achieved a
relatively acceptable accuracy. In addition, the
research also identified the importance of each factor
to the popularity (Pham, 2016). Based on the research
by David and following researchers, the creation of
SpotGenTrack Popularity Dataset is regarded as the
substitute choice for conventional dataset since it
integrated song information from different stream
platforms. The new architecture of multimodal end-
to-end Deep Learning called HitMusicNet is made to
predict the popularity of music (Martín-Gutiérrez,
2020). The research from Lee applied other
conventional acoustic features including MPEG-7
and Mel-frequency Cepstral Coefficient (MFCC)
features in model training which helped to improve
the accuracy (Lee, 2018). Kim provides the analyses
result of 2010~2019 top 50 music on Spotify, figured
out 8 key features of popularity song (Kim, 2021).
The research from Ge uses Principal Component
Analysis (PCA) and model blending achieved a
comparatively low square error: 4.96 (Ge, 2020).
However, the investigation of these models’
performance on small groups music and neo music is
limited. The trend of music always changing,
342
Yao, H.
Improving Model Generalization in Songs’ Popularity Prediction Based on Datasets with Diverse Distributions.
DOI: 10.5220/0013330900004558
In Proceedings of the 1st International Conference on Modern Logistics and Supply Chain Management (MLSCM 2024), pages 342-348
ISBN: 978-989-758-738-2
Copyright © 2025 by Paper published under CC license (CC BY-NC-ND 4.0)
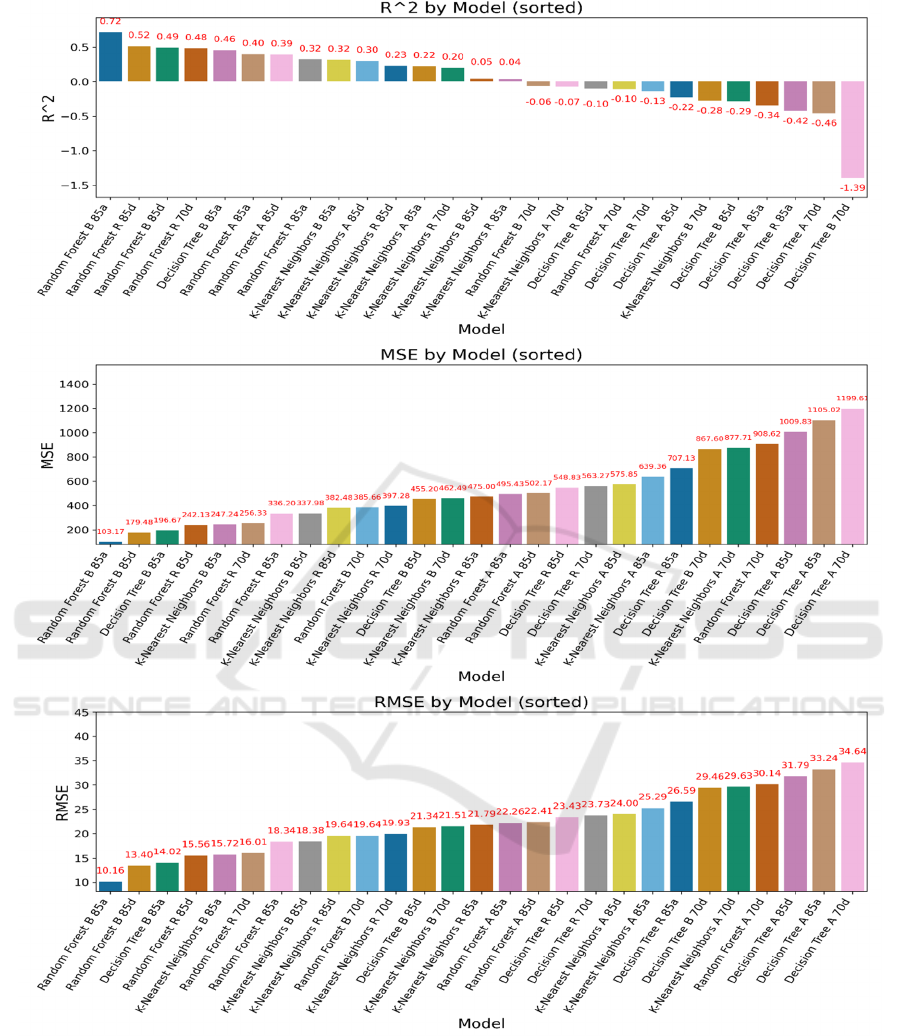
Figure 1: The performance of models-1 (Photo/Picture credit: Original).
traditional models may get less accurate and reliable
when they meet the challenge of new genre and new
artists because people’s understanding of beauty is
also changing. This paper aims to test the
performance reliability of the traditional models from
previous research and release an advanced version of
method. This study will train these models from
widely used dataset and test them with track data
recently released and test the performance of each
model. Finally, this paper will try to improve the best
performed model, and reach a higher accuracy.
Improving Model Generalization in Songs’ Popularity Prediction Based on Datasets with Diverse Distributions
343
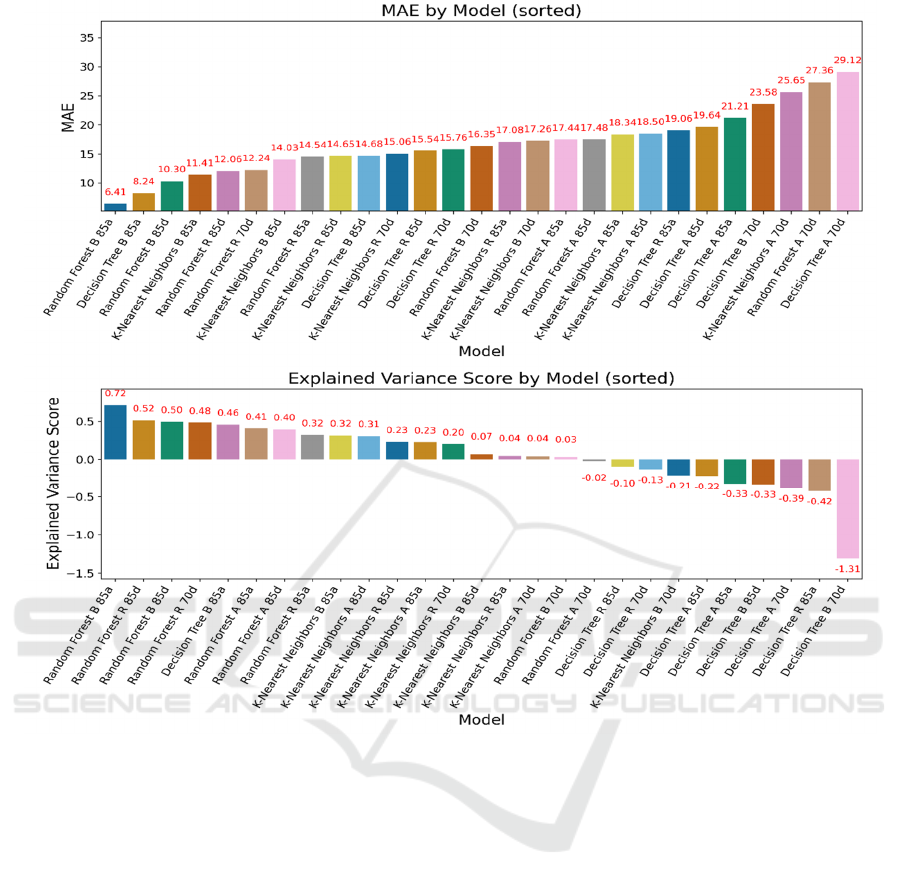
Figure 2: The performance of models-2 (Photo/Picture credit: Original).
2 METHOD
2.1 Dataset Preparation
For the selection of dataset, this study chooses the
114, 000 Spotify Songs from Kaggle generated by
Priyam with 1000 song tracks in one genre and it
includes 114 different genres (Kaggle, 2024). It has
multiple tags of each song and provide popularity
data presented as percentage (0-100). This research
applies parameters such as "artists","album_name" in
model trainings and trying to predict the exact
popularity of each song by using regression models.
The raw dataset is read by function read_csv() in
panda. And the dataset is cleaned by dropping blank
data and a blank collum and standardize by function
StandardScaler() in panda. For the data in string form:
“artists”, “track genre" and “track name”, they are
replaced using the same string with same value to
guarantee the full utility of all data in this research.
The plots of different genres are drawn, to assist
to split the whole dataset in different ways. These
plots including mean, standard deviation, median,
skewness, kurtosis and interquartile range of
popularity by track genre. In addition, the scatter plots
“Mean verses Standard Deviation” and “skewness
verses kurtosis” to help view the stability and
diversity of different music genres. These plots help
the researcher to have apparent and visualized view
to find out the patterns and characteristics of the data.
In this research, there are three methods to split
the whole dataset into 70 percent (80 genres) of
training set, 15 percent (17 genres) of valuation set
and 15 percent (17 genres) of testing set: 1) Split all
genres randomly into all three groups (R: random) 2)
Choose genres which mean are in range of 15-60, and
Standard Deviation are in range of 5-25 for training
MLSCM 2024 - International Conference on Modern Logistics and Supply Chain Management
344
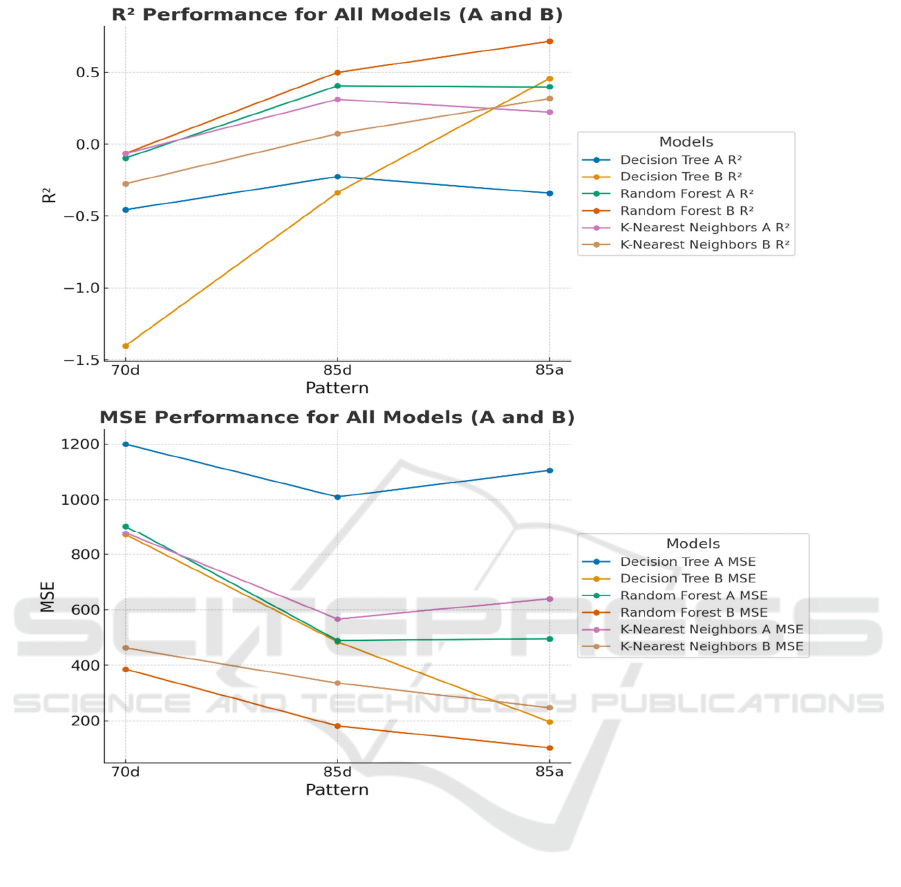
Figure 3: The performance of models (R) (Photo/Picture credit: Original).
set and remaining genres are divided into valuation
and testing set randomly. 3) Choose genres which the
absolute value of skewness is in range of 0-2, and the
absolute values of Kurtosis are in 0-2.1 for training
set and remaining genres are divided into valuation
and testing set randomly.
Different splitting strategies are designed to
observe how would models would respond to training
set in different variety. The researcher is intentionally
to split raw dataset. For splitting strategy B and C
which contains high concentrated and low variety
genres, models are predicted to be over fitting if they
are only trained on training set. However, if the
performance of these overfitting models may be
improved by evaluating on valuation set and perform
better on test set.
2.2 Machine Learning Models-Based
Prediction
This study applies decision tree regressor (DT),
random forest regressor (RF) and K-Nearest
Neighbor regressor (KNN) from Ski-learn. Ski-learn
is a widely used machine learning library in python.
It provides convenient traditional machine learning
models for researchers. Following is the brief
introduction of these models.
2.2.1 DT
Decision Tree is the model that is constructed by
different decision nodes (Song, 2015). The data is
input from the root and classified by layers of
decision nodes and goes to of leaf node that present a
Improving Model Generalization in Songs’ Popularity Prediction Based on Datasets with Diverse Distributions
345
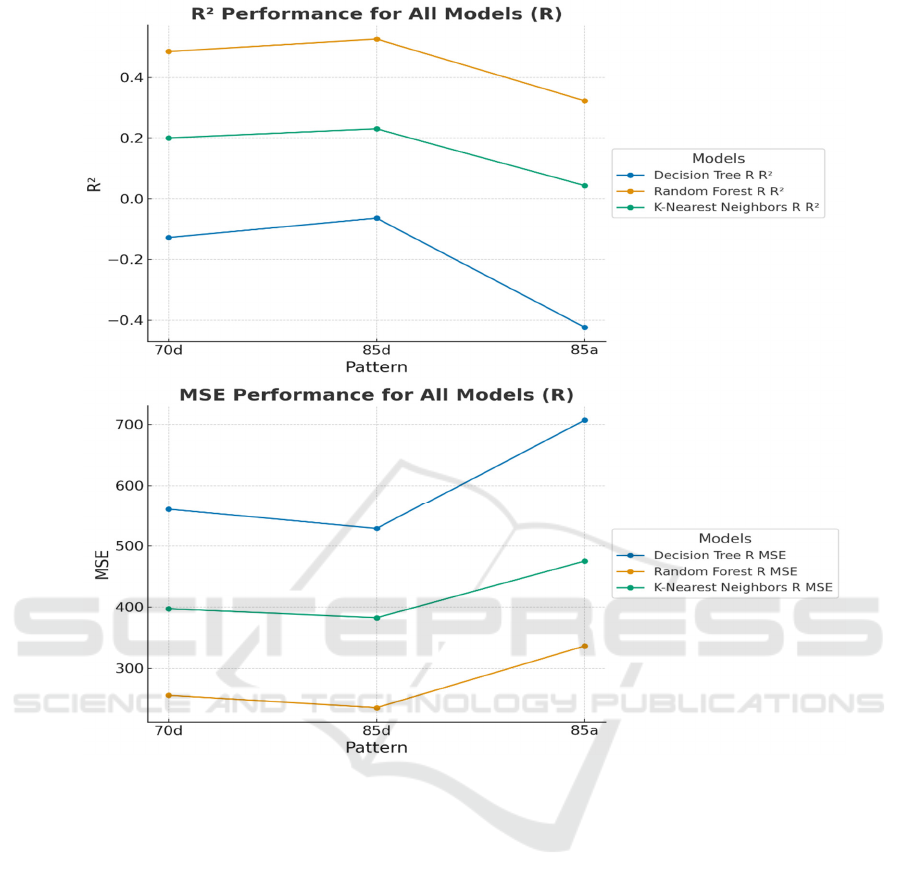
Figure 4: The performance of models (A and B splits) (Photo/Picture credit: Original).
specific pattern of the data in it. The benefit of this
model is it take less time to train and run and it is easy
to understand every node’s function. For this
research, this model can predict songs in the fastest
way and let researchers understand what kind of
songs are popular.
2.2.2 RF
Random Forest is the set of decision trees, which can
reduce the effect of noise and improve the accuracy
of the model. It has high efficiency and good
elasticity to evaluate different data. However, this
model is less explainable than Decision tree, it takes
larger computing to predict.
2.2.3 KNN
For predicting nodes in KNN, it’s value will be the
mean value of its N- nearest neighbors. This model is
sensitive to the structure of a particular part of the
dataset. It is faster than random forest and can give a
relatively high accuracy in dataset in lower
dimensions.
2.3 Implementation Details
For each model, this paper trained 3 models with
following training strategy for each raw model: 1)
Strategy 70d: Train model with training set (70%)
only. 2) Strategy 85d: Train model with another lager
training set (85%), which is the combination of the
training set (70%) and the valuation set (15%). 3)
Strategy 85a: Train model with training set (70%)
first, and adjust the model with valuation set (15%)
This research applies following context to name a
model: “model name (DT/RF/KNN) + data splitting
strategy (A, B, R) + training strategy(70d/85d/85a)”.
Finally, the model will be saved and test with the test
MLSCM 2024 - International Conference on Modern Logistics and Supply Chain Management
346

set (15%). The performance evaluation indexes
including: 𝑅
, Explained Variance Score (EVS) by
Model, Mean-square Error (MSE), Root Mean-
square Error (RMSE), Mean Absolute Error (MAE).
These indexes help us to evaluate the performance
and the stability of each model. These indexes will
plot in 5 different forms, for a better observation of
the model.
3 RESULTS AND DISCUSSION
For each model, after the training, the researcher plots
each model’s evaluation index sorted by performance
form best to worse. The results are shown in Figure 1
and Figure 2.
From the Figure 1 and Figure 2, Generally, the
Random Forest regressor performs the best, following
models are K-NN and DT has the worst performance.
In all the model “RF B 85a” has the best performance
in all indexes, reaching 0.72 𝑅
, and 10.16 RMSE,
Which representee stability and relatively good
performance of the model. However, most of the
models based on Decision Tree has negative index on
𝑅
and EVS, that indicate decision trees are not
suitable for this task. K-NN based models has a
relatively middle performance, but still not as good as
DT models.
The performance of ‘70d’ models are worse than
85d models shown in Figure 3. Thus, for random
distributed dataset, using lager training dataset can
surlily improve the performance of models. For all
models, the ‘85d’ performance is better than ‘85a’
training plan. Is not a good way to train twice when a
researcher is working on a random distributed data.
The second training may cause the overfitting to
valuation dataset.
Form these plots shown in Figure 4, it can be
observed that as this study used more data and diverse
data to train the model, the 𝑅
and MSE performance
will get better. However, the training method on
specialized datasets are various. For most of the
models, using ‘85d’ or ‘85a’ does not make a
significant performance difference of the model.
Using ‘85a’ may even loss the accuracy due to the
overfitting to the valuation set. But if the data for
predicting has a significant pattern corresponded to
the valuation set, the model’s performance would get
boost because of the valuation set.
Due to the limited data and time, the researcher
cannot develop auto collection programs to collect the
real-time data form Spotify through Api. The data
cleaning is not rough that some of the songs’
popularity is default value, which is 0. This noise can
make a significant effect to the accuracy of the
models. The connection between the popularity and
different factors still need to discuss.
4 CONCLUSIONS
This study tested the performance of three widely
used based models with different training methods.
And visualized the performance of these models. And
discussed the notice when applying these models into
research study.
For this regression task, the Random Forest is the
most effective and reliable over all models. When the
model is facing random or highly diverse data, they
should not valuate the models again. If the data in
prediction task has a relatively similar pattern, the
valuation training would be effective for the
specialized models.
For the further research, the researcher can test
more advanced models and collecting more mount
and updated song tracks data with scripts and api
tools. This task is just one class that make predictions
on various variables without the direct connections
with the answer. However, the conclusion of this
research can apply to many other tasks. The
improvement of accuracy can help the artists to
predict their popularity and make better songs that fit
people’s need. These models can utilize for
merchandizing to make more profit.
REFERENCES
Feng, Z. 2023. Song popularity prediction using machine
learning.
Ge, Y., Wu, J., & Sun, Y. 2020. Popularity prediction of
music based on factor extraction and model blending.
In 2020 2
nd
International Conf. on Economic
Management and Model Engineering (ICEMME) (pp.
1062-1065). IEEE.
Grandview research, 2023, Music Streaming Market Size
& Share Analysis Report, https://www.grandviewrese
arch.com/industry-analysis/music-streaming-market
Kaggle, 114000 Spotify Songshttps://www.kaggle.com/
datasets/priyamchoksi/spotify-dataset-114k-songs
Kim, J. 2021. Music popularity prediction through data
analysis of music’s characteristics. International
Journal of Science, Technology and Society, 9(5), 239-
244.
Lee, J., & Lee, J. S. 2018. Music popularity: Metrics,
characteristics, and audio-based prediction. IEEE
Transactions on Multimedia, 20(11), 3173-3182.
Martín-Gutiérrez, D., Peñaloza, G. H., Belmonte-
Hernández, A., & García, F. Á. 2020. A multimodal
end-to-end deep learning architecture for music
popularity prediction. IEEE Access, 8, 39361-39374.
Improving Model Generalization in Songs’ Popularity Prediction Based on Datasets with Diverse Distributions
347

Pham, J., Kyauk, E., & Park, E. 2016. Predicting song
popularity. Dept. Comput. Sci., Stanford Univ.,
Stanford, CA, USA, Tech. Rep, 26.
Song, Y. Y., & Ying, L. U. 2015. Decision tree methods:
applications for classification and prediction. Shanghai
archives of psychiatry, 27(2), 130.
Soundcharts, 2019, What Music Streaming Services Pay
Per Stream (And Why It Actually Doesn’t
Matter) https://soundcharts.com/blog/music-
streaming-rates-payouts
MLSCM 2024 - International Conference on Modern Logistics and Supply Chain Management
348
