
AI-Driven Lung Cancer Screening: A Comparative Analysis of
Machine Learning Models
Peilin Li
1a
, Shirui Lyu
2* b
and Peter Niu
3c
1
Aquinas International Academy, Ontario, U.S.A.
2
Computer Science, University of Nottingham, Nottingham, U.K.
3
The Erindale Academy, Mississauga, Canada
*
Keywords: Artificial Intelligence, Lung Cancer Prediction, Machine Learning.
Abstract: This study explores the application of artificial intelligence (AI) in the field of lung cancer screening,
evaluating the performance of three machine learning models: Random Forest, K-Nearest Neighbors (KNN),
and Decision Tree. The Random Forest model emerged as the most accurate, with an overall accuracy of
88.2% and a balanced performance across both classes, indicating its superior generalization capability for
new data subsets. Feature importance analysis revealed that 'Age' was a significant predictor in both Random
Forest and Decision Tree models, highlighting its predictive value in the dataset. The KNN model, while
achieving an accuracy of 81.6%, exhibited a performance imbalance, particularly struggling with class 0
samples, likely due to insufficient clustering or separation between classes. The Decision Tree model's lower
accuracy was attributed to potential overfitting in the training subset, capturing noise specific to the training
data and reducing its generalization ability. Notably, 'Chronic Disease' was found to be a highly important
feature in the Decision Tree model, suggesting a biased decision rule. Overall, the findings underscore the
potential of AI in enhancing lung cancer screening and the importance of feature selection and model
generalization in achieving accurate predictions.
1 INTRODUCTION
Lung cancer is one of the malignant tumors with the
highest morbidity and mortality worldwide and poses
a serious threat to human health. According to the
International Agency for Research on Cancer, the
number of new lung cancer cases worldwide is
expected to reach 2.48 million in 2022, with about
106.06 million new cases in China, accounting for
about 42.766 percent of the global total. The main
causes of lung cancer include smoking, air pollution,
occupational exposure, genetic factors, and chronic
lung disease. Smoking is considered the most
important preventable risk factor, accounting for
about 85% of all lung cancer cases. The harm of lung
cancer is not only reflected in the high mortality rate,
but also includes the significant decline in the quality
of life of patients (Minna, 2002; Tao, 2019; Wistuba,
2016). However, the traditional lung cancer diagnosis
a
https://orcid.org/0009-0004-7133-8444
b
https://orcid.org/0009-0006-0764-2921
c
https://orcid.org/0009-0007-5024-9516
methods mainly rely on the manual judgment of
doctors, there is a high rate of misdiagnosis and low
efficiency, especially in the early screening stage, and
the labor cost is relatively high. Therefore, there is an
urgent need to explore more efficient auxiliary
diagnosis using some advanced methods. Artificial
Intelligence (AI), as an emerging technology, has
strong feature extraction and prediction capabilities,
and can provide more accurate auxiliary support in
imaging data analysis, which can be considered in this
scenario.
Due to the development of machine learning, and
deep learning, AI has achieved great progress that
cannot be ignored, and is moving towards
diversification, refinement and precision. There are
numerous AI-based models developed, such as
random forests and neural networks. They all have the
ability to solve practical problems without exception
and play a role in some professional fields. The da
310
Li, P., Lyu, S. and Niu, P.
AI-Driven Lung Cancer Screening: A Comparative Analysis of Machine Learning Models.
DOI: 10.5220/0013329700004558
In Proceedings of the 1st International Conference on Modern Logistics and Supply Chain Management (MLSCM 2024), pages 310-314
ISBN: 978-989-758-738-2
Copyright © 2025 by Paper published under CC license (CC BY-NC-ND 4.0)

Vinci surgical robot developed by Intuitive Surgical
in the United States is a good example. It can already
perform cardiothoracic surgery, gynecology and
general surgery. AI is also used in the prediction of
diseases and epidemics. For instance, during the
covid-19 epidemic, China's Alibaba Damo Academy
developed an AI-driven epidemic prediction model.
This model predicts the development trend of the
epidemic by analyzing real-time data, helping
governments and health organizations to formulate
response strategies; Google's DeepMind has
developed a predictive AI called the AlphaFold
project and successfully predicted the protein
structure related to SARS-CoV-2 (the virus that
causes COVID-19). This achievement helps scientists
understand the biological characteristics of the virus
more quickly and accelerates the development of
vaccines and drugs. In terms of personalized
medicine, the AI model developed by Illumina has
done an excellent job. It accelerates the analysis of
DNA sequencing data and helps identify genetic
variants that cause diseases. Through AI, scientists
can discover the association between specific genes
and specific diseases or characteristics to help predict
disease risks. However, it can be found that most
widely used AI models are basically considering
independent and identically distributed situations,
and there are few in-depth studies on the versatility
and compatibility of the models, that is, different
distribution predictions. So this study aims to develop
the model in this research direction for evaluating the
applicability of machine learning models.
In this study, we used a dataset from Kaggle. The
dataset was preprocessed to remove missing values
and normalize the features. In order to explore model
performance with different data distributions, the K-
means clustering algorithm (K=2) was applied to
divide the dataset into two distinct subsets. These
subsets were labeled as A and B and further saved as
separate CSV files for latter analysis. We trained
three machine learning models — Decision Tree,
Random Forest, and K-Nearest Neighbors (KNN)—on
subset A. Model training procedures including
hyperparameter tuning using a grid search approach
and cross-validation were aimed to optimize
performance. To evaluate model generalization, the
trained models were directly tested on subset B. We
assessed model performance by comparing results
across the different algorithms with accuracy, F1-
score, and ROC-AUC metrics.
2 METHOD
2.1 Dataset Preparation
In this study, we used a dataset from Kaggle,
including 15 features and 1 target variable. The
dataset was preprocessed to remove missing values
and normalize the features. In order to explore model
performance with different data distributions, the K-
means clustering algorithm (K=2) was applied to
divide the dataset into two distinct subsets. These
subsets were labeled as A and B and further saved as
separate CSV files for latter analysis.
2.2 Machine Learning Models
2.2.1 Decision Tree and Random Forest
A decision tree is a popular data mining technique
used for both classification and regression tasks
(Song, 2015; Suthaharan, 2016; Su, 2006). It is
structured like a tree where each internal node
represents a test on an attribute, each branch
represents the outcome of that test, and each leaf node
represents a class label (in classification) or a
continuous value (in regression). Decision trees work
by breaking down a complex decision-making
process into a series of simpler decisions, making it
both easy to follow and interpret.
Random forests introduce randomness and
diversity in multiple ways to build robust predictive
models (Rigatti, 2017; Biau, 2016; Belgiu, 2016).
Firstly, data randomness is employed during the
construction of each decision tree; the algorithm
randomly extracts samples from the training dataset
with replacement, a technique known as Bootstrap,
ensuring each tree uses a different subset of data.
Additionally, feature randomness is applied in the
node splitting process where not all features are
considered; instead, a random subset is selected for
the best split, preventing any single feature from
dominating the trees. Each decision tree is
constructed independently, using different data and
selected features, which may lead to varying
prediction outcomes across trees. In the final
prediction stage, random forests utilize voting for
classification tasks—making a majority decision
based on the predictions from all trees—and
averaging for regression tasks, where the final
prediction value is calculated by averaging the
outputs of all decision trees. This methodology
enhances the model's accuracy and generalizability
by mitigating overfitting and ensuring a diverse set of
predictions.
Random forests have several advantages: 1) Anti-
overfitting: Since each forests tree is built based on a
AI-Driven Lung Cancer Screening: A Comparative Analysis of Machine Learning Models
311
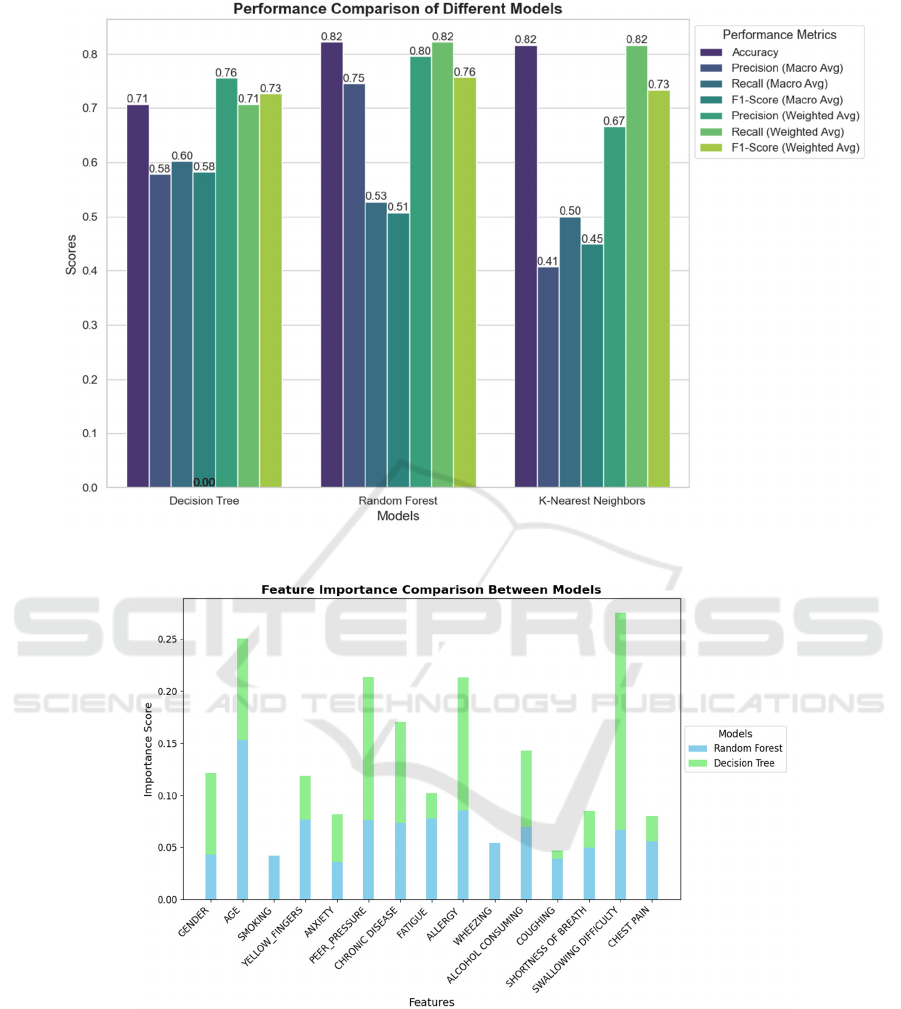
Figure 1: The performance of various models (Photo/Picture credit: Original).
Figure 2: The feature importance of various models (Photo/Picture credit: Original).
different random subset, it is less prone to overfitting
than a single decision tree 2) Strong stability:
Random forests are insensitive to noise and outliers
in the data because it is the result of voting or
averaging multiple trees 3) Strong ability to handle
high-dimensional data: Random forests can
effectively handle data sets with a large number of
features 4) Feature importance evaluation: Random
forests can evaluate the importance of each feature to
the model's prediction results and help understand the
key features in the data
2.2.2 KNN
KNN is a supervised learning algorithm widely used
for classification and regression tasks (Guo, 2003).
MLSCM 2024 - International Conference on Modern Logistics and Supply Chain Management
312

KNN uses distance metrics to classify or predict new
samples based on the assumption that "similar objects
have similar outputs." How the KNN algorithm works
Select the K value: K represents the number of
neighbors, that is, the K neighbors closest to the test
sample are considered when predicting. The process
of it includes multiple steps: 1) Calculate the distance:
For a given test sample, calculate its distance from
each sample in the training set. Commonly used
distance metrics include Euclidean distance,
Manhattan distance, cosine similarity, etc. 2) Select
the nearest K neighbors: Sort the samples in the
training set according to the distance, and select the K
nearest to the test sample. Neighbor. 3) Classification
or regression: Classification task: According to the
categories in the K nearest neighbors, the
classification of the test sample is determined by a
voting mechanism. In other words, the category with
the most occurrences is the predicted category of the
test sample. 4) Regression task: According to the K
nearest neighbors the value is usually taken as the
average value as the prediction result of the test
sample.
KNN has several advantages: 1) Simple and easy
to understand: KNN is one of the simplest machine
learning algorithms, easy to understand and
implement, and does not require a complex model
training process. 2) Parameter-free model: KNN is a
non-parametric algorithm that does not perform
explicit model fitting on the data. It is suitable for data
sets with unknown or complex data distribution 3)
Suitable for small data sets: KNN performs well for
small data sets or when there are not many features
and can effectively classify or regression 4) Can
handle multi-category problems: KNN can be
naturally extended to multi-classification problems
(i.e. not limited to binary classification), and only
needs to select the nearest K samples for voting.
3 RESULTS AND DISCUSSION
The performance of the three ML models was
evaluated using metrics including accuracy, macro-
averaged and weighted-averaged precision, recall,
and F1-Score, as comprehensively presented in
Figure 1. Figure 2, on the other hand, shows the
importance scores of each feature in the decision tree
and random forest models.
The Decision Tree model demonstrated an
accuracy of 70.7%. The macro-averaged precision,
recall, and F1 score were 0.58, 0.60, and 0.58,
respectively. The weighted average precision, recall,
and F1 score were 0.76, 0.71, and 0.73, respectively.
Age and Chronic Disease were identified as the most
impactful features, with importance scores of 40.3%
and 23.5%, respectively.
The Random Forest model achieved the highest
accuracy of 82.1%, with macro-averaged precision,
recall, and F1 scores of 0.75, 0.53, and 0.51,
respectively. The weighted average precision, recall,
and F1 scores were 0.80, 0.82, and 0.76, respectively.
Age and Alcohol Consumption emerged as the most
significant features, contributing 38.6% and 13.4% to
the model's predictions, respectively.
Meanwhile, the KNN model attained an accuracy
of 81.6%. Its macro-averaged precision and recall
were 0.41 and 0.50, respectively, with a macro-
averaged F1 score of 0.45. The weighted average
precision, recall, and F1 scores were 0.67, 0.82, and
0.73, respectively. However, this model exhibited a
notable performance imbalance, with a precision of
0.00 for class 0, suggesting difficulty in correctly
identifying samples from this class.
Among the three models, the Random Forest
demonstrated the highest overall accuracy and
balanced performance across both classes, suggesting
better generalization to new data subset. This
performance may be attributed to the ensemble
learning the nature of Random Forest, which
effectively reduces variance and overfitting. In
contrast, the KNN model's zero feature importance is
anticipated, as it is a distance-based algorithm that
does not have the ability to inherently assign weights
to features during training. Its difficulty in
recognizing class 0 is probably due to the lack of
significant clustering or separation between class
samples. The lower accuracy of the Decision Tree
model may be due to overfitting in the training subset
A. The model captures excessive noise specific in the
training data, thereby reducing its ability to generalize
to unseen data in subset B. Feature importance
analysis indicates that 'Age' is consistently a
significant predictor in both the Random Forest and
Decision Tree models, underscoring its strong
predictive value within this dataset. In contrast,
'Chronic Disease' demonstrated a substantially higher
importance in the Decision Tree model, which may
suggest the presence of a biased decision rule heavily
reliant on this specific feature.
4 CONCLUSIONS
Overall, this study employed a clustering approach to
explore the generalizability of different models in
predicting lung cancer by training the models on one
subset and testing them on the other. We utilised the
K-means algorithm for clustering the original dataset
AI-Driven Lung Cancer Screening: A Comparative Analysis of Machine Learning Models
313

and trained three common machine learning models —
Decision Trees, Random Forests, and the K-Nearest
Neighbors (KNN) — on subset A. In summary, the
Random Forest and the KNN models demonstrate
superior performance in terms of accuracy. However,
the Random Forest model proves more robust in
handling category imbalance, while the KNN model
performs relatively poorly on macro-averaged
metrics. The Decision Tree model, despite its lower
overall accuracy, shows strength in balancing
category performance. These findings suggest that
while Random Forests are a robust choice for datasets
with imbalanced categories, KNN and Decision Trees
may have specific advantages depending on the
performance metrics prioritized. Future studies could
explore advanced techniques such as transfer learning
and domain adaptation to improve model
generalizability across diverse datasets and clinical
settings.
AUTHORS CONTRIBUTION
All the authors contributed equally, and their names
were listed in alphabetical order.
REFERENCES
Belgiu, M., & Drăguţ, L. 2016. Random forest in remote
sensing: A review of applications and future
directions. ISPRS journal of photogrammetry and
remote sensing, 114, 24-31.
Biau, G., & Scornet, E. 2016. A random forest guided
tour. Test, 25, 197-227.
Guo, G., Wang, H., Bell, D., Bi, Y., & Greer, K. 2003. KNN
model-based approach in classification. In On The
Move to Meaningful Internet Systems 2003: CoopIS,
DOA, and ODBASE: OTM Confederated International
Conferences, CoopIS, DOA, and ODBASE 2003,
Catania, Sicily, Italy, November 3-7, 2003.
Proceedings (pp. 986-996). Springer Berlin Heidelberg.
Minna, J. D., Roth, J. A., & Gazdar, A. F. 2002. Focus on
lung cancer. Cancer cell, 1(1), 49-52.
Rigatti, S. J. 2017. Random forest. Journal of Insurance
Medicine, 47(1), 31-39.
Song, Y. Y., & Ying, L. U. 2015. Decision tree methods:
applications for classification and prediction. Shanghai
archives of psychiatry, 27(2), 130.
Suthaharan, S., & Suthaharan, S. 2016. Decision tree
learning. Machine Learning Models and Algorithms for
Big Data Classification: Thinking with Examples for
Effective Learning, 237-269.
Su, J., & Zhang, H. 2006. A fast decision tree learning
algorithm. In Aaai (Vol. 6, pp. 500-505).
Tao, M. H. 2019. Epidemiology of lung cancer. Lung
Cancer and Imaging, 4-1.
Wistuba, I. I., & Gazdar, A. F. 2006. Lung cancer
preneoplasia. Annu. Rev. Pathol. Mech. Dis., 1(1), 331-
348.
MLSCM 2024 - International Conference on Modern Logistics and Supply Chain Management
314
