
Traffic Intersection Optimization Based on Random Forest and
SUMO Simulation in Xi’an
Xianqi Dai
a
Chang'an Dublin International College of Transportation, Chang'an Unversity, Shaanxi, China
Keywords: Traffic Optimization, AutoCAD, Random Forest, SUMO, Traffic Signal Control.
Abstract: With the rapid pace of urbanization, traffic congestion, especially at intersections, has become a significant
challenge in cities like Xi'an, China. This study conducted a comprehensive analysis of traffic congestion
issues, with a specific focus on the intersection of Shang Hong Road and Shang Ji Road, a critical bottleneck
area in Xi'an City. Utilizing AutoCAD for road layout optimization design, the paper simulated the optimized
solution using the SUMO simulation tool. Furthermore, a random forest model was employed to predict traffic
flow, leading to recommendations for optimizing signal light duration and lane configuration. The research
findings indicate that an enhanced traffic network design and signal light configuration can significantly
improve intersection throughput, reduce delay times, and enhance traffic safety. This study provides
scientifically grounded optimization suggestions for urban traffic management authorities, offering practical
measures to improve traffic efficiency, alleviate congestion, and contribute to safer and more sustainable
urban environments.
1 INTRODUCTION
With the acceleration of urbanization, the problem of
traffic pressure has gained increasing attention from
the public, especially in traffic intersections where
heavy congestions seriously hinder the smooth flow
of commuting vehicles (Afrin and Yodo, 2020). For
example, in many cities in China, due to heavy traffic
and unreasonable road design, intersections have been
held up for a long time, causing great inconvenience
to citizens' daily lives. These congestions influence
the travel safety and commute efficiency of citizens.
Moreover, extended periods of stagnation and low
speed of vehicles lead to more greenhouse gas
emissions, resulting in environmental pollution.
Therefore, it is of immense importance to improve the
overall performance of the existing urban
transportation system and the layout of the road
networks to alleviate the congestion at intersections
effectively.
However, the current traffic junction design is
inefficient for signal control and timing, and lane
settings have improper situations. For example, the
traffic signal timing scheme fails to fully consider the
a
https://orcid.org/0009-0007-9696-2130
dynamic change of traffic flow, resulting in the traffic
flow in peak hours not being effectively channelling.
The lane turning setting is not reasonable, the number
of lanes does not match the traffic flow, causing some
lanes in a saturated state for a long time. These
urgently need scientific analysis and optimization to
improve their operational effectiveness. In this
context, big data applications and intelligent
transportation systems are increasingly required to
provide data-driven solutions to optimize traffic
routes, traffic distribution, and general management.
(Brown et al., 2022). These integrations increase the
responsiveness and flexibility of urban transport
systems to reduce congestion and improve safety and
environmental quality (Haydari and Yilmaz, 2022).
The application of intelligent transportation
systems (ITS) and big data algorithms in urban traffic
management is getting more attention from academia
and industry. They can provide a scientific basis for
transportation management and optimization based
on real-time traffic flow monitoring and massive data
analysis (Cheng, Pang and Pavlou, 2020) According
to the research, scholars have proposed various
methods to improve the current traffic congestion in
intersections. For example, refining the timing of
Dai, X.
Traffic Intersection Optimization Based on Random Forest and SUMO Simulation in Xi’an.
DOI: 10.5220/0013329600004558
Paper published under CC license (CC BY-NC-ND 4.0)
In Proceedings of the 1st International Conference on Modern Logistics and Supply Chain Management (MLSCM 2024), pages 301-309
ISBN: 978-989-758-738-2
Proceedings Copyright © 2025 by SCITEPRESS – Science and Technology Publications, Lda.
301
signal lights, and upgrading lane Settings, could
alleviate traffic congestion, improve traffic efficiency,
and reduce environmental pollution. Eom and Kim
(2020) argue that a reasonable timing schedule for
signal lights can significantly improve the capacity
and safety of the roads. Zhao et al. (2013) suggest that
meticulously designed lane turn signs can ensure that
vehicles enter and exit smoothly without causing
severe traffic congestion. In addition, simulation
technologies such as Simulation of Urban Mobility
(SUMO) are becoming widely used in traffic
management and optimization. The results of these
simulations can work as vital support for renovating
the intersection lane layout (Shirazi, Morris and
Zhang, 2023). Through these analyses, the effect of
distinctive design plans can be evaluated to provide a
scientific basis for perfecting traffic intersections
To solve the traffic problem and the inefficiency
of the intersection, this paper carries out research
experiments to study the design problems in the
design of traffic intersections on Shang Hong Road
and Shang Ji Road in Xi'an City and proposes
improvements based on calculation and analysis. The
article will achieve the research goals based on the
following steps: Firstly, it will collect and analyze the
traffic flow during morning and evening and flat
peaks. Additionally, the paper will redesign the
junction using CAD software. Moreover, it will use
SUMO simulation software to simulate and analyze
the improved design and propose optimized signal
timing schemes and lane design suggestions based on
the simulation results. This study is expected to
provide scientific suggestions for urban traffic
management departments to improve the operation
efficiency and safety of traffic intersections.
2 RESEARCH AREA AND
METHODOLOGY
2.1 Overview of the Targeted Area
2.1.1 Introduction of the Intersection
With the progress of urbanization, the traffic pressure
of Xi 'an is increasing daily, and the traffic congestion
problem has become one of the bottlenecks restricting
the city's further development. Especially in some
important traffic nodes and economic development
areas, the traffic flow is dense, and the congestion is
serious. Therefore, it is of great practical significance
to solve the traffic problems in these areas. Shang
Hong Cross Road is a typical bottleneck area, located
at the intersection of Xi 'an Economic Avenue and
Shang Ji Road Science and Technology Development
Zone. The north-south main Road Shang Hong Road
and the National Highway 1310 Express Road
(known as Shang Ji Road) form this junction. The
intersection is located in a complex area of
infrastructure, the northern area is mostly residential
areas, and the south, east, and west are distributed
with several types of factories and commercial areas.
This diverse regional functional layout brings a lot of
commuting and coordination traffic needs. In addition,
there are many important traffic attractions near the
intersection, such as Xi 'an Economic Development
Zone No. 8 Primary School, Yurun Market, and
Master Kong Storage and Transportation Center,
which further aggravate the traffic flow and
congestion at the interchange. Therefore, it is of great
significance to study and optimize the traffic
organization and management of Shang Hong Cross
Road to improve the traffic situation in this area
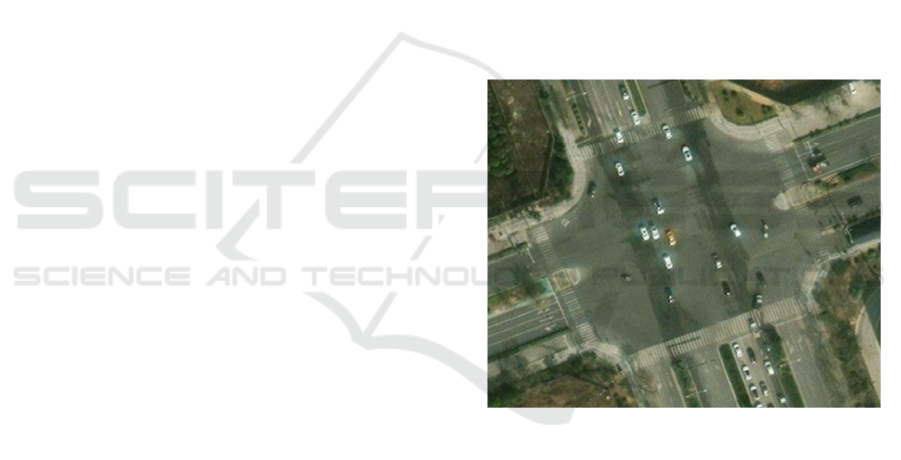
(Figure 1).
Figure1: Actual map of the intersection (Photo/Picture
credit : Original).
2.1.2 Current Problems
The convergence of these major roads at the
intersection leads to an increasing flow of vehicles,
exacerbating the traffic congestion risk. Traffic
congestion is particularly severe during peak hours,
causing significant delays and increasing the risk of
accidents. The presence of important educational and
commercial establishments further increases the
traffic volume, with parents picking up students and
commercial vehicles moving in and out of storage
facilities, compounding the traffic problem. The
existing road infrastructure cannot accommodate such
a high volume of traffic, resulting in a bottleneck
phenomenon that affects not only the traffic in the
MLSCM 2024 - International Conference on Modern Logistics and Supply Chain Management
302

area but also the overall traffic flow in the technical
development zone. To address this issue,
comprehensive traffic management strategies and
infrastructure improvements are required to ease
congestion and ensure smoother traffic flow.
2.1.3 Data Collection
Through field measurement and mechanical counting
method, the study obtained the following traffic flow
of left-right turning and going straight through the
intersection within one hour of the morning and
evening peak. Through the vehicle conversion
coefficient table in Table 1,
Table 1: Vehicle conversion factor.
Vehicle
Type
Vehicle
Conversion
Facto
r
Description
Small
Vehicle
1.0
Passenger vehicles with
≤19 seats and cargo
vehicles with ≤2t load
capacity.
Medium
Vehicle
1.5
Passenger vehicles
with >19 seats and
cargo vehicles with >2t
to ≤7t load capacity.
Large
Vehicle
2.0
Cargo vehicles with >7t
to ≤14t load ca
p
acit
y
.
Trailer 3.0
Cargo vehicles with >7t
to ≤14t load capacity.
2.2 Methodology
AutoCAD software is produced by the United States
Autodesk Co., LTD. (Autodesk), which is an
automatic computer-aided design software, that can
be used to draw two-dimensional drawings and basic
three-dimensional designs, it does not need to know
programming, you can automatically draw, so it is
widely used in the world, can be used in civil
construction, decoration, industrial drawing,
engineering drawing, engineering drawing,
electronics industry, clothing processing, and other
fields. CAD tools can be used to design and optimize
road layouts, ensuring proper allocation of lanes for
vehicles, pedestrians, and cyclists to reduce traffic
congestion (Omura and Benton, 2019).
SUMO is an open-source traffic simulation
software that can simulate and analyze urban traffic
flow. Using SUMO, city planners can predict the
impact of different planning options and determine
the most efficient transportation solutions. Moreover,
with SUMO, it is possible to simulate urban traffic
conditions under different traffic flows and evaluate
the feasibility of different traffic plans. In addition,
traffic signal Settings can be optimized through
simulation to reduce vehicle waiting times and
improve overall traffic efficiency. This integrated
approach enables a comprehensive assessment and
improvement of urban traffic management strategies,
contributing to a more effective and efficient urban
traffic flow (Krajzewicz, 2010).
2.3 Traffic Flow Prediction Using
Random Forest Model
This paper will apply the Random Forest Model to
experiment with traffic flow prediction. Random
Forest is a supervised data mining algorithm. It is a
classifier model composed of multiple CART
decision trees. The resulting decision trees form a
random forest model (Liu and Wu, 2017).
The Random Forest model's prediction formula
can be succinctly expressed as:
Y
=
1
N
∑
f
i
X
N
i=1
(1)
where (𝑌
) represents the estimated total traffic
volume, (𝑁) denotes the number of decision trees,
(𝑓
(
𝑋
)
) corresponds to the prediction outcome of
the (𝑖) −𝑡ℎ decision tree, and (𝑋) encapsulates the
input feature vector, including the time (in hours and
minutes). This ensemble method aggregates the
predictions from individual decision trees, effectively
capturing complex relationships within the data,
leading to more robust and accurate traffic volume
forecasts.
In this case, the formula of the Random Forest
Model can be used as:
𝑌
=
∑
𝑓
(
Hour
,Minute
)
(2)
Where(Y
) represents the estimated total traffic
volume at the time(t) , (N) denotes the number of
decision trees (set to 100 in this example),
(f
(
Hour
,Minute
)
) corresponds to the prediction
outcome of the (i) − th decision tree based on the
hour and minute at time (t), and (X) encapsulates the
input feature vector, including the time (in hours and
minutes). This ensemble method aggregates the
predictions from individual decision trees, effectively
capturing complex relationships within the data,
leading to more robust and accurate traffic volume
forecasts.
Traffic Intersection Optimization Based on Random Forest and SUMO Simulation in Xi’an
303
3 RESULT ANALYSIS
3.1 Using CAD to Upgrade the
Intersection Network
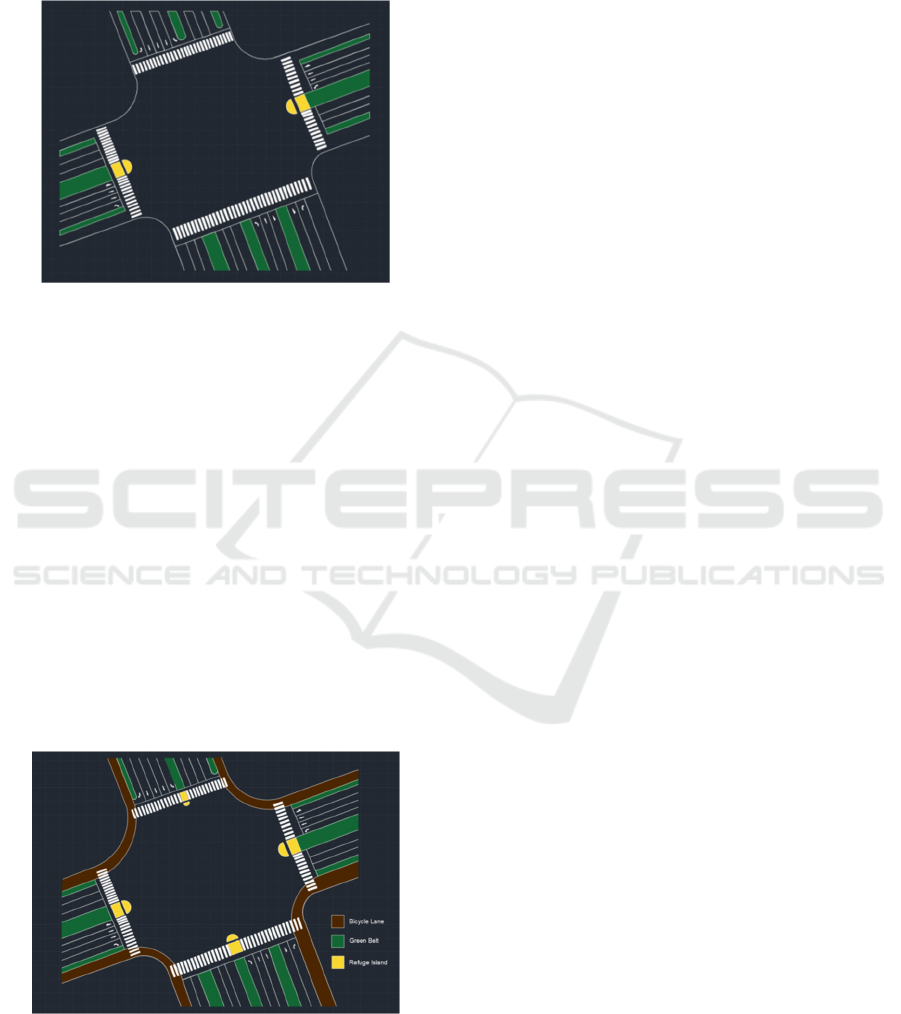
Figure 2: CAD drawing of the original intersection
(Photo/Picture credit : Original).
Figure 2 shows the existing road network structure,
the setting of turning lanes is not reasonable. Due to
the insufficient width of the lane or the unreasonable
setting of the signal light, vehicles interfere with each
other when turning, which is easy to cause a collision,
thus obstructing the smooth passage of traffic at the
intersection. Secondly, the setting of the safety islands
is not perfect, only the east and west safety islands are
set up. The north-south road surface is wider, but there
is no safety island, so it causes a safety risk for
pedestrians crossing the street. In addition, the
intersection does not effectively mark the specific
location of the non-motorized lane, resulting in the
phenomenon of grabbing the lane between non-motor
vehicles and motor vehicles, which not only causes
congestion but also causes security risks.
Figure 3: CAD drawing of the improved intersection
(Photo/Picture credit : Original).
The upgrade plan for the network is shown in
Figure 3. In the figure, this research changed the
steering of the north-to-south lanes and concentrated
the right-turn lanes on the right side of the road. This
way, there will be no congestion and traffic standstill
caused by straight-going vehicles and right-turning
vehicles competing under the same green light.
Secondly, considering the width of the intersection
and the possibility of pedestrians crossing the street
twice, this paper added two safety islands at the east-
west zebra crossing. According to the standard, the
width of the safety island is at least 1.5 meters, and if
it needs to accommodate wheelchairs, etc., the width
needs to be set to 2 meters. At the same time, the
safety island design used in the paper will have
sections at both ends that are raised above the ground
to enhance the safety of pedestrians and prevent
vehicle strikes. At the same time, the middle part of
the safety island is level with the ground, which is
convenient for the elderly and disabled people to use.
In addition, the middle part of the safety island is
coated with anti-slip lines to prevent slipping in rain
and snow and improve visibility, and its two ends are
also coated with yellow reflective material, which is
easier to see at night (Li, Yang and Yin, 2010). Finally,
this research set up a non-motorized lane, as shown in
the brown area in the figure, which separates the non-
motorized traffic flow from the motorized traffic flow,
improving the efficiency and safety of the intersection
3.2 Prediction Result Analysis
3.2.1 Morning Peak Analysis
As shown in Figure 4, during the morning peak, the
traffic flow prediction indicates that in the coming
hour, there will be an increasing number of vehicles
passing through the intersection, especially between
8:45 and 9:20. Traffic started at 8:45 am with 169
vehicles, then steadily increased to 194 vehicles at
8:55 am and reached its peak at 9:20 am with 209
vehicles. Subsequently, traffic decreased slightly to
164 vehicles at 9:30 a.m. and 152 vehicles at 9:40 a.m.
This trend indicates that traffic congestion will
gradually increase during peak hours in the morning,
especially around 9:20 am, when traffic may reach
saturation. Therefore, to reduce traffic congestion
around 9:20, it is suggested that the design of traffic
lights be adjusted, traffic flow should be restricted
during rush hour, and management of the surrounding
area should be optimized.
MLSCM 2024 - International Conference on Modern Logistics and Supply Chain Management
304

Figure 4: Traffic volume forecast in the morning peak (Photo/Picture credit: Original).
Figure 5: Traffic volume forecast in the evening peak (Photo/Picture credit: Original).
For traffic from north to south, as forecast,
morning peak traffic is steady but tends to decrease.
From 8:45 to 12:22, it gradually decreases until 9:40
to 64h. The traffic volume in this direction is small
and will decrease gradually. However, attention must
be paid to traffic management to prevent unforeseen
events from causing disruptions. For example, early
morning traffic management should be improved,
sufficient labor and equipment should be provided,
and accidents or technical failures should be recorded
promptly to reduce the risk of traffic accidents.
3.2.2 Evening Peak Analysis
During evening peak periods, north-south traffic
shows significant variations, especially from north to
south. Concrete data in Figure 5 show that north-south
traffic increased from 142 at 6:35 to 193 at 6:40, with
a peak of 200 at 7:10. Traffic subsequently fluctuated
between 175 and 200 vehicles and continued until
7:30. Traffic from the south to the north, on the other
hand, is relatively stable and is expected to fluctuate
between 113 and 137 vehicles between 6:35 and 7:30.
This forecast indicates that the north-to-south
tracks could face significant congestion, especially
during the evening rush hour at approximately 7:10.
In addition, large gaps between north and south can
lead to bottlenecks at intersections, further
exacerbating congestion. It is therefore recommended
that the operating time of the traffic lights be
dynamically adjusted during the evening rush hour to
give priority to north-south traffic. At the same time,
consideration could be given to creating additional
temporary lanes in the north and south directions to
optimize the use of the lanes and allow rush-hour
vehicles to move quickly in the priority sections.
When the morning and evening peak traffic
forecasts are considered, traffic varies between
periods and directions. During the morning peak,
traffic reaches its highest at 9:20 (209 vehicles) before
tapering off from north to south to the lowest (64
vehicles). During the evening peak, the traffic from
north to south fluctuates widely, up to 200 vehicles,
while the flow from south to north is more stable.
Traffic Intersection Optimization Based on Random Forest and SUMO Simulation in Xi’an
305
These data show that some important sections present
a clear risk of congestion during peak hours and
require appropriate management measures.
To effectively address these challenges, improve
real-time traffic monitoring and use intelligent
transport systems (its) to dynamically adjust signaling
periods and conduct traffic strikes by adding
temporary lanes and optimizing lane use. Tempering
returns should be considered. In addition, continuous
data analysis and forecasting will provide an
important reference for future traffic management and
will help to develop more scientific traffic channeling
scenarios and improve the overall efficiency of traffic
exploitation.
3.3 SUMO Simulation Analysis
3.3.1 Network Structure and Signal
Optimization
The diagram below shows the typical design of a four-
lane crossing in SUMO. To manage the volume of
traffic in the north-south direction, the emphasis is on
improving the tracks in the north-south direction. The
design uses a crossing plan to handle north-south
traffic. The track configuration in all directions
includes a left, right, and right turn. The tracks
intersect in the central section of the crossing,
allowing safe and smooth movement of vehicles in all
directions. At the same time, detectors are installed at
each entrance. These detectors can monitor traffic in
real-time in all directions and provide data to
dynamically adjust signal synchronization. Crossings
are designed to maximize vehicle traffic efficiency
and reduce potential collisions and congestion.
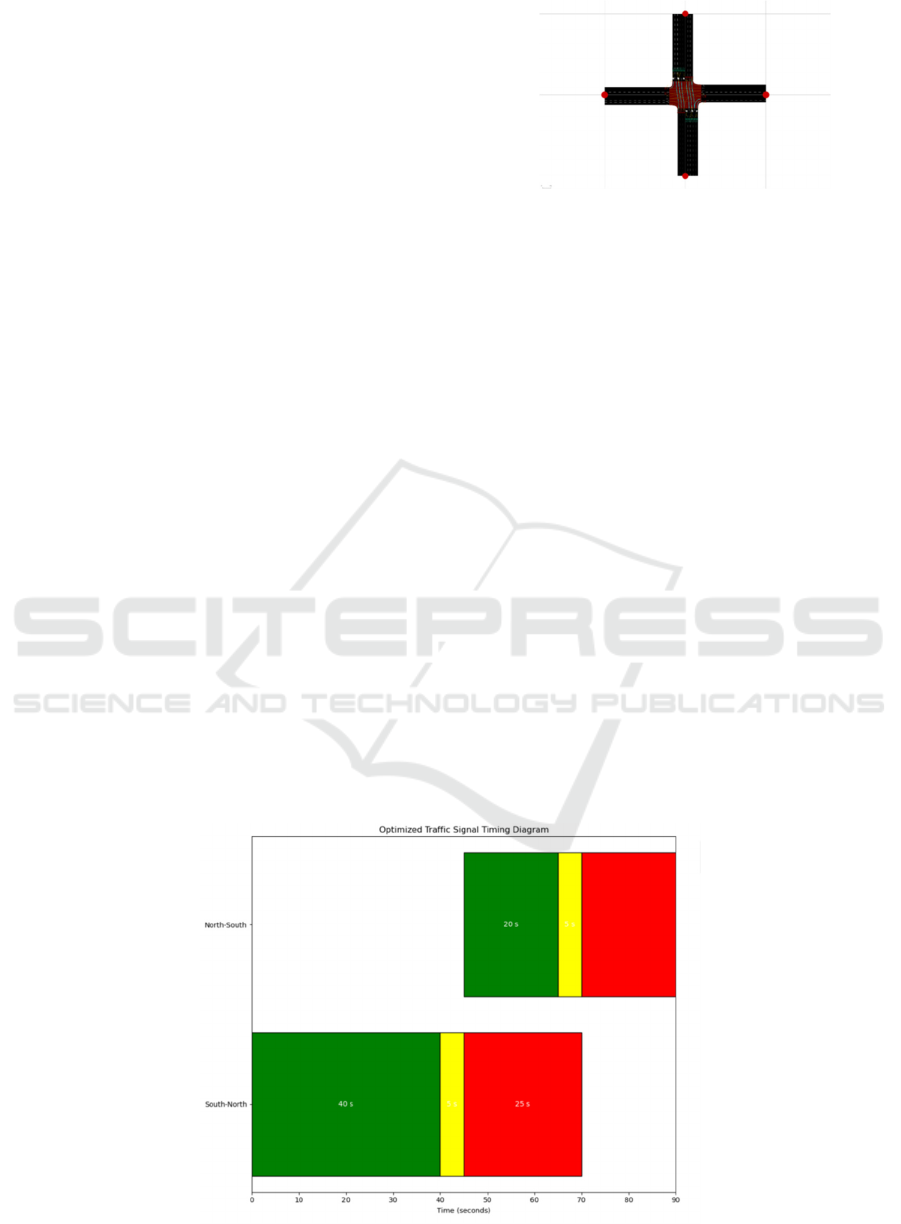
Figure 6: Road structure image after improving the lane
network using SUMO (Photo/Picture credit : Original).
The diagram below shows the optimal signal time
at this crossing. Based on traffic data provided by the
SUMO simulation tool, the green light time is
dynamically adjusted according to traffic to reduce
vehicle delays and improve the effectiveness of bans.
Especially in directions where there is significant
traffic in the north-south direction, the duration of the
green light was extended, allowing vehicles from that
direction to cross the crossing quickly, reducing
waiting times and potential congestion. As shown in
the chart, from north to south, the green light is 20
seconds long, the red light is 63 seconds long, and the
yellow light is fixed for 3 seconds in a signal period.
At the same time, the green light is 40 seconds long
and the red light is 25 seconds long in a signal period
from south to north.
With the improved traffic light configuration, it is
possible to effectively avoid the north-south and east-
west traffic lights at the same time and reduce traffic
congestion. This time allocation, which allows
vehicles to travel in one direction at all times, reduces
the risk of accidents and improves crossing safety. A
reasonable allocation of time can improve crossing
Figure 7: Signal light timing improvement diagram (Photo/Picture credit: Original).
MLSCM 2024 - International Conference on Modern Logistics and Supply Chain Management
306
capacity. By analyzing traffic in different directions,
this program defines a reasonable green light time
based on actual traffic, which ensures the efficient
passage of traffic. Also, switch traffic lights regularly
every week to make traffic flow smoother. The
optimized signal configuration scheme ensures the
stability of the road sign system in the actual
operation by clearly setting the green, yellow, and red
times. This stable signal switching reduces driver
uncertainty and improves road traffic reliability.
3.3.2 Simulation Results Comparison
This study analyses in detail traffic performance
indicators before and after upgrading the crossing
network and traffic light optimization using SUMO
simulation data. The indicators analyzed are the
Average Travel Time, the Average Speed, the Average
Time Lost, the Average Time Lost Within, and the
Average Duration Within. The following is a
summary of the results of the analysis.
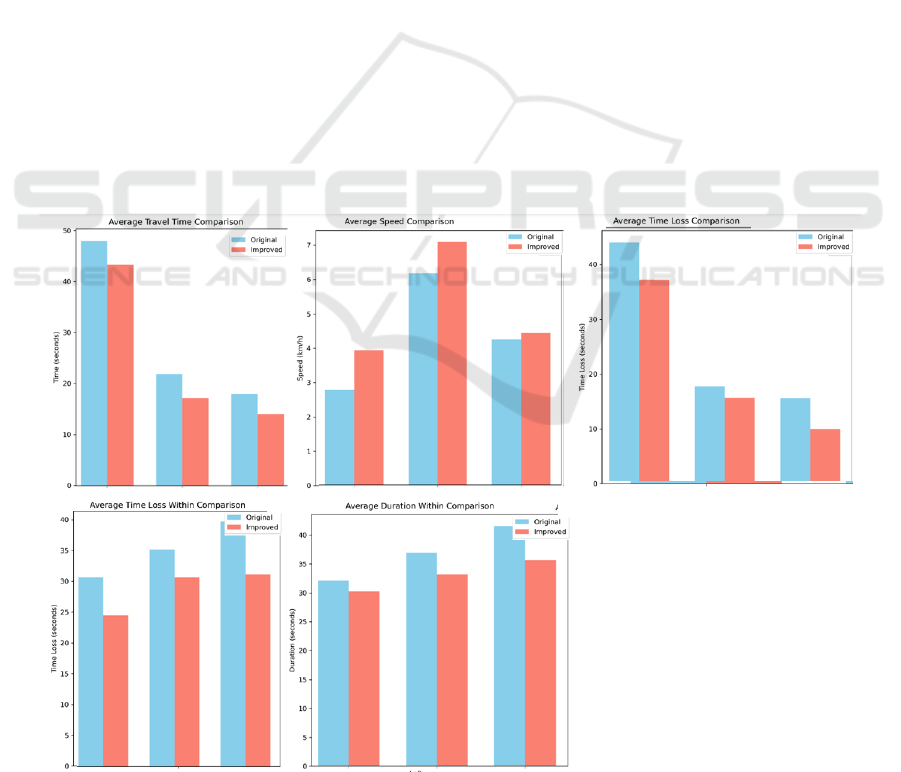
As shown in Tables 6 and 7, the average left-hand
car travel time increased from 47.97 seconds to 43.32
seconds, an improvement of approximately 9.7%. The
average driving time of direct line vehicles decreased
by 21.7% from 21.84 seconds to 17.15 seconds. The
average driving time of vehicles turning to the right
decreased from 17.91 seconds to 14.05 seconds, an
improvement of 21.5%. The bar chart in Figure 8
demonstrates directly that these reductions show that
optimization measures have significantly improved
driving efficiency in all directions.
As shown in Figure 8, the average speed in all
directions was increased by optimization. Tables 6
and 7 indicates that the average speed of the left cars
increased by 42.0% from 2.76km /h to 3.92km /h. The
average speed of straight-line vehicles increased by
14.8% from 6.16 km/h to 7.07 km/h. The average
speed of right turns increased from 4.23 km/h to 4.42
km/h, an increase of 4.5%. The increase in average
speed means smoother traffic and less congestion.
Table 2 and Table 3 show that the average lost time
is an important measure of the total number of
vehicles delayed at crossings. Optimized traffic
decreases in all directions. The average time lost by a
left-hand vehicle decreased from 44.00 seconds to
37.23 seconds, a reduction of 15.4%. The average
time lost for direct line vehicles decreased by 11.8%
from 17.76 seconds to 15.67 seconds. The average
time lost to a right turn decreased from 15.61 seconds
to 10.01 seconds, a reduction of 35.7%. These results
show that optimization significantly reduces delay
time in all directions.
Figure 8: Comparison of different indicators before and after optimization (Photo/Picture credit: Original).
Traffic Intersection Optimization Based on Random Forest and SUMO Simulation in Xi’an
307
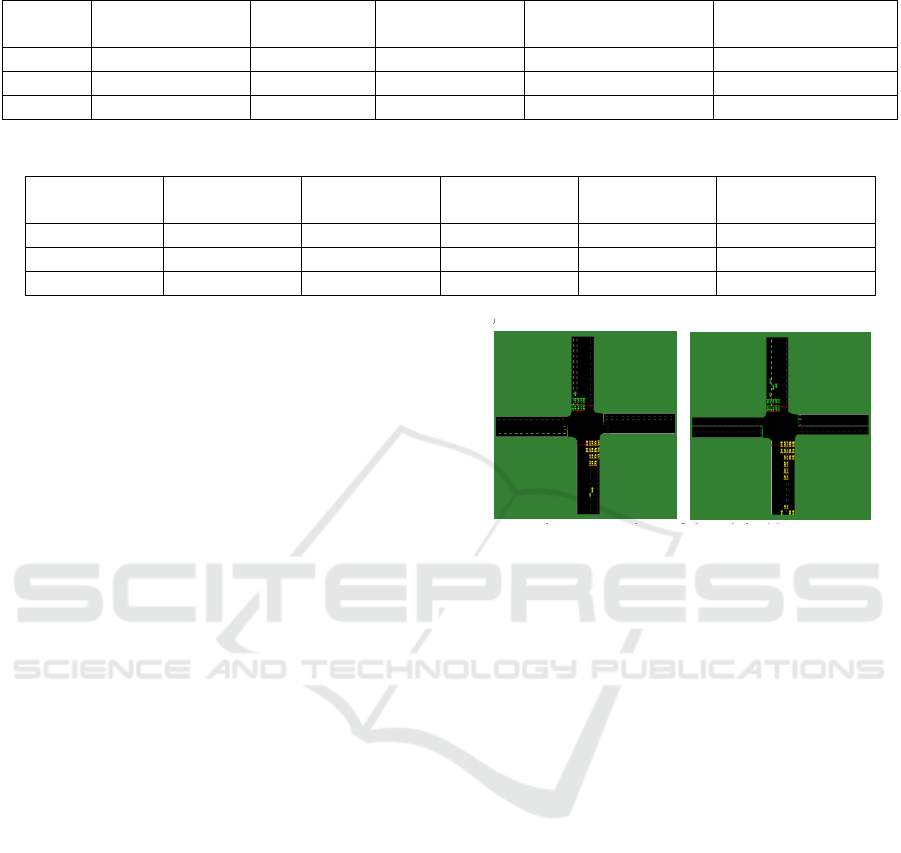
Table 2: Simulation results of different indexes before optimization.
Original Average Travel
Time
Average
Spee
d
Average Time
Los
t
Average Time Lost
Within
Average Duration
Within
Lef
t
47.97 2.76 44.00 30.47 32.10
Strai
g
h
t
21.84 6.16 17.76 34.93 36.95
Ri
g
h
t
17.91 4.23 15.61 39.43 41.56
Table 3: Simulation results of different indexes after optimization.
Improved Average
Travel Time
Average
Spee
d
Average Time
Los
t
Average Time
Lost Within
Average
Duration Within
Lef
t
43.32 3.92 37.23 24.34 30.26
Strai
g
h
t
17.15 7.07 15.67 30.45 33.18
Ri
g
h
t
14.05 4.42 10.01 30.92 35.62
The average time lost within the crossing has also
been improved as shown in Figure 8. The average
internal time lost by left-hand cars decreased from
30.47 seconds to 24.34 seconds, a reduction of 20.2%.
The average loss of internal time for cars in direct
service was reduced from 34.93 seconds to 30.45
seconds, a reduction of 12.7%. The average loss of
internal time for cars that made a right turn was
reduced from 39.43 seconds to 30.92 seconds, a
decrease of 21.6% as shown in Tables 6 and 7. It
reduces the stay time of vehicles inside the
intersection and improves the efficiency of the
passage.
The average crossing time has also been improved
through optimization. The average length of a left turn
decreased by 5.7% from 32.10 seconds to 30.26
seconds. The average duration of direct line vehicles
decreased by 10.3% from 36.95 seconds to 33.18
seconds. Average right-hand vehicle travel time
decreased from 41.56 seconds to 35.62 seconds, a
reduction of 14.2% as shown in Tables 6 and 7. These
improvements have significantly reduced the average
stopping time of vehicles at crossings.
Overall, improvements to the crossing system and
optimization of signal lights have significantly
improved traffic efficiency. It reduces the time and
waste of time on the road and also increases the
average speed of vehicles, as demonstrated in Figure
9, after optimization, the number of vehicles queuing
in the lane is significantly reduced. These
improvements will improve traffic flow and reduce
congestion, making an important contribution to
urban traffic management.
Figure 9: Comparison of the original lane queue (Left) with
the improved lane queue (Right) (Photo/Picture credit :
Original).
4 CONCLUSION
This research focused on a comprehensive analysis
and design optimization to address traffic congestion
at the intersection of Shang Hong Road and Shang Ji
Road in Xi'an City. The project involved enhancing
the road network layout through AutoCAD software
and simulating the proposed improvements using the
SUMO simulation tool. Additionally, a random forest
model was utilized to forecast traffic flow, leading to
recommendations for optimizing signal light
durations and lane arrangements.
The findings indicate that the revised traffic
network design and signal configurations can enhance
the intersection's capacity, minimize vehicle delay
times, and boost overall traffic safety. Specifically,
The average travel time of left-turning, right-turning,
and straight-moving vehicles experienced a
significant reduction, resulting in improvements of
9.7%, 21.7%, and 21.5% respectively. Furthermore,
there was a notable increase in average travel speeds:
left-turning vehicles improved from 2.76 km/h to 3.92
km/h; straight-moving vehicles increased from 6.16
km/h to 7.07 km/h; and right-turning vehicles rose
MLSCM 2024 - International Conference on Modern Logistics and Supply Chain Management
308

slightly from 4.23 km/h to 4.42 km/h—all indicating
that optimized designs effectively reduce delays while
enhancing vehicle throughput efficiency.
Looking into the future, it is recommended that
real-time monitoring systems be further integrated
with adjustments made to signal lights and lane
configurations in response to evolving traffic patterns
over time. In the future, consider introducing deep
learning models, such as long short-term memory
networks (LSTMs), to capture time-dependent
relationships in traffic flow. Reinforcement learning
algorithms can also be used to optimize signal timing
dynamically and adjust based on real-time data. They
could provide dynamic solutions for urban
transportation systems while promoting smoother
flows and environmental sustainability within city
traffic networks.
REFERENCES
Afrin, T. and Yodo, N. 2020. A Survey of Road Traffic
Congestion Measures towards a Sustainable and
Resilient Transportation System. Sustainability, [online]
12(11), p.4660.
Brown, C., Hardman, M., Davies, N. and Armitage, R. 2022.
Mobility as a Service: Defining a Transport Utopia.
Future Transportation, 2(1), pp.300–309.
Cheng, Z. (Aaron), Pang, M.-S. and Pavlou, P.A. 2020)
Mitigating Traffic Congestion: The Role of Intelligent
Transportation Systems. Information Systems Research,
31(3).
Eom, M. and Kim, B.-I. 2020. The traffic signal control
problem for intersections: a review. European Transport
Research Review, 12(1).
Haydari, A. and Yilmaz, Y. 2022. Deep Reinforcement
Learning for Intelligent Transportation Systems: A
Survey. IEEE Transactions on Intelligent
Transportation Systems, 23(1), pp.11–32.
Krajzewicz, D. 2010. Traffic Simulation with SUMO –
Simulation of Urban Mobility. Fundamentals of Traffic
Simulation, 145, pp.269–293.
Li, L., Yang, X. and Yin, L. 2010. Exploration of Pedestrian
Refuge Effect on Safety Crossing at Signalized
Intersection. Transportation Research Record: Journal
of the Transportation Research Board, 2193(1), pp.44–
50.
Liu, Y. and Wu, H. 2017. Prediction of Road Traffic
Congestion Based on Random Forest. [online] IEEE
Xplore.
Omura, G. and Benton, B.C. 2019. Mastering AutoCAD
2019 and AutoCAD LT 2019. Hoboken, Nj: Sybex, A
Wiley Brand.
Shirazi, M.S., Morris, B.T. and Zhang, S. 2023. Intersection
Analysis Using Computer Vision Techniques with
SUMO. Intelligent Transportation Infrastructure,
[online] 2.
Zhao, J., Ma, W., Zhang, H.M. and Yang, X. 2013.
Increasing the Capacity of Signalized Intersections with
Dynamic Use of Exit Lanes for Left-Turn Traffic.
Transportation Research Record: Journal of the
Transportation Research Board, 2355(1), pp.49–59.
Traffic Intersection Optimization Based on Random Forest and SUMO Simulation in Xi’an
309
