
Design a Water Distribution Network for a Small Tourist Resort
Dorothy Zhang
a
Beijing National Day School, Beijing, China
Keywords: Water Distribution Network, EPANET, Water Consumption, Pressure Requirements, Pump Selection.
Abstract: A well-planned water distribution network is an essential infrastructure component to ensure a reliable supply
of clean water for guests and staff in a tourist resort, as well as to support recreational facilities like pools,
spas, and gardens. A comprehensive water distribution network is created using EPANET software to ensure
efficient water flow and adequate pressure throughout the resort. The network is designed to cater to peak and
off-peak water demands, with special attention paid to maintaining pressures within safe limits. Firstly, the
water consumption model is used to calculate water consumption for the resort. Secondly, the water
distribution network is designed based on water consumption. A water distribution network using EPANET
is developed to simulate and manage the water consumption of the resort. Thirdly, the main components that
mainly affect the performance of water distribution systems include pumps, junctions, reservoirs, pipes,
valves, and tanks, so the length of pipes, roughness of pipes, number of junctions, the height of houses
reservoirs, tanks and wells are vital to the distribution of water. Finally, the water distribution network and its
parameters (such as the length of pipes, and roughness of pipes) are designed and analyzed. Taking all the
above factors into account comprehensively, a reliable and efficient system can be designed that ensures a
consistent and safe water supply for all guests and resort facilities.
1 INTRODUCTION
Water to human life, agriculture, industry, and
maintaining ecosystems grows more important, as
decreasing world’s water resources, growing
populations and environmental changes. As tourism
resorts develop, well-designed water distribution
systems are essential to ensure guests have access to
reliable and clean water, and therefore impact the
overall visitor experience. The need for conservation
of water resources and sustainable management is
vital to support the world and address future
challenges.
The EPANET software in water distribution
network (WDN) analysis has been widely explored in
various case studies, demonstrating its value in
optimizing and ensuring the reliability of water
supply systems. Adeniran and Oyelowo (2013)
employed EPANET to analyze the water distribution
network at the University of Lagos, Nigeria, including
data collection, nodal demand estimation, network
construction, network parameters design and result
analysis. The study revealed deficiencies in the
a
https://orcid.org/0009-0003-8961-6740
existing system, suggesting that improvements in
pipes and the biggest tank. Similarly, Gupta et al.
(2013) developed WDNs using EPANET and
concluded that the results simulation of EPANET
were close to the actual network. Bartkowska (2014)
investigated the dynamics of water consumption in a
tourist resort, emphasizing the importance of
understanding consumption patterns and monitoring
water consumption in designing WDN. Studies by
Kakadiya et al. (2016) in Surat City further confirmed
EPANET's role in simulating existing networks,
showing how it helps validate the system's response
to various conditions, such as the pressure at all
junction and the flows even peak demand and
operational stress. Venkata Ramana and Chekka
(2018) extended these analyses by validating
continuous water supply systems using EPANET.
Their work demonstrated how simulations help
maintain constant flow and pressure by setting
appropriate values for parameters, which is critical for
reliable water service. In the Thakur et al. (2020)
study, water networks for NIT Srinagar were
designed, reinforcing the value of EPANET in
Zhang, D.
Design a Water Distribution Network for a Small Tourist Resort.
DOI: 10.5220/0013327100004558
In Proceedings of the 1st International Conference on Modern Logistics and Supply Chain Management (MLSCM 2024), pages 259-263
ISBN: 978-989-758-738-2
Copyright © 2025 by Paper published under CC license (CC BY-NC-ND 4.0)
259

assessing different pipeline configurations for optimal
performance. Košarac et al. (2019) and Mazouz (2021)
explored optimization techniques using EPANET for
efficient WDN design and management, underscoring
their application in both new and existing systems.
Lastly, Veer et al. (2022) discussed the role of
EPANET in designing WDNs, affirming its
importance for planning and addressing future
demand challenges.
This article mainly studies the water distribution
network of resorts, focusing on the theory, tools of
water distribution systems, WDN design and analysis
of a resort. How to use tools to simulate and manage
the water demand of resorts is vital to the sustainable
development of resorts.
2 WATER DISTRIBUTION
NETWORK
2.1 Water Distribution Network
A water distribution network (WDN) refers to the
interconnected network of pipes, pumps, valves, and
storage facilities that transport water from sources to
end users, such as homes, and entertainment facilities
(Adeniran and Oyelowo 2013, Kakadiya et al. 2016,
Thakur et al. 2020).
It is a crucial part of the water supply
infrastructure, ensuring that clean and sufficient water
is delivered efficiently to guests in the resort.
Pipelines, junctions, pipes, pumping stations,
reservoirs and storage tanks, valves and pressure-
regulating devices are key components of a water
distribution network. The design and operation of a
water distribution network are essential for ensuring
reliability, safety, and the long-term sustainability of
water supply systems.
2.2 Bernoulli Equation with Local and
Friction Losses
Bernoulli equation with local and friction losses is
equation (1) for per unit volume flow for real fluid
(Subramanian, 2024)
+ ℎ
+
=
+ ℎ
+
+ ∆𝐸 (1)
local fr i cti on
EE E
Δ
=
Δ
+
Δ
(2)
∆𝐸
= 𝜁
𝑣2
2g
(3)
∆𝐸
= 𝑓
(4)
Where, ∆𝐸
: head loss.
f: the friction factor from the Moody chart.
L: length of the pipe.
d: diameter of the pipe.
v: velocity of the fluid at a point.
g: acceleration due to gravity.
h: the elevation of the point above a reference
plane.
P: the pressure at the chosen point.
𝜁
:loss coefficient of P.
In fluid dynamics, ∆𝐸
equation is the
Darcy–Weisbach equation, which is an empirical
equation that relates the head loss, or pressure loss,
due to friction along a given length of pipe to the
average velocity of the fluid flow for an
incompressible fluid. Pipe flow and velocity are
calculated using the equation (1).
2.3 EPANET
EPANET is a widely used software developed by the
United States Environmental Protection Agency
(EPA) for modelling water distribution systems. It
allows engineers and planners to simulate the flow of
water, pressure in pipes, and the quality of water
within a network of pipes over time.
EPANET can be used for hydraulic analysis,
water quality simulation, system design and
operations. The downloading link of the software
EPANET is https://www.epa.gov/water-
research/epanet.
3 THE PROCESS OF EPANET
SIMULATION
Figure 1: The process of EPANET simulation
(Photo/Picture credit : Original)
Figure 1 shows the process of EPANET
simulation as the following:
(1) Design a water distribution network and
determine the number of pipelines, junctions, pipes,
pumping stations, reservoirs and storage tanks, valves
and so on.
(2) Set some parameters of equation (1).
MLSCM 2024 - International Conference on Modern Logistics and Supply Chain Management
260
(3) Run the water distribution network.
(4) Analyze the results of the water distribution
network
(5) Visualize outputs of the water distribution
network
(6) Reset the parameters of the water distribution
network and refine the water distribution network
until Reasonable results are obtained.
Through EPANET simulation, it is possible to
determine whether it is consistent with the
calculations using equations (1), (2), (3), and (4), as
well as whether it meets various water requirements
in actual situations.
4 THE DESIGN OF THE WATER
DISTRIBUTION NETWORK IN
A SMALL TOURIST RESORT
4.1 A Small Tourist Resort
A water distribution system for a small tourist resort
which sits on a foothill was designed. The resort
comprises 20 houses, each with 4 apartments and 5
guests in each of them. The resort also includes a
restaurant with a social club and a swimming pool,
along with a dedicated water supply for firefighting
purposes.
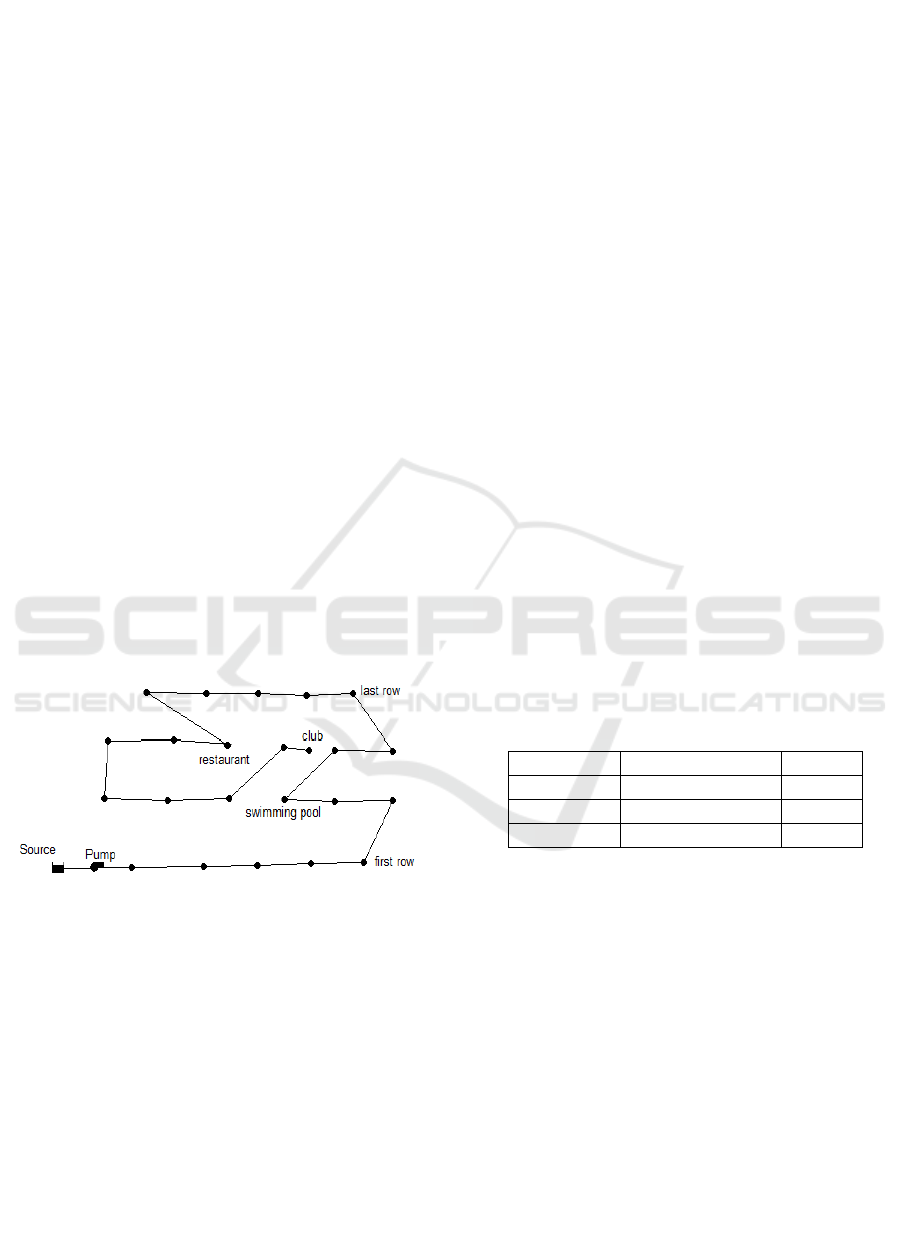
Figure 2: The network of a small tourist resort
(Photo/Picture credit : Original).
The houses are arranged in 4 rows, with an
elevation difference of 20 meters between the first and
last rows. The resort is located 200 meters from an
underground aquifer, with a constant water level 16
meters lower than the lowest row of houses. The
network of a small tourist resort is designed using
EPANET, which is shown in Figure 2. The little dots
of Figure 2 represent facilities such as houses,
swimming pools, clubs and restaurants. Section 4.2 is
the designing detail.
4.2 Water Distribution Network
A comprehensive water distribution network will be
created using EPANET modelling software to ensure
efficient water flow and adequate pressure throughout
the resort.
The network will be designed to cater to peak and
off-peak water demands, with special attention paid
to maintaining pressures within safe limits (2.0 to 6.0
bars).
(1) Water Consumption Patterns
There are twenty houses and eighty apartments in
the resort. At most, there can be 400 guests here. The
water consumption needs of different types of
residents may be different in order to better plan the
water distribution network. The water demands must
be met during the peak period. Generally, people use
different amounts of water at different times of the
day, and there is a peak in water usage before and after
meals. The largest peak is before dinner or after
dinner. Water usage typically peaks just before dinner,
with the highest demand occurring before dinner as
guests use water for showering and other daily
routines.
Based on the average monthly water consumption
per person (3 cubic meters), the daily water usage per
person is 100 litres (3000/30=100 litres). Considering
peak demand periods, the maximum flow rate could
reach 0.1 liters per second(LPS). Table 1 is the water
consumption demand for the resort.
Table 1 The water consumption demand.
house Swimmin
g
pool club
0.1LPS 0.17LPS 0.1LPS
r
estauran
t
h
y
dran
t
0.1LPS 5LPS
For the swimming pool, if 60 people swim every day
and each person swims for 10 hours per day, the water
consumption of swimming per second would be 0.33
liters per second.
100×60 ÷(10×3600)≈0.17 LPS (5)
The hydrant is used for firefighting, and a flow
rate of 5 liters per second provides a substantial
amount of water that is sufficient for smaller fire
emergencies. In general, the hydrant is put the place
which is closer to the water well or the entrance of the
resort.
(2) Water Consumption Model
A diagram of water consumption patterns will be
created using 24-hour patterns with hour coefficients.
This will help identify peak and off-peak
consumption periods, which will inform the design of
Design a Water Distribution Network for a Small Tourist Resort
261

the water distribution system. A model is created with
a diagram of water consumption for groups. One
house is in a node. One junction for the restaurant, one
junction for the club and one junction for the pool are
needed.
Parameters of network simulation experiments are
determined. The network's performance is observed
by adjusting parameters such as time step size and
network complexity. The model is then refined based
on experimental results. A model diagram of water
consumption is created, and the water consumption of
each room is calculated. Adjustments should be made
according to real-world conditions to achieve more
accurate conclusions in network simulation
experiments.
(3) Pump Selection
Assume that water is obtained from an
underground aquifer with a constant water level 16m
lower than the lowest row of houses, located 200m
from the resort. So pump is the main water supply of
this resort. A pump will be selected based on the need
to provide sufficient pressure to the highest elevation
house during maximum consumption periods, while
also ensuring that pressures do not exceed 6 bars and
are not lower than 2 bars anywhere in the network
during minimum consumption. The pump will be
sized to draw water from the underground aquifer and
deliver it to a central water storage tank or directly
into the distribution network.
When water consumption is low, the reservoir
stores the excess water, and during peak periods, it
helps distribute water to consumers.
When water consumption is high, the reservoir is
needed to distribute to the consumers. It's up to the
reservoir to calculate and have enough storage of that
reservoir for the consumers. The goal is to observe
how the pump operates during low and high
consumption, so the pattern is selected over a twenty-
four-hour period.
A pump curve, pressure control and frequency
regulation are combined to monitor the system's
dynamic needs.
A pump curve shows how a pump’s flow rate and
pressure are related, which helps to determine how the
pump will perform under different conditions and is
essential in selecting the right pump for specific
applications.
Pressure control is necessary to maintain
consistent water pressure throughout the system in a
water distribution system. If pressure is too high, it
can strain the system. If it is too low, water may not
reach all users effectively.
Frequency regulation aims to vary the speed of the
pump, and therefore the system can control both the
flow rate and the pressure.
In a resort's water supply network, during low-
demand hours, the pump speed can be reduced using
frequency regulation, keeping the system running at a
lower pressure and saving energy. During peak hours,
the pump speed is increased to maintain the necessary
water pressure and flow, ensuring guests have
adequate water for showering and other activities.
The pump curve helps to predict how the system will
behave under these varying conditions.
Pressure control and frequency regulation are
achieved by adjusting the pump's operating frequency
to prevent the system from overloading under high-
pressure conditions, ensuring a stable water supply.
Performance of the pump may be affected under
low consumption and high-pressure conditions, so it
is necessary to find the best solution. Adding pressure
control and frequency control during the simulation
process to address this issue.
(4) Pipe Sizing and Water Flow Analysis
Pipe dimensions must be determined through
detailed flow analysis, considering the varying water
demands and elevations of the houses. The goal is to
minimize pressure fluctuations and ensure a smooth,
uninterrupted water supply to all parts of the resort.
How to determine the appropriate pipeline size
based on pressure and pipeline diameter when
simulating water flow. It is necessary to consider the
method of obtaining water. The water source
provided by the resort is groundwater, then select the
appropriate pipeline based on the pressure and water
level of the groundwater. During the simulation
process, it is possible to observe whether the
minimum pressure requirement is met by adjusting
the diameter and height of the pipeline. In addition,
water flow can be better understood by viewing maps
and link values. Finally, it is necessary to check the
pipeline loss to ensure that it is within a certain range
(Gössling, 2017).
The selection of pipe diameter should be based on
an analysis of pressure loss, including both maximum
and minimum pressure. Through simulation
calculations, the optimal pipe diameter can be
determined.
Firstly, it is necessary to understand the pressure
loss of the pipeline, including the maximum and
minimum pressures. Then, through simulation
calculations, find the optimal pipe diameter. In the
resort project, it is possible to avoid relying too much
on the manufacturer's recommendations when
selecting pumps, and instead choose based on the
actual situation. Finally, the optimal pipeline diameter
MLSCM 2024 - International Conference on Modern Logistics and Supply Chain Management
262

found will be applied to practical engineering design
to achieve the best results.
In pipeline design, pressure-regulating valves can
be used to adjust the pressure of the pipeline system.
Firstly, connect an old pipeline to the port of a new
pipeline, and then set a pressure reduction setting.
Next, by changing the valve settings, the output
pressure of the pipeline system is reduced. During this
process, it can be observed that both upstream and
downstream pressures are changing.Finally, by
adjusting the pressure regulating valve, the pressure
of the pipeline system can reach ten meters.
Diagrams of pressure heads during the day will be
presented for two selected nodes: the lowest and
highest houses. They will illustrate how pressure
varies throughout the day, based on changing water
demands and pump operation.
(5) Simulation of Water Distribution Net
The parameter values of the junctions,pipes, the
pump and the aquifer of figure 2 are set up according
to the above design of water distribution net, the
project is run and the figure 3 and figure 4 are derived.
Figure 3: A small tourist resort with pressure (Photo/Picture
credit : Original).
Figure 4: A small tourist resort with head (Photo/Picture
credit : Original).
5 CONCLUSION
The study designed and simulated a water distribution
system for a small tourist resort located on a foothill
using a comprehensive approach. By carefully
considering the site layout, water demands, pressure
requirements, pump selection, pipe sizing and water
flow analysis, a reliable and efficient system can be
developed that ensures a consistent and safe water
supply for all guests and resort facilities. When
designing a water pump system, how to use these
components (such as pipelines) needs to be closely
integrated with actual needs, and each component
plays an important role in the system.
REFERENCES
Adeniran, A. E., & Oyelowo, M. A. 2013. An EPANET
analysis of water distribution network of the University
of Lagos, Nigeria. Journal of Engineering Research,
18(2), 69-83.
Bartkowska, I. 2014. Dynamics of water consumption
changes in a tourist resort. Journal of Ecological
Engineering, 15(4), 46–54.
Gössling, S., & Hall, C. M. 2017. Tourism and global
environmental change. Routledge. New York.
Gupta, I., Khitoliya, R.K., & Kumar, S. 2013. Study of
water distribution network using
EPANET. International Journal of Computational
Engineering Research, 3(6), 58-61.
Kakadiya, S., Mavani, K., Mehta, D., & Yadav, V. 2016.
Simulation of existing water distribution network by
using EPANET: A case study of Surat city. National
Conference on Recent Advances in Civil Engineering
for Global Sustainability, 1-9.
Košarac, A., Romić, D., Orašanin, G., & Blagojević, J. 2019.
Optimization of water supply system using software
EPANET 2.0. Springer International Publishing AG,
part of Springer Nature, 443–451.
Mazouz, K., Abdelraouf, B. 2021. Analysis of the
simulation of the water supply network of the new city
of Guelma by EPANET. Pakistan Journal of Geology,
5(1).
Ramana, G. V., Chekka, V. S. S. 2018. Validation and
examination of existing water distribution network for
continuous supply of water using EPANET. Water
Resources Management.
Subramanian, R. S. 2024. Engineering Bernoulli equation.
Retrieved from https://linweb.clarkson. edu/projects/s
ubramanian/ch330/notes/Engineering%20Bernoulli%2
0Equation.pdf
Thakur, S., Verma, A., Angral, V. K., & Ahanger, M. A.
2020. Design of water supply pipe networks in NIT
Srinagar using EPANET software. International Journal
of Engineering Research & Technology, 9(3).
Veer, S., Khandve, S., Pawar, Y., Marale, K., & Waghule,
A. 2022. Design of water supply network using
EPANET software. International Journal for Research
in Applied Science & Engineering Technology, 10(12).
Design a Water Distribution Network for a Small Tourist Resort
263
