
Statistics and Analysis of Netflix Stock Price in the Post-Pandemic
Era Based on Machine Learning Algorithms
Zimo Tang
a
The Department of Financial and Actuarial Mathematics, Xi 'an Jiaotong-Liverpool University, Suzhou, China
Keywords: Machine Learning, Stock Prediction, Netflix.
Abstract: This paper will focus on the analysis and prediction of Netflix's stock performance during and after the
pandemic. In the era following the influenza pandemic, there has been a significant change in consumer
entertainment consumption habits. As a leading player in the streaming industry, Netflix’s stock data is highly
representative and serves as a critical point for analyzing trends in the streaming sector. This study will select
various machine learning models, including deep learning algorithms and supervised learning algorithms, to
analyze Netflix’s stock. The main objective is to observe the predictive capabilities of these models under
abnormal conditions. The methodology involves several key steps: first, data preprocessing, including
cleaning and visualization; second, modeling analysis and parameter tuning; and finally, comparing the
predicted trend charts to assess the effectiveness of the models. The final conclusion will rank the models’
performance, with XGBoost performing the best, followed by Random Forest, and Long Short-Term Memory
(LSTM) showing relatively lower performance. By examining various algorithms, it sheds new light on the
application of advanced predictive models for financial forecasting, particularly during significant market
disruptions.
1 INTRODUCTION
Stocks are securities issued by companies, and the
stock market is the venue for trading these stocks.
Through buying and selling stocks, investors can
achieve capital appreciation or secure stable returns.
Brown and Smith highlighted the importance of stock
market forecasting in formulating investment
strategies and economic policies (Brown, 2019).
Accurate forecasts can assist investors in developing
strategies, optimizing portfolios, and maximizing
returns. Furthermore, policymakers and economists
can use market trend predictions to understand
economic health. Therefore, the prediction for stock
markets deserves more attention.
In recent years, the integration of artificial
intelligence and algorithms in the stock markets has
become increasingly widespread. Advances in
machine learning technology have provided new
possibilities for stock forecasting. In the context of
time series analysis, methods from deep learning
have proven highly effective. These approaches are
well-suited for modeling and analyzing data with
intricate and changing patterns, leading to improved
a
https://orcid.org/0009-0006-0168-9729
performance in handling complex dynamic features.
These technologies can process large amounts of
historical data and real-time information, identifying
potential patterns and relationships, thereby enabling
more precise predictions in a dynamically changing
market environment. Major applications include
predictive analytics, risk management, portfolio
optimization, and market sentiment analysis. For
instance, Patel and Sharma utilized machine learning
techniques for fraud detection and anomaly detection
in financial transactions (Patel, 2020). Related
research has also explored how sentiment analysis
and machine learning technologies can be utilized for
forecasting market sentiment and supporting
investment decisions (Silva, 2023).
However, the influence of external factors such as
economic policy changes and market sentiment has
made stock market trends more complex. Therefore,
improving prediction accuracy often requires
integrating advanced machine learning algorithms
and big data analytics. At the onset of the coronavirus
outbreak, the international economic landscape faced
severe challenges, with most industries encountering
unprecedented difficulties. However, for streaming
606
Tang, Z.
Statistics and Analysis of Netflix Stock Price in the Post-Pandemic Era Based on Machine Learning Algorithms.
DOI: 10.5220/0013277500004568
In Proceedings of the 1st International Conference on E-commerce and Artificial Intelligence (ECAI 2024), pages 606-610
ISBN: 978-989-758-726-9
Copyright © 2025 by Paper published under CC license (CC BY-NC-ND 4.0)

platforms like Netflix (Singh, 2020), the pandemic
unexpectedly acted as an accelerator. First, the
pandemic restricted travel and offline entertainment
activities, leading a significant number of consumers
to turn to online streaming services to meet their
entertainment needs. Netflix, with its extensive
content library and convenient viewing experience,
successfully attracted a large number of new users
and increased the stickiness of existing users.
Secondly, During the pandemic, the competitive
dynamics of the international streaming market
experienced significant changes. Netflix, by utilizing
its established brand reputation and strategic market
advantages, further reinforced its leading position,
outperforming rivals in viewership and subscriber
growth.
As of now, Exploration on Netflix's stock has
largely focused on normal periods. For example,
Singh and Kumar applied various machine learning
techniques to predict Netflix's stock prices and
evaluated the effectiveness of different techniques.
Alternatively, research has focused on improving
prediction accuracy. For instance, research proposed
a hybrid forecasting method combining ARIMA
models with neural networks to increase the
reliability of predictions for Netflix's stock price by
incorporating more precise data and advanced
analytical techniques (Garcia, 2021).
Considering the gap, this paper plans to focus on
the impact of the coronavirus pandemic as an external
factor on Netflix's stock market prices and explore the
development of the streaming industry in the post-
pandemic era through stock price predictions. By
comparing the accuracy of different machine learning
algorithms, aims to identify the most effective model
for abnormal stock fluctuations. The best model will
be used to forecast Netflix's stock prices, providing
valuable insights for investors and analyzing the
development of the media industry in the post-
pandemic era through the stock trends of Netflix, a
representative streaming enterprise.
2 METHOD
2.1 Preparation
The Netflix stock price dataset on Kaggle used in this
study provides historical data related to Netflix's
stock prices (Kaggle, 2024), often used for financial
analysis, time series forecasting, and data
visualization. This dataset comprises 6,750 data
points over six years, from December 2, 2019, to May
24, 2024. Typically, the data is available in CSV
format, easily imported into data analysis tools.
This study uses a dataset without missing values,
eliminating the need for imputation of missing
closing prices. Outliers, which may indicate
extremely high or low prices, are detected and
addressed using statistical methods such as Z-score or
IQR. To stabilize data variance and mitigate the
impact of extreme values, a moving window
approach smooths the stock price data, replacing the
original closing prices with the 30-day moving
average. The dataset is split into an 80% training set
and a 20% test set, ensuring adequate data for model
training and sufficient data for testing model
generalization. To realistically simulate the model's
performance in practical scenarios, the dataset is
divided into two segments: the training set, which
consists of the initial 80% of the data for model
training and development, and the test set, which
includes the remaining 20% for assessing the model's
accuracy and generalization.
Throughout the observation period, Netflix's
stock price demonstrated significant fluctuations and
growth. The average opening price was $432.54, with
a standard deviation of $528.40, reflecting
considerable uncertainty in opening prices. Similarly,
the highest price, lowest price, and closing price
exhibited comparable volatility, indicating a dynamic
valuation process by the stock market. During the
early pandemic, the global economy was severely
impacted, posing unprecedented challenges for most
industries. However, for streaming platforms like
Netflix, the pandemic acted as an unexpected
accelerator. Charts reveal a significant upward trend
in Netflix's stock price from 2020, with ongoing
fluctuations through 2024. Both opening and closing
prices rose substantially during this period, signalling
market optimism regarding Netflix's future growth
potential.
2.2 Machine Learning-Based Models
This study employs three models—Random Forest,
XGBoost, and LSTM—for comparative analysis,
utilizing historical stock price data to train and
validate the models' predictive performance. The
input data for the task includes historical stock prices,
the output of the task is the predicted stock price value
for a specific future period . To evaluate the
performance of the proposed models, this study used
Mean Absolute Error (MAE), Mean Squared Error
(MSE), and R2 metrics.
2.2.1 LSTM
The architecture of an LSTM includes four essential
components: the input gate, which controls the
integration of new information into the cell state; the
Statistics and Analysis of Netflix Stock Price in the Post-Pandemic Era Based on Machine Learning Algorithms
607

forget gate, which manages the retention or removal
of existing information from the cell state; the output
gate, which governs the flow of information to the
final output; and the cell state, which serves as a long-
term memory carrying information through time steps
(Hochreiter, 1997; Yang, 2020). In this research, the
LSTM model is configured with 50 hidden units
across three layers, enhancing its ability to detect
complex patterns in time series data. The output layer
is set to a dimension of 1, which aligns with the
single-variable nature of the data. A learning rate of
0.0005 is utilized to maintain optimization stability,
and the model undergoes training for 1,500 epochs.
To facilitate effective learning, the Adam optimizer,
known for its adaptive adjustment of learning rates, is
paired with the mean squared error loss function."
2.2.2 Random Forest
Random Forest is a method that utilizes an ensemble
of decision trees to make predictions (Breiman,
2001). By aggregating the outcomes of these trees
through averaging or voting, it delivers dependable
results for both classification and regression tasks. Its
exceptional performance and robustness have led to
its widespread use in time series forecasting recently.
In this study, the Random Forest model is specifically
configured with 100 decision trees, each limited to a
maximum depth of 3 to prevent overfitting, and a
learning rate of 0.1 to control the contribution of each
tree during training. This setup aims to enhance the
model’s accuracy and efficiency in predicting future
trends.
2.2.3 XGBoost
XGBoost is a highly efficient and scalable gradient
boosting framework that enhances model
performance by iteratively constructing a series of
ordered decision trees (Chen, 2016). Each tree
corrects the errors of its predecessor, improving
predictive accuracy and robustness. This iterative
approach makes XGBoost a favored choice for
various machine learning tasks. It supports parallel
computation and regularization to achieve rapid
training and reduce overfitting. XGBoost is widely
used across various fields, including machine
learning tasks such as classification, regression, and
ranking. Due to its outstanding performance and
versatility, XGBoost has become a crucial tool in data
science and machine learning. In this study, the model
is configured with 200 decision trees, each having a
maximum depth of 20. This setup is designed to
effectively capture complex data patterns while
minimizing the potential for overfitting.
3 RESULTS AND DISCUSSION
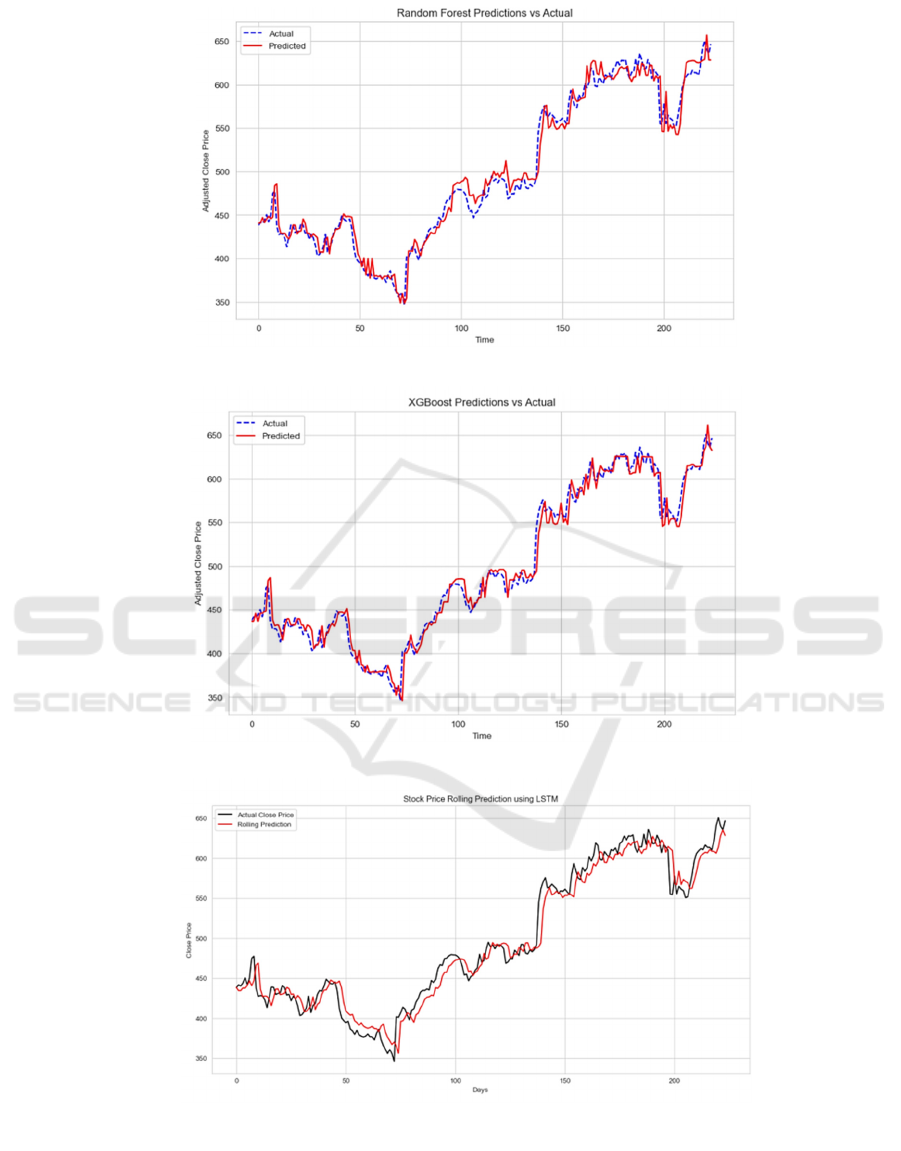
In predicting Netflix’s stock price, various models
were evaluated based on their performance in trend
prediction and metrics. Specifically, XGBoost
outperformed all other models in these metrics shown
in Table 1, Figure 1, Figure 2 and Figure 3, showing
the smallest deviation between predicted and actual
values and the highest correlation. In contrast,
Random Forest and Long Short-Term Memory
(LSTM) networks, while having their strengths, did
not match XGBoost’s consistency.
XGBoost demonstrated the best predictive
performance. This performance is attributed to
XGBoost’s advanced boosting technique, which
constructs a series of decision trees where each tree
corrects the errors of its predecessor. This iterative
correction, along with support for parallel computing
and regularization, enables XGBoost to handle
complex datasets effectively and capture intricate
stock price patterns. XGBoost’s ability to reduce
overfitting and maintain robustness across different
data subsets results in the lowest MSE and MAE and
the highest R².
An analysis of the performance data shows that
XGBoost outperforms other models across various
metrics. Specifically, its Mean Squared Error (MSE)
is 153.5109, which is notably lower than LSTM’s
MSE of 273.821, reflecting a reduction of about
120.31. This suggests that XGBoost has a smaller
discrepancy between its predictions and actual values.
Similarly, XGBoost’s Mean Absolute Error (MAE)
of 8.8367 is also superior to LSTM’s MAE of
12.5629, with a decrease of approximately 3.7262,
further indicating its better predictive accuracy.
While Random Forest’s R² is somewhat close to
XGBoost’s, at 0.9752 compared to 0.979, XGBoost’s
better performance in terms of MSE and MAE
highlights its overall robustness. On the other hand,
LSTM shows the poorest performance, with an R² of
0.9626, which is significantly lower than XGBoost’s,
creating a difference of 0.0164. These findings
emphasize the superior performance of XGBoost
with the Netflix dataset.
Table 1: The Performance of Different Models in the
Netflix Dataset.
Model Performance
MSE MAE R2
Random Forest 180.9926 10.0717 0.9752
XGBoost 153.5109 8.8367 0.979
LSTM 273.821 12.5629 0.9626
ECAI 2024 - International Conference on E-commerce and Artificial Intelligence
608
The subpar performance of LSTM may be attributed
to several factors, including difficulties in capturing
long-term dependencies within the dataset,
limitations in the amount of training data, and
challenges associated with optimizing
hyperparameters. Despite its capacity to handle long-
term dependencies, LSTM networks are susceptible
to overfitting in volatile stock markets, face
Figure 1: Price Prediction using Random Forest (Photo/Picture credit: Original).
Figure 2: Price Prediction using XGBoost (Photo/Picture credit: Original).
Figure 3: Price Prediction using LSTM (Photo/Picture credit: Original).
Statistics and Analysis of Netflix Stock Price in the Post-Pandemic Era Based on Machine Learning Algorithms
609

challenges with hyperparameter tuning, and are
sensitive to network architecture (such as layer and
unit numbers). Additionally, LSTM ’s high model
complexity demands extensive training data and
computational resources for parameter optimization,
which can constrain its practical utility. This suggests
that LSTM, though promising, requires further tuning
and feature engineering to enhance its performance.
For future improvements, systematic techniques
should be used to optimize model parameters,
enabling a thorough exploration of the parameter
space to identify the optimal configuration for each
model and maximize predictive accuracy. The
experimental framework should also be expanded to
include other machine learning models, such as
transformer-based architectures, for a broader
comparison of methods. Evaluating the accuracy,
efficiency, and robustness of these models will help
identify the most suitable model or ensemble for
stock price prediction. Current models have several
limitations. First, they often fail to account for
external factors, such as policy changes, news reports,
and market sentiment, which significantly impact
stock prices but are difficult to capture from historical
data alone. Future models should integrate these
factors into their analysis. Second, model
interpretability is poor. While achieving high
accuracy, models provide little insight into the
reasoning behind their predictions. Future research
should emphasize more interpretable machine
learning methods to explain model decisions. Finally,
models lack generalizability. They are typically
trained on single stocks and may not perform well
when applied to others. Future work should improve
model generalization to enhance adaptability and
practical use across different stocks.
4 CONCLUSIONS
This study employs machine learning models to
forecast Netflix’s stock prices during the pandemic
and post-pandemic periods, aiming to compare the
performance of different models under non-natural
fluctuations. The analysis includes XGBoost,
Random Forest, and LSTM algorithms. Through data
multiprocessing, model building, and hyper
parameter tuning, the performance of these models
was evaluated. The results indicate that XGBoost
achieved the best performance under the influence of
uncontrollable external factors like diseases, while
LSTM performed the worst. Additionally, this study
addresses the gap in forecasting Netflix’s stock
during abnormal periods, providing valuable insights
for investors. Future work will involve incorporating
additional machine learning models into the
prediction framework to compare their accuracy,
efficiency, and robustness, thereby identifying the
most suitable model or ensemble for specific
forecasting tasks.
REFERENCES
Brown, P. J., & Smith, C. M. 2019. The Importance of
Stock Market Forecasting: Implications for Investment
Strategies and Economic Policy. Financial Analysts
Journal.
Breiman, L. 2001. Random Forests. Machine Learning,
45(1), 5-32. https://www.stat.berkeley.edu/~breiman/
randomforest2001.pdf
Chen, T., & Guestrin, C. 2016. XGBoost: A Scalable Tree
Boosting System. Proceedings of the 22nd ACM
SIGKDD International Conference on Knowledge
Discovery and Data Mining (KDD 2016), 785-794.
https://arxiv.org/abs/1603.02754
Garcia, A., & Davis, C. J. 2021. Hybrid Forecasting
Approach for Netflix Stock Prices Combining ARIMA
and Neural Networks. Applied Economics Letters.
Hochreiter, S., & Schmidhuber, J. 1997. Long Short-Term
Memory. Neural Computation, 9(8), 1735-1780.
https://www.bioinf.jku.at/publications/older/2604.pdf
Kaggle, Netflix stock price, 2024, https://www.kaggle.
com/datasets/henryshan/netflix-stock-price/data
Patel, J. K., & Sharma, M. B. 2020. Anomaly Detection in
Financial Transactions Using Machine Learning.
Proceedings of the International Conference on Data
Mining.
Silva, A. J., & Murphy, H. R. 2023. Sentiment Analysis and
Machine Learning in Financial Markets. Financial
Analysts Journal.
Singh, R., & Kumar, P. 2020. Stock Price Prediction Using
Machine Learning Techniques: A Focus on Netflix.
International Journal of Financial Engineering and Risk
Management.
Yang, Z., Liu, H., & Zhang, H. 2020. A comprehensive
review on the application of LSTM in financial
forecasting. Computational Economics, 55(4), 1025-
1057.
ECAI 2024 - International Conference on E-commerce and Artificial Intelligence
610
