
Predicting Used Car Price Based on Machine Learning
Jiayi Lin
a
The Dorothy and George Hennings College of Science, Mathematics and Technology,
Wenzhou-Kean University, Wenzhou, Zhejiang, China
Keywords: Price Prediction, Used Car, Machine Learning.
Abstract: With used car sales in many countries surpassing new car sales, the automobile industry is important to the
global economy and in an unshakable position. Accurately predicting used car prices is beneficial for making
wise decisions for different interested parties, including consumers, car sellers, and some financial institutions.
This paper compares different regression models including Linear Regression (LR), Ridge Regression (RR),
and Random Forest (RF) to determine the most reliable method for predicting used car prices. The dataset is
sourced from CarDekho and has been preprocessed, which includes handling missing values, feature
engineering, and anomaly detection. The RF outperforms other models in terms of performance, indicating
higher prediction accuracy. However, limitations such as small sample size and potential overfitting indicate
the need for further model tuning and data expansion. To increase prediction accuracy and model robustness,
future research should concentrate on enhancing data quality, investigating new characteristics, and
implementing sophisticated encoding techniques.
1 INTRODUCTION
The automotive industry is the driving force behind
the economies of almost all industrialized countries,
whose cars account for over 70% of the total global
automobile manufacturing (Onat, 2024). This
dominance highlights the industry’s crucial role in the
global economy. The used car market often faces
issues of trust and information inequality, due to
sellers having more knowledge about the vehicle than
buyers. Despite this, the importance of the market for
used cars is still growing. (Eckhardt et al., 2022) The
sales in this market often exceed the sales of new cars,
particularly in the US, stressing its crucial role in the
modern economy. With the expansion of the market
and the diversification of consumer demand, it has
become an important supplement to new car sales.
This growth highlights the necessity of accurate price
forecasting to support informed decision-making by
both buyers and sellers, solving the inherent
challenges of trust and information gaps. For buyers,
it helps to buy a car at a reasonable price. As for
sellers, accurate price forecasting helps to develop
effective pricing strategies and improve profit
margins. Accurate price forecasts also help financial
a
https://orcid.org/0009-0005-5842-6594
institutions make more informed decisions on loan
evaluations and manage risks effectively, so that they
can benefit from reducing the chances of non-
performing loans.
To address this problem, researchers have
developed a looping architecture that blends deep
residual networks with extreme gradient boosting
(XGBoost) and light gradient boosting machines
(LightGBM). This idea helps to improve the accuracy
of forecasting through integrating deep learning
model outputs with original data features, offering a
promising solution for improving used car price
predictions (Cui et al., 2022). Recent research stresses
the accuracy of artificial neural networks (ANN) in
forecasting used car prices in contrast to conventional
techniques like Linear Regression (LR) and Random
Forests (RF). The ANN model trained on 140000
used cars performed better than these methods, with
an average absolute percentage error of 11% and an
𝑅
of 0.96, which demonstrates the potential of ANN
to improve price prediction in the context of rising
automotive costs and market fluctuations (Pillai,
2022). The rapid growth of the mobile Internet has led
to the decline of traditional offline used car trading
models, which gave rise to online platforms at the
Lin, J.
Predicting Used Car Price Based on Machine Learning.
DOI: 10.5220/0013270500004568
In Proceedings of the 1st International Conference on E-commerce and Artificial Intelligence (ECAI 2024), pages 553-560
ISBN: 978-989-758-726-9
Copyright © 2025 by Paper published under CC license (CC BY-NC-ND 4.0)
553

same time. Precise forecasting of the price of used
cars is important for fair dealings. In order to improve
the conventional BP neural network (BPNN), this
study presents a PSO-GRA-BPNN model that
combines particle swarm optimization (PSO) with
grey relational analysis (GRA) for feature selection.
The results show that the PSO-GRA-BPNN model
outperforms other models, with a MAPE of 3.936%,
significantly reducing prediction errors. This method
introduces a new method of evaluating used car
prices, which provides more reliable market pricing.
(Liu et al., 2022). Forecasting used car prices is vital
due to growing market demand. This article applies
K-Nearest Neighbor (KNN) regression to predict
used car prices using a supervised machine learning
model. The model used Kaggle data for training and
evaluated various train-test splits. The accuracy of the
suggested model was about 85%, which made it a
useful instrument for used car price prediction. K-
Fold cross-validation was also used in the study to
guarantee the robustness and dependability of the
model (Samruddhi et al., 2020). Recent research has
shown that using models like Artificial Neural
Networks (ANN) and RF can greatly increase the
predictability of used car prices. Through considering
multiple factors such as bias and data quality, these
models like RF outperform compared to simpler
methods like LR (Varshitha et al., 2022).
This study uses LR, RR, and RF to estimate the
cost of used cars and identify the best model. Precise
forecasting can help different interested parties
improve pricing strategies, leading to better decisions
and supporting the growth of the used car market.
2 DATASETS
This dataset is collected from the CarDekho website,
which is a popular online platform for buying and
selling cars in India. It provides a collection of car-
related data, which is useful for various analysis and
predictive modeling tasks.
2.1 Data Description
The dataset car_data.csv contains information on
used cars listed on the CarDekho platform, with a
total of 9 entries. Every car's name, year of
manufacture, selling price, and other information are
included in the dataset. The particular information is
outlined in Table 1.
Table 1: The caption has one line so it is centered.
Primary Explanation
Columns
The name of the car including the make
and model.
Car_Name The year of manufacture.
Year
The price at which the car is being sold
(
in INR
)
.
Selling_Price
The current price of the car when new (in
INR
)
.
Present_Price The total kilometers are driven by the car.
Kms_Driven
The type of fuel the car uses (e.g., Petrol,
Diesel, CNG
)
.
Fuel_Type
The type of seller (e.g., individual,
dealer)
Seller_Type
The type of transmission (e.g., Manual,
Automatic
)
.
Transmission The number of previous owners.
Owner The number of previous owners.
2.2 Data Preprocessing
After loading the vehicle sales dataset, this paper
began with data cleaning and feature engineering.
Missing values were addressed by either interpolating
them or removing the affected rows. Next, this paper
created a new feature, Age, by calculating the
difference between the production year and 2020,
which allowed us to drop the now redundant Year
column. Finally, this paper renamed the Selling_Price
and Present_Price columns to Selling_Price (lacs)
and Present_Price (lacs), the Owner column was
updated to Past_Owners.
To Tensure data quality, outlier detection was
performed by filtering records where values exceeded
the 99th percentile for numerical features such as
Present_Pr ice (lacs), Selling_Price (lacs), and
Kms_Driven. This approach identified potential
outliers, which were then addressed through data-
cleaning processes. As shown in Figure 1, Figure 2,
Figure 3, Figure 4 some outliers are clearly visible.
ECAI 2024 - International Conference on E-commerce and Artificial Intelligence
554
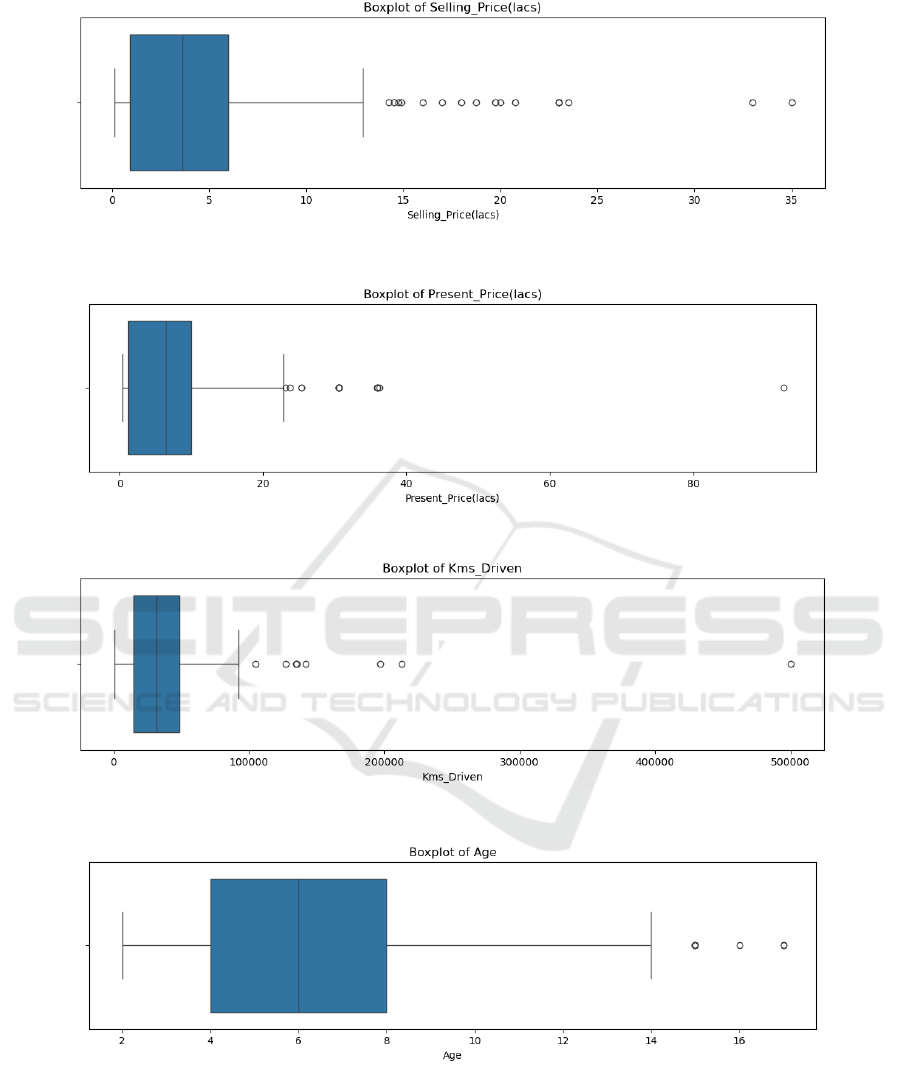
Figure 1: Boxplot of Selling_Price (lacs) (Photo/Picture credit : Original).
Figure 2: Boxplot of Present_Price (lacs) (Photo/Picture credit : Original).
Figure 3: Boxplot of Kms_Driven (Photo/Picture credit : Original).
Figure 4: Boxplot of Age (Photo/Picture credit: Original).
Subsequently, a correlation analysis was
conducted using a heatmap to examine the
relationships among numerical features. This analysis
revealed linear relationships between features and
their correlation levels with the target variable,
Selling_Price (lacs). The correlation coefficient
matrix helped identify features with strong
correlations to the predicted target, guiding feature
selection and optimization. As shown in Figure 5, it
can be seen that the target variable has a strong
correlation with Present_Price (lacs) and
Past_Owners.
Predicting Used Car Price Based on Machine Learning
555
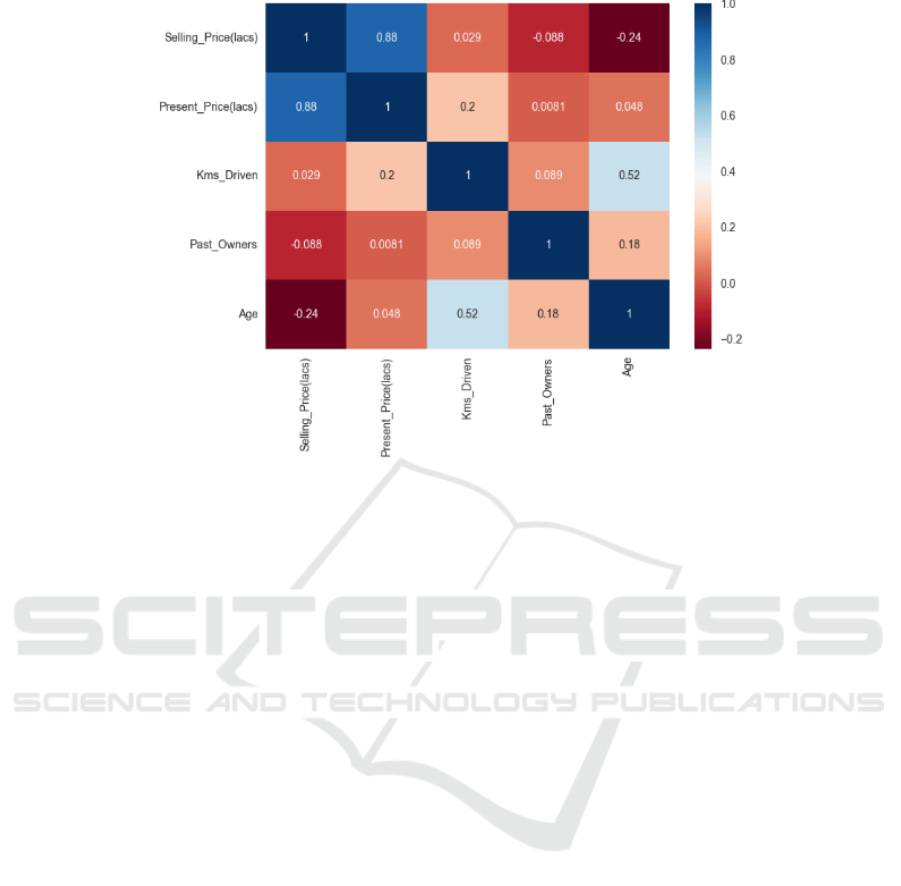
Figure 5: Heatmap (Photo/Picture credit : Original).
In the next step, after verifying that the Car_Name
feature had limited contribution and led to overfitting
in the prediction model, it was discarded. One-hot
encoding was then applied to the categorical features
using the pd.get_dummies function to convert them
into numerical form. This process included encoding
Fuel_Type, Seller_Type, Transmission, and
Past_Owners, with drop_first = True to avoid the
dummy variable trap and enhance model
performance.
In order to facilitate model training and
evaluation, the dataset was finally split into training
and test sets. The feature set X included all processed
features, while the target variable y was Selling_Price
(lacs). The data was divided into 80% training and
20% testing sets, allowing for a thorough evaluation
of the model's performance.
3 EXPERIMENT METHODS
3.1 Linear Regression
The linear relationship between the independent and
dependent variables is modeled using the basic
regression algorithm known as LR (Maulud &
Abdulazeez, 2020). It assumes that the target
variable 𝑦 is a linear function of the features 𝑋,
expressed as:
𝑦= 𝑋𝛽+ 𝜖
1
where 𝛽 represents the regression coefficients,
and 𝜖 is the error term.
The model estimates the coefficients 𝛽 by
minimizing the sum of squared errors (i.e., least
squares method):
𝑅𝑆𝑆= (𝑦
−𝑦
)
(
2
)
where 𝑦
is the predicted value from the model.
3.2 Ridge Regression
Ridge Regression (RR) is an extension of LR that
addresses multicollinearity (high correlation among
features). To keep the goal function from overfitting,
a regularization term is added (Dorugade, 2014):
𝛽
= 𝑎𝑟𝑔𝑚𝑖𝑛(𝑦
−𝛽
−𝛽
𝑥
+ 𝛼𝛽
)
(3)
𝛽
represents the estimated values of the
regression coefficients. 𝑦
is the actual output for the
i-th observation. 𝛽
is the intercept. 𝛽
denotes the
regression coefficients. 𝑥
represents the j-th feature
value for the i-th observation. 𝛼 is the regularization
parameter that controls the influence of the
regularization term on the model.
3.3 Random Forest
To increase accuracy and robustness, Random Forest
ECAI 2024 - International Conference on E-commerce and Artificial Intelligence
556
(RF), constructs several decision trees and averages
the forecasts they make (Biau & Scornet, 2016),
involves bootstrapping multiple subsets from the
training data, training a decision tree on each subset,
and averaging the predictions from all trees for
regression tasks. A few important model parameters
are min_samples_split, which indicates the minimum
number of samples needed to split an internal node,
min_samples_leaf, which indicates the minimum
number of samples required at a leaf node,
max_features, which limits the maximum number of
features considered for splitting each node, and
n_estimators for figuring out how many trees there
are in the forest. The following parameter ranges were
used in this study's Randomized Search CV
hyperparameter optimization: The range of
n_estimators was 500 to 1000 in steps 100;
max_depth was 4 to 8; min_samples_split was 4 to 8
in steps 2, min_samples_leaf comprised 1, 2, 5, or 7,
and max_features was either set to 'auto' or 'sqrt'.
4 RESULTS AND DISCUSSION
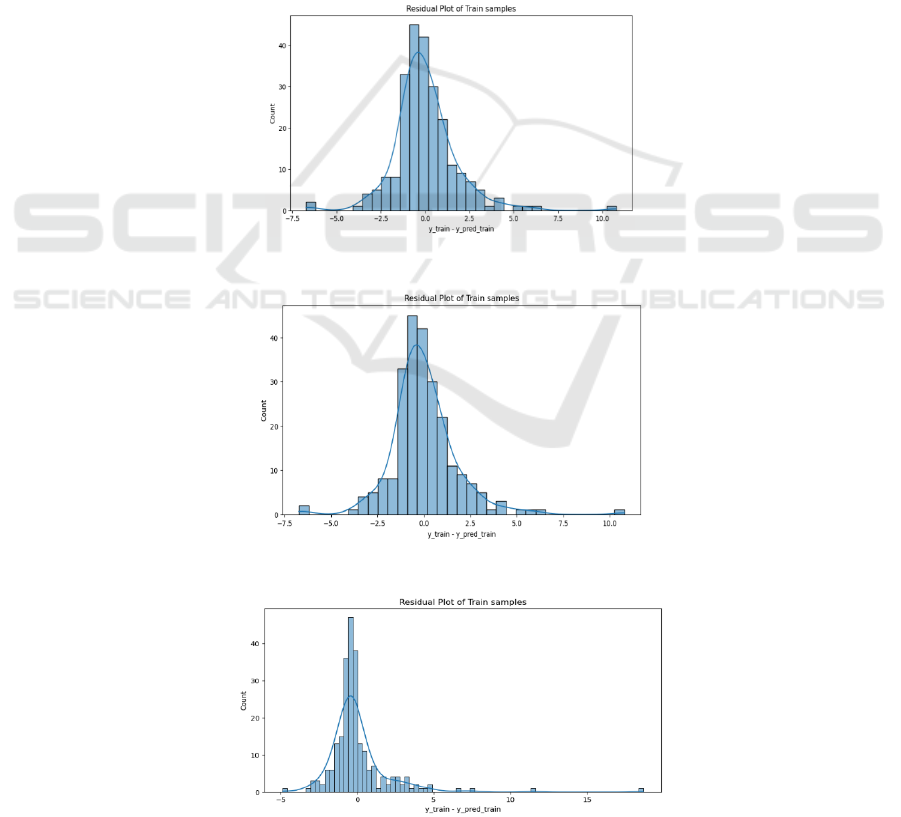
Figure 6, Figure 7, and Figure 8 show the residual
plots for the LR, RR, and RF, respectively, depicting
the distribution of prediction errors in the training
samples.
Figure 6: Residual plot of train samples of LR (Photo/Picture credit : Original).
Figure 7: Residual plot of train samples of RR. (Photo/Picture credit : Original).
Figure 8: Residual plot of train samples of RF (Photo/Picture credit: Original).
Predicting Used Car Price Based on Machine Learning
557
The residual distributions for both LR and RR
primarily fall within the range of -2.5 to 2.5, with the
maximum frequency observed at the 0.0 position.
This indicates that most residuals are close to zero,
suggesting that both models generally provide a good
fit with small prediction errors for the majority of the
data. However, the presence of residuals with larger
magnitudes, though less frequent, still indicates some
variability in prediction accuracy.
In contrast, the RF’s residual distribution shows a
higher concentration of smaller residuals around zero
compared to the other models, with a wider overall
spread. While this model fits the training data well
and avoids large errors, the frequent residuals to the
left of zero suggest a tendency to under-predict the
actual values. This consistent bias towards lower
predictions may indicate potential issues such as
overfitting or less accurate predictions in specific
instances.
Based on the images, it can be observed that LR
and RR provide stable predictions with smaller
residuals for most cases, but can struggle with larger
residuals due to linear assumptions or outliers. The
RF, while achieving high accuracy with smaller
residuals overall, may suffer from overfitting or bias
towards under-prediction, which can affect its
generalization to new data.
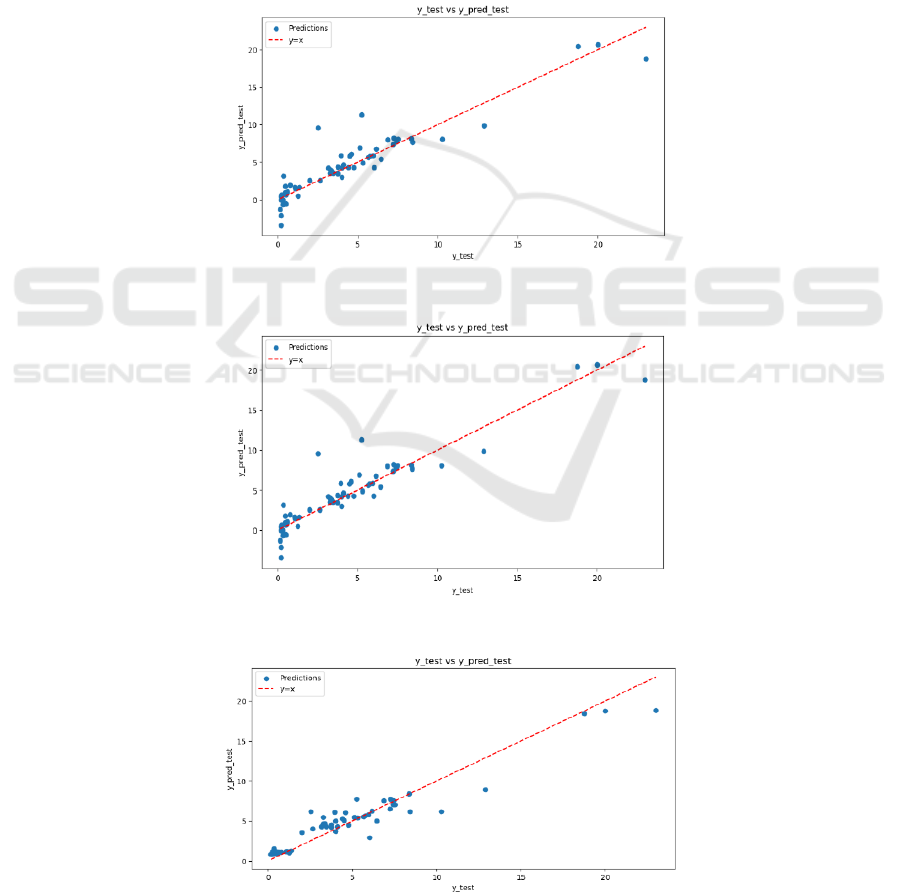
Figure 9: Predicted vs actual values plot of LR (Photo/Picture credit : Original).
Figure 10: Predicted vs actual values plot of RR (Photo/Picture credit : Original).
Figure 11: Predicted vs actual values plot of RF (Photo/Picture credit : Original).
ECAI 2024 - International Conference on E-commerce and Artificial Intelligence
558

Figure 9, Figure 10, and Figure 11 display the
scatter plots of y_test vs y_pred_test for the LR, RR,
and RF, respectively, presenting the test samples'
actual and expected values in comparison.
The predicted vs actual values plot is essential for
assessing model accuracy. It shows the correlation
between the test values that were obtained and the
values that had been expected. An ideal model would
show data points closely aligned with the diagonal
line where y_test equals y_pred_test. Points above the
line indicate under-predictions, while points below
suggest over-predictions.
The plots for both LR and RR show that the
majority of data points are closely aligned with the
diagonal line. This alignment indicates that both
models are generally accurate in their predictions.
Although there are some deviations, most predictions
show steady performance, coming in fairly near to the
actual values.
The RF plot shows that most points are also
aligned with the diagonal line. However, there are a
few points above the line, which indicate under-
predictions where the model’s predicted values are
lower than the actual values. This suggests that while
the RF performs well overall, it occasionally
underestimates car prices, reflecting some variability
in its predictions.
In the context of regression analysis, LR and RR
are known for their excellent stability. These features
make them particularly useful when they are used to
understand how the model makes its predictions.
They provide clear explanations of the relationship
between features and target variables. On the other
hand, RF is known for their high prediction accuracy.
However, achieving superb performance with this
model typically requires careful hyperparameter
tuning. This process not only improves the model's
generalization ability to new data but also reduces the
risk of overfitting.
5 LIMITATION AND OUTLOOKS
In this research, different regression models were
compared to predict used car prices. However, several
limitations may affect the accuracy of the models.
Firstly, the quantity and quality of the data present
constraints. The dataset used may have a small
sample size, which could limit the effectiveness and
predictive ability of model training. Additionally,
although missing values were addressed, some
outliers may still be present, introducing noise and
affecting prediction accuracy. Furthermore, feature
selection presents challenges. While basic car
information was used, other important factors
influencing car prices, such as specific car
configurations and changes in market demand, may
have been overlooked. The feature engineering
approach also has limitations; for categorical features
like Fuel_Type and Seller_Type, simple One-Hot
encoding may not fully capture their latent
information.
To address these issues, several improvements are
suggested. Expanding the dataset is crucial for
enhancing model performance. Increasing the sample
size can improve the stability of model training and
predictions, particularly by collecting data from
various sources. Improving data quality control,
especially in managing missing values and outliers,
will enhance the reliability of the models.
Additionally, employing more advanced feature
processing techniques can further improve model
performance. Finally, using complex encoding
methods and different transformation techniques
could also contribute to better model performance and
accuracy.
6 CONCLUSIONS
Accurate forecasting of used car prices is important
for consumers to achieve reasonable purchases,
dealers to set effective prices and manage inventory,
and financial institutions to manage risks better. This
study evaluated the efficacy of many regression
models for used car price prediction and compared
them. By analyzing LR, RR, and RF, and found that
the RF demonstrated the greatest performance on the
training and test datasets. Therefore, it shows that the
RF is better at capturing the complex nonlinear
relationships in the data and providing more accurate
predictions. However, there were some limitations
due to the small dataset, which may impact model
accuracy. Data exceptions and feature selection issues
also affected model performance. Upcoming research
should concentrate on improving data quality control
and exploring additional features. Using advanced
feature engineering and encoding techniques could
further enhance model performance. Overall, this
research provides insights into forecasting used car
prices and highlights the relative advantages and
disadvantages of different regression models at the
same time. By improving data processing procedures
and model training methods, more reliable
predictions can be achieved in practical applications.
Predicting Used Car Price Based on Machine Learning
559

REFERENCES
Biau, G., Scornet, E., 2016. A random forest guided tour.
Test, 25, 197-227.
Cui, B., Ye, Z., Zhao, H., Renqing, Z., Meng, L., Yang, Y.,
2022. Used car price prediction based on the iterative
framework of XGBoost+ LightGBM. Electronics,
11(18), 2932.
Dorugade, A. V., 2014. New ridge parameters for ridge
regression. Journal of the Association of Arab
Universities for Basic and Applied Sciences, 15, 94-99.
Eckhardt, S., Sprenkamp, K., Zavolokina, L., Bauer, I.,
Schwabe, G., 2022. Can artificial intelligence help
used-car dealers survive in a data-driven used-car
market. In International Conference on Design Science
Research in Information Systems and Technology (pp.
115-127). Cham: Springer International Publishing.
Liu, E., Li, J., Zheng, A., Liu, H., Jiang, T., 2022. Research
on the prediction model of the used car price in view of
the pso-gra-bp neural network. Sustainability,14(15),
8993.
Maulud, D., Abdulazeez, A. M., 2020. A review on linear
regression comprehensive in machine learning. Journal
of Applied Science and Technology Trends, 1(2), 140-
147.
Onat, M. G., 2007. Otomotiv sektöründe oranlar yöntemi
aracılığı ile finansal Analiz (Master's thesis, Marmara
Universitesi (Turkey)).
Pillai, A. S., 2022. A Deep Learning Approach for Used Car
Price Prediction. Journal of Science & Technology,
3(3), 31-50.
Samruddhi, K., Kumar, R. A., 2020. Used car price
prediction using K-nearest neighbor based model. Int.
J. Innov. Res. Appl. Sci. Eng. (IJIRASE), 4(3), 2020-
686.
Varshitha, J., Jahnavi, K., Lakshmi, C., 2022. Prediction of
used car prices using artificial neural networks and
machine learning. In 2022 international conference on
computer communication and informatics (ICCCI) (pp.
1-4). IEEE.
ECAI 2024 - International Conference on E-commerce and Artificial Intelligence
560
