
Sales Forecasting in Retail Supply Chain Management
Junkai Zhao
a
School of Economics and Management, Beihang University, Beijing, China
Keywords: Sales Forecasting, Polynomial Regression, Random Forest, Retail Analytics, Feature Importance Analysis.
Abstract: In the actual production environment, the forecast of demand or sales volume is extremely important, accurate
prediction can not only effectively reduce inventory costs, but also greatly reduce production and
manufacturing costs, reduce unnecessary waste, not only that, in management, people find that the oxtail
effect will have a great impact on the stability of the supply chain, and the prediction of sales volume can
effectively reduce the negative impact of the effect, this study will take Wal-Mart's real sales volume dataset
as an example, Comparing the performance of Polynomial Regression and Random Forest (RF) in the face of
sales volume datasets, including the accuracy of prediction and generalization ability, and finding the factors
that have the greatest impact on sales volume from many objective factors affecting sales volume in the
construction process of the model, these experimental results will have important practical significance for
inventory management and resource allocation.
1 INTRODUCTION
In the retail industry, sales volume forecasting has a
very important impact on the decision-making of
retail enterprises, especially in the current
environment of lean management in the retail
industry and other manufacturing enterprises,
enterprises need to meet customer needs while
minimizing costs or maximizing benefits, and in retail
and manufacturing, inventory costs and other costs in
the supply chain account for a large part of the total
cost (Koumanakos, 2008), and sales volume
forecasting can effectively control the production
plan of enterprises in a certain sense(Carbonneau et
al., 2008). Controlling inventory costs also plays a
crucial role in communicating with suppliers,
manufacturers, distributors, and other elements of the
supply chain (Ramos & Oliveira, 2023), so it is
necessary for the retail industry to find ways to
accurately predict sales volumes (Aburto, 2007). This
experiment will use Walmart as an example to
explore which prediction method is more effective. In
this paper, Wal-Mart is selected as a case for
prediction, and there are some profound
considerations. First of all, as one of the world's
largest retailers, Walmart has rich experience in
inventory management and also has rich experience
a
https://orcid.org/0009-0008-4522-5066
in upstream and downstream management of the
supply chain, and as one of the world's largest retail
enterprises, Wal-Mart can results to the fluctuation of
objective factors, so as to better evaluate the impact
of changes in objective factors on sales volume.
When discussing the impact of sales forecasts on
the supply chain of enterprises, people have to think
about the impact of the bullwhip effect on the supply
chain. The term bullwhip effect is used to describe the
slow change in consumer demand that has a greater
impact on suppliers at the other end of the supply
chain, and this impact will gradually amplify as the
supply chain deepens, and this effect is mainly
manifested in the fluctuation of production plans and
orders, which leads to unknown fluctuations leading
to higher production costs and inventory costs (Wang
& Disney, 2016). With the progress of management,
people have also found a lot of ways to solve the
bullwhip effect, sales forecasting is also one of them,
if the enterprise can predict the trend of customer
demand based on historical sales data, then the
enterprise can greatly reduce the impact of inventory
accumulation or insufficient inventory on the
enterprise (Boone et al., 2019).
The primary objective of this research is to
explore and compare the effectiveness of Polynomial
Regression and Random Forest (RF) models in the
542
Zhao, J.
Sales Forecasting in Retail Supply Chain Management.
DOI: 10.5220/0013270200004568
In Proceedings of the 1st International Conference on E-commerce and Artificial Intelligence (ECAI 2024), pages 542-546
ISBN: 978-989-758-726-9
Copyright © 2025 by Paper published under CC license (CC BY-NC-ND 4.0)

context of Walmart's supply chain, with a particular
focus on mitigating the bullwhip effect. Specifically,
this study will analyze the performance of these
models in predicting sales and their potential impact
on supply chain efficiency.
By evaluating the accuracy and robustness of
these models, the research aims to provide insights
into which methods are best suited for handling the
complexities of sales forecasting in a large-scale retail
environment. The findings from this study will
contribute to the ongoing efforts to optimize supply
chain operations and reduce the inefficiencies caused
by inaccurate demand predictions.
The remainder of this paper is organized as
follows. Section 2 presents the data collection
process, including data description and preprocessing
steps, as well as an overview of the models used for
sales forecasting. Section 3 details the results and
discussion, where the performance of each model is
evaluated, and the implications for supply chain
management are explored. Section 4 discusses the
limitations of the study and offers suggestions for
future research. Finally, Section 5 concludes the
paper by summarizing the key findings and their
relevance to improving supply chain efficiency in the
retail industry.
2 DATASETS
The data utilized in this study comes from Kaggle,
which includes weekly sales figures across various
stores in different regions. The data in this article
describes the sales data of 45 Walmart stores from
May 2, 2010, to October 19, 2012. Table 1 shows the
description of the dataset. Table 2 shows the
descriptive statistics of the dataset.
In terms of data integrity, there are a total of 6435
entries in this dataset, and there is no missing data or
feature, when processing the data, this experiment
conducts a detailed check on the data integrity
through the code, and no data is missing, and at the
same time, there is no duplication of the checked data.
In this experiment, a simple descriptive statistic
was performed on the data to better observe the data.
Before making data predictions, the data is pre-
processed to allow the experiment to be better
modeled. Data preprocessing is mainly divided into
the following four parts: data processing, feature
engineering, feature encoding, and data
standardization processing. Here's a closer look at the
data preprocessing part:
Firstly, the date data is processed by converting
the Date part into a format that can be used for
analysis. During this process, year, month, day, and
other relevant characteristics are extracted to
facilitate a better understanding of which factors have
the most significant impact on sales volume in
subsequent analyses. Next, feature engineering is
carried out by determining the season based on the
date of sale. The season is then used as an important
feature to analyze sales volume, alongside other
characteristics such as holidays, to study whether
these factors have a significant impact on sales. To
further improve the analysis, feature coding is
applied. This involves binary encoding of the store
identifiers and seasons, converting these features into
data types that are more suitable for analytical
Table 1: Data description.
Variable
Description
store Refers to the name of the sales store, identified b
y
numbers from 1 to 45.
Holiday
Indicates whether the date falls within a holiday period, as holidays can promote consumer spending and
are an important factor that may affect sales.
Tempe
r
ature
Records the average temperature of the week in the area where the store is located.
Fuel_Price
Specifically, it refers to the average price of oil in the area where the store is located during the week.
CPI
The relative number reflects the trend and degree of price changes of consumer goods and services
purchased by urban and rural residents during a period. It is the result of a comprehensive calculation of
the urban consumer price index and the rural consumer price index. This dataset refers to the average
CPI index in the United States during the week.
Unem
p
lo
y
ment The unem
p
lo
y
ment rate in the area where the store is located durin
g
the time
p
eriod.
Table 2: Descriptive statistics.
Feature Mean Standard Deviation Minimu
m
Maximu
m
Weekly_Sales 1,046,965.00 564,366.60 209,986.20 3,818,686.00
Temperature 60.66 18.44 -2.06 100.14
Fuel_Price 3.36 0.46 2.47 4.47
CPI 171.58 39.36 126.06 227.23
Unem
p
lo
y
ment 7.99 1.88 3.88 14.31
Sales Forecasting in Retail Supply Chain Management
543

processing. Finally, data standardization is
performed, normalizing the individual data features
so that they all share the same dimensions, which is
crucial for the effectiveness of the subsequent training
and analysis phases.
3 MODEL
3.1 Model Selection
In this experiment, two models were selected,
Polynomial Regression (Heiberger et al., 2009) and
RF (Biau & Scornet, 2016), which have their own
advantages and disadvantages in processing data and
both models can build point prediction models at the
time of prediction (Hastie et al., 2009). Therefore, the
experiment will input different feature vectors at a
certain point in time to predict the sales volume.
Finally, the experiment will use the results of the two
models to compare the results of the two models in
predicting sales volume and observe which model can
better predict sales volume.
3.2 Polynomial Regression
This experimental model is affected by many factors,
as shown in the previous part of the data
characteristics, there are many other objective factors
that affect the sales volume, which may lead to the
model is not linear, so from a certain point of view,
the introduction of higher terms can better predict the
model, at the beginning of the experiment, the linear
model was used to predict, but the results are not ideal
as mentioned above, so the introduction of
polynomials is of great necessary. At the same time,
the model structure of Polynomial Regression is
relatively simple and easy to explain (Darlington &
Hayes, 2016).
In the process of Polynomial Regression model
construction, the experiment is not only a simple
construction of the model but also uses the network
search to optimize the hyperparameters of the
Polynomial Regression model to adjust the order of
the polynomial to find the optimal model.
3.3 Random Forest
Random Forests (RF) can also have a better
prediction effect for sales with multiple
characteristics, and they can capture these complex
relationships by randomly sampling features (Rigatti,
2017). The strong nonlinear modeling ability and
strong adaptability are also the reasons for choosing
this model in this experiment. Therefore, in this
experiment, RF is used to construct multiple decision
trees, and their prediction results are combined to deal
with high-level data and complex linear relationships.
4 EXPERIMENTAL PROCESS
4.1 Experimental Evaluation
Indicators
To compare the results of the two experimental
models and determine which model performs better,
research evaluated the experimental results using two
indicators: Root Mean Square Error (RMSE) and R-
squared ( R
). The specific formulas for these
indicators are provided in Equation (1) and Equation
(2).
RMSE =
1
𝑛
𝑦
−𝑦
1
R
=1−
∑
𝑦
−𝑦
∑
𝑦
−𝑦
2
The 𝑦
means the actual value (true value), 𝑦
means the predicted value. 𝑦
means the mean of all
actual values,.In the formula, the actual sales are the
predicted sales, and n is the number of observations.
When the RMSE value is smaller, the better the
experimental results, the worse the performance of
the opposite model. These metrics were calculated for
both the training and testing datasets to evaluate the
models' performance and their ability to generalize to
unseen data.
When the value is closer to 1, the better the model
result, and the better the experimental result.
In addition, this paper uses cross-validation to
evaluate model performance. Cross-validation scores
are an important metric for evaluating the
generalization ability of machine learning models.
This indicator divides the dataset into k subsets, the
model is trained on a subset, and verified on the
remaining subset, repeated k times, so as to obtain k
performance indicators, the performance indicators
used in this paper are indicators, and after k indicators
are obtained, the overall performance of the model
and the stability of data division through the mean and
standard deviation of these k indicators, so as to
evaluate the generalization ability of the model in
predicting values.
ECAI 2024 - International Conference on E-commerce and Artificial Intelligence
544
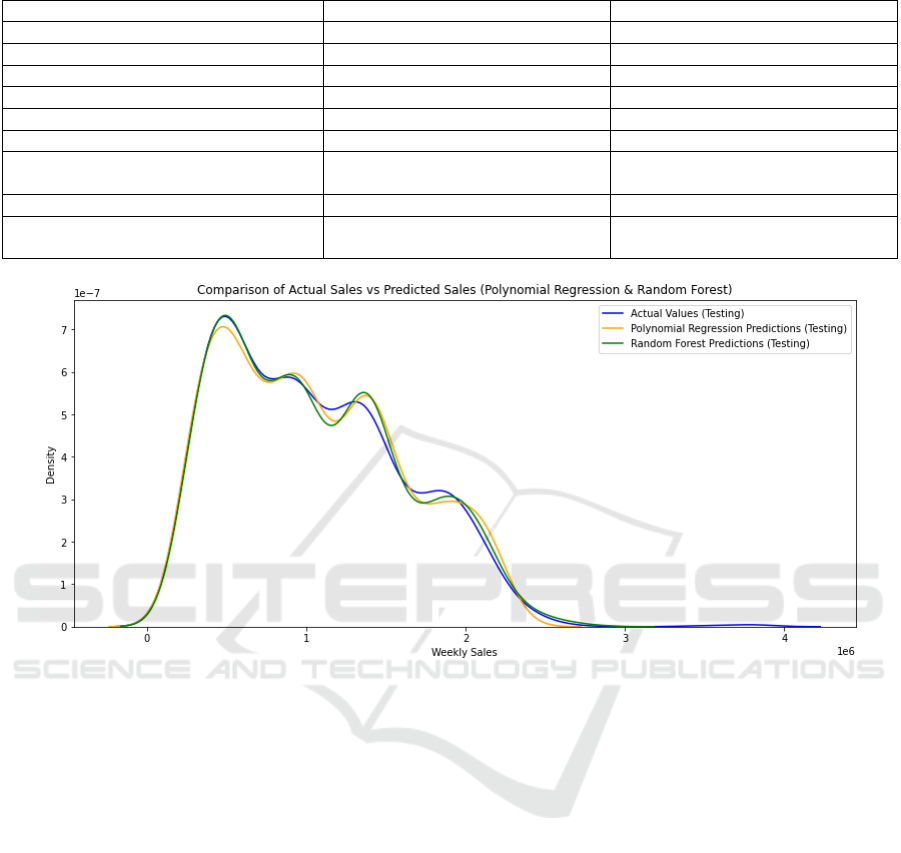
Table 3: Experiment results of polynomial regression and random forest.
Metrics Pol
y
nomial Re
g
ression Random Forest
Trainin
g
RMSE 75,434.78 52,066.51
Trainin
g
RMSE Error Scale 2.12% 1.65%
Training R-square
d
98.27% 99.15%
Testing RMSE 106,048.59 145,701.86
Testing RMSE Error Scale 3.21% 5.74%
Testin
g
R-s
q
uare
d
96.47% 93.41%
Cross-Validation Scores
[0.9567, 0.9585, 0.9623, 0.9634,
0.9581]
[0.9277, 0.9408, 0.9328, 0.9201,
0.9432]
Mean of Cross-Validation Scores 95.98% 93.29%
Standard Deviation of Cross-Validation
Scores
0.0026 0.0085
Figure 1: The models' prediction curves (Photo/Picture credit: Original).
4.2 Experimental Results
In the experiment, researchers used different degrees
of polynomials to fit the model to find a model that
took into account both accuracy and simplicity, in
order to find a better model, the experiment used the
hyperparameter tuning method to better fit the model,
The experimental results are shown in Table 3 and
Figure 1.
The X-axis represents the weekly sales values
(both actual and predicted). The Y-axis represents the
density or frequency of these sales values, indicating
how often different sales values occur within the
dataset.
For the training set, the RF model performed
better, with a smaller RMSE value and a value of R
closer to 1, while for the test set, the Polynomial
Regression model performed better, and in the cross-
validation score, the value of Polynomial Regression
is also significantly closer to 1 than that of the RF. In
some respects, the RF model is slightly overfitting
compared with the polynomial model, and the
generalization ability is poor in the face of more
complex and unknown sales models.
4.3 Feature Importance Analysis
Before using RF to predict sales, this paper used an
RF model to calculate feature importance. When
calculating importance, this paper arrives at an
importance score by evaluating the contribution of
each feature to the model's accuracy in the splitting of
the tree. The results of the feature importance analysis
are shown in Figure 2. In this analysis, this paper has
removed the influence of stores in the analysis of the
importance of characteristics because the difference
in stores due to regional and demographic factors can
greatly affect sales. In addition to the difference in
shops, CPI is the biggest factor affecting sales, the
unemployment rate is also an important factor
affecting sales, temperature, fuel prices and holidays
have a certain impact on sales, but compared to CPI
the unemployment rate has a small impact.
Sales Forecasting in Retail Supply Chain Management
545
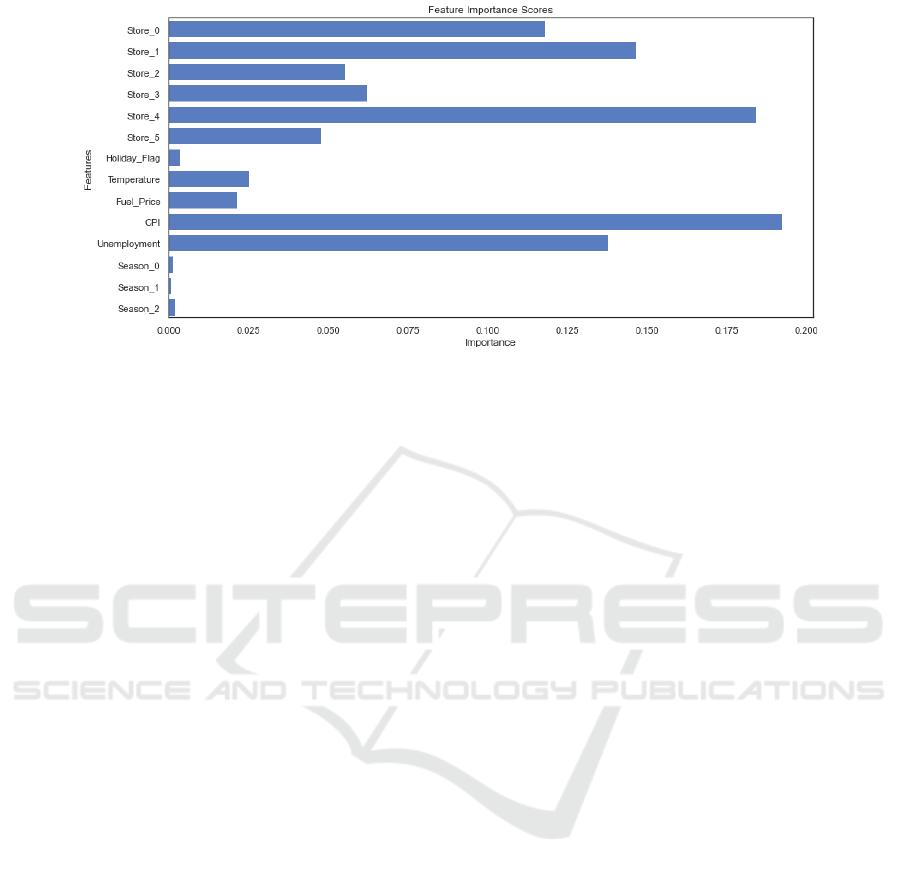
Figure 2: Feature Importance Scores (Photo/Picture credit: Original).
5 CONCLUSIONS
This study aimed to predict Walmart's sales volume
and assess which model better supports inventory
control, supply chain management, and mitigating the
bullwhip effect. Polynomial Regression and RF
regression were evaluated for prediction accuracy and
generalization ability. The results indicate that while
both models perform well, there are notable
differences. RF demonstrated superior performance
on the training set with lower RMSE and values
closer to 1. However, on the test set, Polynomial
Regression outperformed RF, with smaller RMSE
values and values nearer to 1. This suggests that
Polynomial Regression offers stronger generalization
capabilities. Cross-validation further confirmed that
Polynomial Regression maintains a higher average
value, indicating better prediction performance across
various scenarios. For retail supply chain
management, selecting a model with strong
generalization is crucial. Although RF shows better
fitting on training data, Polynomial Regression's
superior generalization makes it more suitable for
predicting sales in dynamic environments.
Nonetheless, this does not discount the potential of
RF or other models. Exploring additional data science
methods can address overfitting and enhance
generalization. Future research should integrate
supply chain management tools and strategies, and
evaluate a broader range of models - including LSTM
and other machine learning and deep learning
techniques - to improve prediction accuracy and
supply chain effectiveness.
REFERENCES
Biau, G., & Scornet, E., 2016. A random forest-guided tour.
Test, 25, 197-227.
Boone, T., Ganeshan, R., Jain, A., Sanders, N. R., 2019.
Forecasting sales in the supply chain: Consumer
analytics in the big data era. International journal of
forecasting, 35(1), 170-180.
Carbonneau, R., Laframboise, K., & Vahidov, R. (2008).
Application of machine learning techniques for supply
chain demand forecasting. European journal of
operational research, 184(3), 1140-1154.
Darlington, R. B., Hayes, A. F., 2016. Regression analysis
and linear models: Concepts, applications, and
implementation. Guilford Publications.
Koumanakos, D. P., 2008. The effect of inventory
management on firm performance. International
journal of productivity and performance
management, 57(5), 355-369.
Hastie, T., Tibshirani, R., Friedman, J., Hastie, T.,
Tibshirani, R., Friedman, J., 2009. Random forests. The
elements of statistical learning: Data mining, inference,
and prediction, 587-604.
Heiberger, R. M., Neuwirth, E., Heiberger, R. M.,
Neuwirth, E., 2009. Polynomial regression. R Through
Excel: A Spreadsheet Interface for Statistics, Data
Analysis, and Graphics, 269-284.
Ramos, P., Oliveira, J. M., 2023. Robust Sales forecasting
Using Deep Learning with Static and Dynamic
Covariates. Applied System Innovation, 6(5), 85.
Rigatti, S. J., 2017. Random forest. Journal of Insurance
Medicine, 47(1), 31-39.
Wang, X., Disney, S. M., 2016. The bullwhip effect:
Progress, trends and directions. European Journal of
Operational Research, 250(3), 691-701.
ECAI 2024 - International Conference on E-commerce and Artificial Intelligence
546
