
Improvements of Time Series Prediction Models for ExxonMobil
Based on Moving Averages
Wenjie Deng
Finance Department, Shanghai Lixin University of Accounting and Finance, Shanghai, China
Keywords: Time Series Forecasting, Moving Averages, Stock Price Forecasting, Energy Sector.
Abstract: Time series forecasting plays a crucial role in financial analysis, especially in predicting stock prices and
guiding investment strategies. In this study, ExxonMobil will be used as the research object to test a price
prediction model based on moving averages. The data is derived from historical stock data provided by Yahoo
Finance, and metrics such as the 10-day Simple Moving Average (SMA), 20-Day Exponential Moving
Average (EMA), Relative Strength Index (RSI), and Moving Average Convergence Divergence (MACD)
from Python's stockstat library are added to the model as enhancements to the historical forecasting model.
The enhanced model fits well, with an R-square value of 0.8546, showing significant prediction accuracy.
While the model is effective in capturing the overall trend, it is less consistent with the actual performance of
the market during periods of high volatility. For petrochemical module companies, the impact of international
oil prices and geopolitical events cannot be ignored. These results suggest that adding industry-specific
dynamic-specific technical indicators to forecasting models can greatly improve stock price forecasts, thereby
providing valuable insights for financial analysts and investors who focus on the energy market.
1 INTRODUCTION
Since its creation, time series forecasting has been an
important tool in financial analysis, and price
prediction models built on it enable investors and
analysts to predict future stock movements based on
historical price data. Due to its accuracy, this type of
prediction is also considered one of the most
important model building methods. Moving averages
(MAs), including simple moving averages (SMAs)
and exponential moving averages (EMAs), have been
widely used to identify market trends, especially in
sectors with high stock price volatility such as
petrochemicals (Yadav et al., 2024). Looking back at
the earliest time series forecasting models, they were
simple models built on the basis of MAs, which
smoothed the fluctuation curve of stock prices by
averaging data points for a specific period (Tsay,
2019). Over the next few decades, time series
forecasting methods have evolved considerably, and
researchers have added more sophisticated statistical
and computational techniques to them. Early
innovations include models (e.g., the Autoregressive
Composite Moving Average, ARIMA), which were
developed to explain more complex data patterns,
using autoregressive and differential to deal with non-
stationary data, with remarkable results (Guresen et
al., 2011). Because the ARIMA model can model
time-dependent structures such as seasonality and
trend in stock prices, it has become a basic tool and
underlying logic for financial time series analysis in
subsequent use (Fischer & Krauss, 2018).
Recent research has further expanded the scope of
time series forecasting by incorporating machine
learning and deep learning models. Techniques such
as long short-term memory (LSTM) networks and
gated recursive units (GRUs) have emerged, and
these models are particularly adept at capturing long-
term dependencies and nonlinear relationships in data
(Althelaya et al., 2018). Through more complex
patterns learned from large datasets, these models far
outperform traditional models in highly volatile
markets (Guresen et al., 2011). Considering that the
target of this study is a company in the petrochemical
industry, ExxonMobil, which will face more market
dynamics and volatility caused by external factors,
the application of more advanced forecasting
techniques such as LSTM and GRU has the scope to
refines the effectiveness of forecasting (Bustos &
Pomares-Quimbaya, 2020).
For financial forecasting, mainstream research
tends to focus more and more on improving
510
Deng, W.
Improvements of Time Series Prediction Models for ExxonMobil Based on Moving Averages.
DOI: 10.5220/0013269700004568
In Proceedings of the 1st International Conference on E-commerce and Artificial Intelligence (ECAI 2024), pages 510-515
ISBN: 978-989-758-726-9
Copyright © 2025 by Paper published under CC license (CC BY-NC-ND 4.0)

forecasting accuracy by adding machine learning
techniques into traditional time series models. It's
easy to see that hybrid models that combine ARIMA
with deep learning methods such as LSTM do a great
job of capturing intricate price movements, so it's also
particularly useful for studying stocks with high
volatility (Zolfaghari & Gholami, 2021). Traditional
methods tend to ignore nonlinear relationships and
external factors, or cannot actively incorporate them
into the same model for study due to technical
limitations, but new models will actively take them
into account in order to achieve more accurate
prediction criteria.
In the energy sector, the impact of external factors
such as crude oil prices, geopolitical tensions, and
regulatory changes adds more complexity to
forecasting models (Lin et al., 2021). Traditional
models rely mainly on historical price data, which is
often difficult to account for these influencing factors,
so additional indicators and more advanced
modelling techniques are needed (Ding & Qin, 2020).
This study further advances the forecasting model by
adding technical indicators calculated by adding
Python libraries such as stockstats to the model to
make it more in line with real-world market
conditions. The advent of library application
indicators such as stockstats in the Python library has
further advanced the development of this field, and by
integrating these indicators, the predictive ability of
the model has been further enhanced, and the
automatic calculation of various technical indicators
has been possible (Su et al., 2022). By incorporating
these metrics, researchers are able to refine their
forecasting models to better align them with real-
world market conditions. In the energy sector, the
price of a stock can be affected by factors beyond the
control of a single company, and the above model can
be used to better simulate the stock price.
In addition, the integration of technical indicators
such as the Moving Average Convergence
Divergence Indicator (MACD), the Relative Strength
Index (RSI), and the Bollinger Bands can further
improve the ability to predict stock prices, taking into
account market momentum and overbought or
oversold conditions (Su et al., 2022). These indicators
provide additional context beyond historical price
action and are therefore particularly useful for large-
cap energy stocks such as ExxonMobil (Atsalakis &
Valavanis, 2009).
This study was designed to overcome the
restrictions of conventional prediction models when
applied to energy sector stocks. ExxonMobil is
affected by global commodity prices, regulatory
changes and geopolitical events, which compromise
the accuracy of traditional time series models. The
purpose of this study is to refine the moving average-
based model by incorporating technical indicators
from the integrated 'stockstats' library and to evaluate
its effectiveness in ExxonMobil's stock price
forecasts.
2 DATA AND METHOD
ExxonMobil, which is one of the world's largest
publicly traded oil and petrochemical companies.
Because of its significant impact on the global energy
market and is widely influenced by economic,
geopolitical, and industry-specific factors.
ExxonMobil operates in an industry that is much
more affected by external forces such as crude oil
prices, regulatory changes and geopolitical events
than technology companies such as Amazon, which
adds to the complexity of its share price movements.
These features make ExxonMobil an ideal target for
evaluating the effectiveness of enhanced time series
forecasting models that incorporate technical
indicators. The inherent volatility of the energy
industry presents unique challenges and opportunities
for predictive models. Stocks like ExxonMobil are
directly affected by commodity price volatility,
OPEC decisions, and environmental policies, and
their share prices are sensitive to both market and
non-market impacts. Based on ExxonMobil, this
study aims to evaluate how technical indicators can
be used to improve traditional moving average
models to better capture these dynamics and provide
highly relevant insights to analysts and investors in
the energy sector.
The data for this research is sourced from Yahoo
Finance and covers the daily share price data of
ExxonMobil (ticker: XOM) from August 1, 2015 to
July 31, 2024. Key variables include date, open, high,
low, closing, adjusted close, and volume, which
shows a comprehensive view of the stock's historical
performance. To ensure the integrity and accuracy of
the data, missing or erroneous entries were cleaned up
prior to the study to make sure the integrity of the
analysis. This dataset contains more than 2,500 daily
observations over the past decade, providing a solid
foundation for building time series models under a
variety of market conditions, from stable periods to
periods of high volatility. The technical indicators
used in the 'stockstats' library include SMA, EMA,
RSI and MACD, which add depth to the analysis by
capturing market momentum and trends, which is
more in line with the purpose of this article.
Improvements of Time Series Prediction Models for ExxonMobil Based on Moving Averages
511
The predictive model used in this study combines
the traditional MA with other technical indicators of
the 'stockstats' library in Python. The prediction
model adopts an MA-based approach, enhanced by
the integration of technical indicators. The specific
steps are as follows. For data preprocessing, technical
indicators such as SMA, EMA, and Bollinger Bands
are calculated and added to the dataset for subsequent
analysis. Besides, this study will use a correlation
matrix to analyze the correlation between variables to
identify the technical indicators that are most relevant
to stock price movements. The ADF test is used to
perform a static test on the time series to determine if
the data requires further differential processing. The
variance expansion factor (VIF) is calculated to check
for multicollinearity between variables to ensure that
covariance issues are not affected during model
fitting. For model building, this study combines
technical indicators to build a forecasting model
based on moving averages, and use weighted moving
averages (WMA) and exponential smoothing (ESM)
to capture short-term and long-term trends in prices.
When training the model, the linear regression
method is used to establish the prediction relationship,
and the closing price of the preceding period and
technical indicators are used as independent variables
to predict the future closing price. For model
evaluation, R ² (coefficient of determination) and
mean square error (MSE) were used as evaluation
indicators to measure the prediction performance of
the model. The robustness of the model is further
validated using a cross-validation method to ensure
the consistency of the model across different datasets.
Through the above steps, this study aims to
develop an accurate stock price forecasting model to
capture the market dynamics of ExxonMobil stock.
The forecasting model uses a moving average-based
approach, enhanced by integrating technical
indicators. Evaluation metrics include R-squared (R²)
and mean squared error (MSE) to evaluate model
performance. The analysis starts with a correlation
matrix to determine the relevant variables, followed
by an ADF test to check for staticity.
Multicollinearity between variables was tested using
variance expansion factor (VIF).
3 RESULTS AND DISCUSSION
3.1 Correlation Analysis
For the correction of the model, the following
technical indicators were selected: 10-day MA, 20-
day EMA, 14-day RSI and MACD and its signal lines
(MACDS). These indicators were chosen because
they are sensitive to capturing market trends and
correlated momentum, which will be necessary for
stocks like ExxonMobil, which are sensitive to
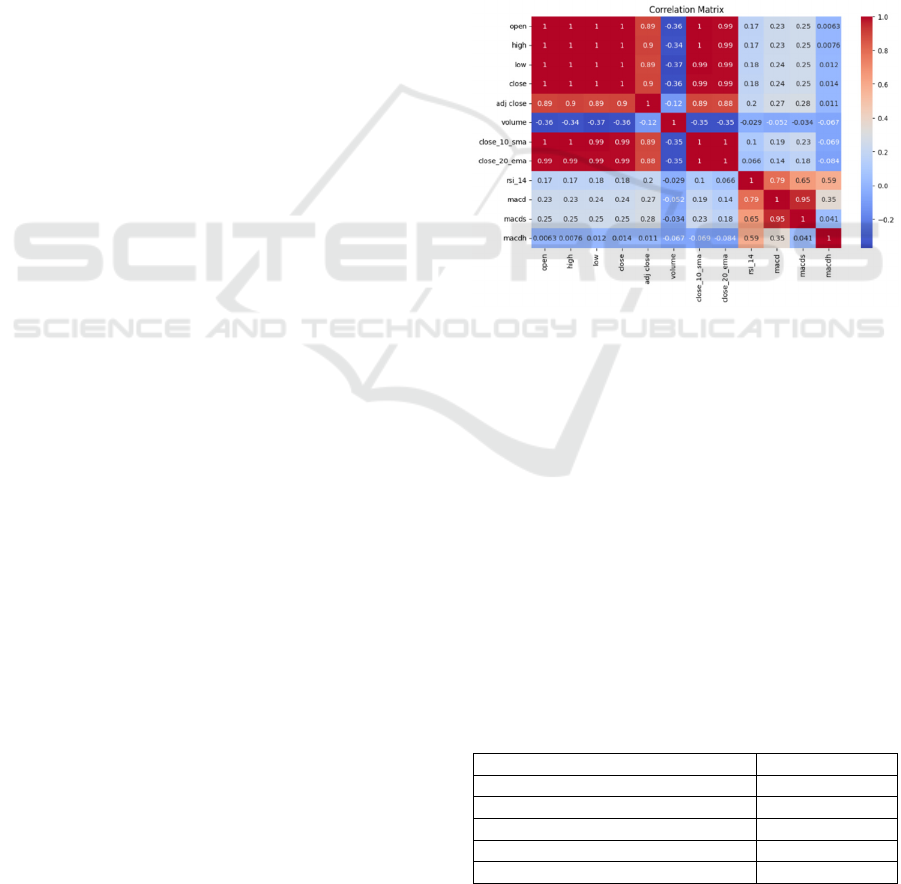
external economic factors. In this paper, a correlation
matrix is generated to study the relationship between
these variables (as depicted in Fig. 1). The results of
the analysis show that there is a strong correlation
between the SMA and EMA and the closing price,
which indicates that these indicators are effective in
capturing the trend of stocks. The MACD and RSI
also show a moderate correlation, suggesting that it’
s very useful that these indicators can be used to
recognise the overbought or oversold situations that
may signal a reversal.
Figure 1: Correlation Matrix of Technical Indicators
(Photo/Picture credit: Original).
This article also performs an ADF test on the
closing price data to check if it is static. The ADF
statistic was -1.207 and the P-value was 0.6708,
indicating non-stationarity. Since ExxonMobil has
trend and volatility as its inherent characteristics, this
outcome is to be expected. To evaluate
multicollinearity, the VIF values of the main
indicators are calculated. The calculated results show
that the VIF values of the 10-day SMA and 20-day
EMA are extremely high, suggesting that the model
has severe multicollinearity (seen from Table 1). This
suggests that while these metrics are valuable,
combining them in a model can lead to overfitting
because the information they provide overlaps.
Table 1: Variance Inflation Factor (VIF) for Key Indicators.
Metric VIF Value
10-da
y
SMA 40,556
20-da
y
EMA 40,615
RSI
(
14 da
y
s
)
4.912
MACD 5.267
MACD Signal (MACDS) 4.896
ECAI 2024 - International Conference on E-commerce and Artificial Intelligence
512
3.2 Model Performance
This prediction model was developed with a 10-day
SMA as a baseline. In this research, MSE and R²
metrics will be used to evaluate the performance of
the model. From the calculations, the MSE value of
the model is 7.0674 and the R² value is 0.8546,
indicating that the fit between the predicted stock
price and the actual stock price is very high. Higher R
² values suggest that about 85.5% of the variance in
ExxonMobil's stock price can be explained by the
model. However, when it comes to capturing price
volatility when it comes to capturing extreme market
volatility, the MSE value suggests that there is still
room for improvement.
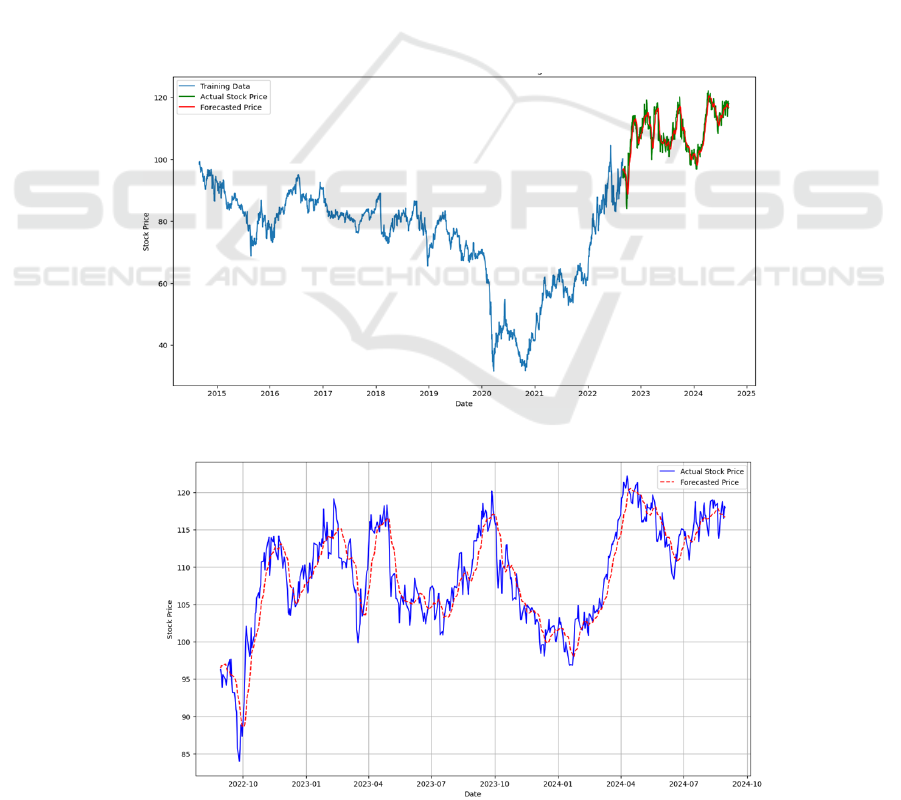
As shown in Fig. 2, during periods of market
stability, the model's predictions are closely related to
the actual stock price, suggesting that the model has
the ability to predict the overall trend. However,
during periods of high volatility, the difference
between the actual price and the predicted price
becomes more pronounced. These biases suggest that
while the model captures overall trends, it is not
adequately equipped to respond to rapid market
changes that can be influenced by external factors
such as oil price fluctuations or geopolitical events.
This visual evidence further highlights the strengths
and areas for improvement of the model, reinforcing
the importance of refining the model to better respond
to market mutations. Future improvements could
include the integration of more complex indicators or
external macroeconomic variables to improve
forecast accuracy during periods of volatility. As can
be seen from Fig. 3, the model's predictions are
closely related to the actual stock price, especially
during periods when the stock price is relatively
stable. However, during periods of high volatility, the
difference between the price predicted by the model
and the actual situation is apparent, reflecting the
challenge of accurately predicting high market
volatility.
Figure 2: ExxonMobil Stock Price Forecasting (Photo/Picture credit: Original).
Figure 3: Actual vs. Predicted Stock Prices (Photo/Picture credit: Original).
Improvements of Time Series Prediction Models for ExxonMobil Based on Moving Averages
513
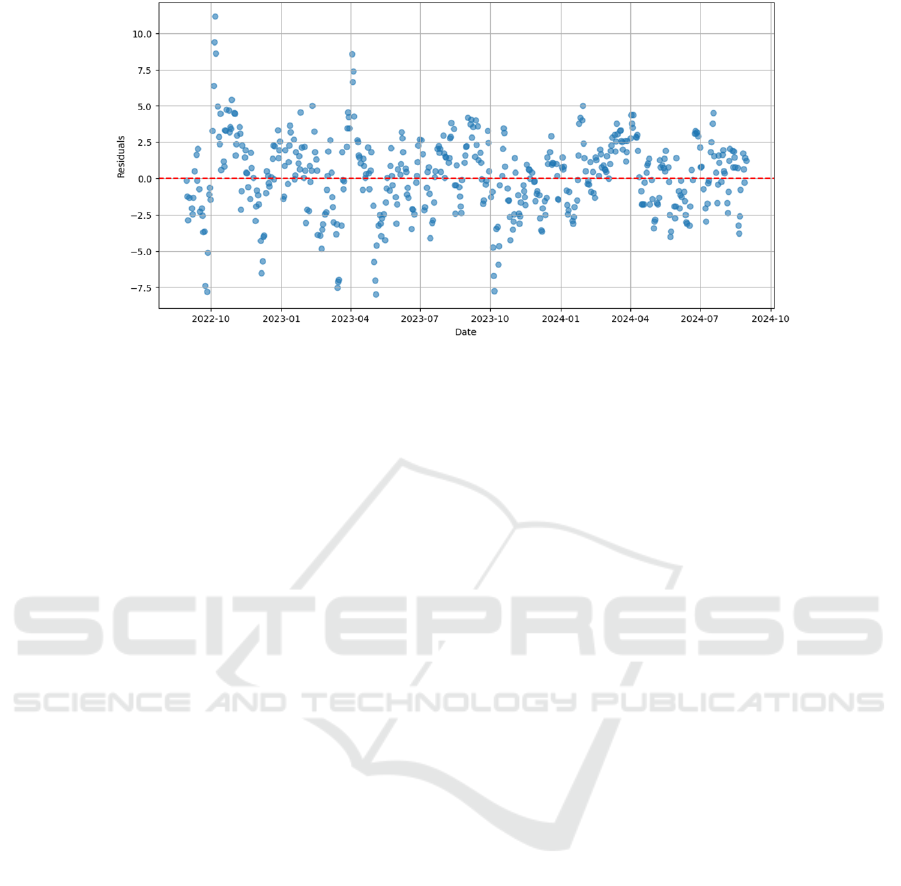
Figure 4: Residuals Plot (Cleaned Data) (Photo/Picture credit: Original).
Fig. 4 shows the residuals of the model, which
highlights the margin of error between current and
projected prices. As one can see from the results, the
residuals are concentrated around zero, but there is a
noticeable peak when there is a lot of market activity.
These spikes suggest that while the model is
performing well overall, it has limitations in adapting
to market abrupt changes influenced by external
factors.
3.3 Comparison and Implications
In this study, the developed enhanced forecasting
model was compared with the traditional moving
average model to evaluate the impact of integrating
other technical indicators such as EMA, RSI, and
MACD on the enhanced model. Traditional models
built on the likes of SMAs are often limited by their
inability to capture complex market dynamics,
especially when looking at energy sector stocks like
ExxonMobil. These stocks are heavily influenced by
external factors such as crude oil prices, geopolitical
risks, and regulatory changes. By incorporating a
wider range of metrics, the prediction accuracy of the
enhanced model is significantly improved, with an R-
square value of 0.8546 and a reduced MSE.
Compared to traditional moving averages, the
EMA indicator reacts more to market trends because
it gives more weight to recent price changes, allowing
the model to adjust more quickly based on new
information. The RSI serves as a momentum
oscillator by identifying overbought or oversold
conditions, which is essential for predicting reversals.
The MACD and its signal lines help to capture the
momentum and strength of price movements,
providing additional signals that complement the
moving averages.
These enhancements greatly improve the model's
ability to predict stock price movements under stable
market conditions. However, the performance of the
model still shows some differences during periods of
high volatility, especially when sudden external
shocks affect the market. This suggests that while the
model performs well at capturing general trends, it
still needs to be further refined to cope with the rapid
changes in the market. These findings are particularly
interesting for financial analysts and investors who
focus on the energy sector. The enhanced model
provides a more nuanced understanding of
ExxonMobil's stock price movements, which makes
it possible for the future to provide a valuable tool that
is practical in making informed investment decisions
and predicting future trends. By incorporating more
technical indicators, the model better aligns with the
unique dynamics of the energy market, allowing
analysts to identify potential trading opportunities
and manage risk more effectively.
In addition, the study highlights the importance of
adapting forecasting models to specific industries.
The volatility and sensitivity of energy markets to
external factors requires models that are able to
combine technical analysis with broader market
insights. Future studies can further improve these
models by incorporating external variables such as
crude oil prices or geopolitical risk indices, thereby
improving the accuracy and robustness of forecasts.
In conclusion, the enhanced approach demonstrated
in this study highlights the potential of technical
indicators to significantly improve traditional time
series forecasting models, providing valuable insights
for financial modelling and strategic investment in the
energy sector.
ECAI 2024 - International Conference on E-commerce and Artificial Intelligence
514

3.4 Limitations and Prospects
Although the performance of the enhanced prediction
model has been relatively improved, there are also
some noticeable limitations that require to be
accommodated in forthcoming researches. One major
limitation is that the model relies on historical stock
price data and technical indicators, which may not
fully capture the impact of unforeseen market shocks
or changes in investor sentiment. ExxonMobil's stock
belongs to the energy sector and is particularly
sensitive to external factors such as crude oil price
fluctuations, geopolitical events, regulatory changes,
and broader economic conditions. These factors can
also lead to sudden and large price fluctuations, which
are difficult to predict by technical indicators alone.
Another notable limitation is the multicollinearity
between the metrics used in the model. The VIF
analysis shows that some indicators, such as the 10-
day SMA and 20-day EMA, have extremely high
values, suggesting that the information provided by
these variables overlaps with each other and can lead
to overfitting. Multicollinearity reduces the predictive
power of the model, making it less robust when
applied to different market conditions. Solving this
problem through feature selection, dimensionality
reduction, or advanced regularization techniques can
help to enhance the stability and universality of the
model.
There are also differences in the model's
performance during periods of high market volatility,
highlighting the challenges of predicting rapid price
changes driven by external events. While the
consolidation of indicators such as the RSI and
MACD adds value by capturing momentum and trend
reversals, these enhancements are still not enough to
fully adapt to sudden changes. Incorporating external
macroeconomic variables, such as real-time oil prices,
global economic indicators, or sentiment analysis
from news sources, can further refine the model and
improve its ability to respond quickly to market
changes.
4 CONCLUSIONS
To sum up, this study aimed to improve time series
forecasting of ExxonMobil’s stock prices by
integrating moving averages with additional technical
indicators using the stockstats Python library. The
enhanced model demonstrated significant
improvements in predictive accuracy, with an R-
square value of 0.8546, highlighting its ability to
closely track actual stock prices. By incorporating
indicators like EMA, RSI, and MACD, the model
provided valuable insights into market trends and
momentum, making it a more effective tool for
financial analysts and investors. However, the study
also highlighted challenges such as multicollinearity
among indicators and the limitations of relying solely
on historical data. Future research should focus on
refining the model by incorporating additional
macroeconomic factors, employing advanced
machine learning techniques, and reducing
multicollinearity to further improve forecasting
accuracy. Overall, this research underscores the
importance of adapting time series models to the
unique characteristics of the energy sector, offering
valuable tools for financial analysis and investment
strategy development.
REFERENCES
Atsalakis, G. S., Valavanis, K. P., 2009. Forecasting stock
market short-term trends using a neuro-fuzzy based
methodology. Expert Systems with Applications, 36(7),
10696-10707.
Bao, Z., Wang, C., 2022. A multi-agent knowledge
integration process for enterprise management
innovation from the perspective of neural networks.
Information Processing & Management, 59(2), 102873.
Bustos, O., Pomares-Quimbaya, A., 2020. Stock market
movement forecast: A systematic review. Expert
Systems with Applications, 156, 113464.
Ding, G., Qin, L., 2020. Study on the prediction of stock
price based on the associated network model of LSTM.
International Journal of Machine Learning and
Cybernetics, 11(6), 1307-1317.
Fischer, T., Krauss, C., 2018. Deep learning with long
short-term memory networks for financial market
predictions. European Journal of Operational Research,
270(2), 654-669.
Guresen, E., Kayakutlu, G., Daim, T. U., 2011. Using
artificial neural network models in stock market index
prediction. Expert Systems with Applications, 38(8),
10389-10397.
Lin, G., Lin, A., Cao, J., 2021. Multidimensional KNN
algorithm based on EEMD and complexity measures in
financial time series forecasting. Expert Systems with
Applications, 168, 114443.
Su, Y., Cui, C., Qu, H., 2022. Self-Attentive Moving
Average for Time Series Prediction. Applied Sciences,
12(7), 3602.
Tsay, R. S., 2019. An introduction to time series analysis
and forecasting with applications to financial data.
Wiley Series in Probability and Statistics.
Yadav, D. K., S., Goswami, L., 2024. Autoregressive
Integrated Moving Average Model for Time Series
Analysis. 2024 International Conference on
Optimization Computing and Wireless Communication
(ICOCWC), Debre Tabor, Ethiopia, 1-6.
Improvements of Time Series Prediction Models for ExxonMobil Based on Moving Averages
515
