
Novel Portfolio Designs Based on Markowitz Portfolio Theory and
Various Assets
Robert Runze Hao
Stern School of Business, New York University, New York, U.S.A.
Keywords: Portfolio Optimization, Markowitz Theory, Mean-Variance Optimization, CAPM, Financial Economics.
Abstract: Portfolio is crucial for hedge the risks in contemporary assets management. This paper explores the
application of MPT in constructing and analysing portfolios using the top 10 U.S. companies from the Fortune
500. The study delves into the historical development and contemporary relevance of portfolio optimization,
building on foundational theories such as the CAPM (Capital Asset Pricing Model). Utilizing data sourced
from Yahoo Finance, the study applies advanced optimization techniques, including Global Minimum
Variance and Mean-Semivariance Optimization, to build the Efficient Frontier and evaluate portfolio
performance. The results indicate that the choice of optimization method significantly impacts portfolio
outcomes, with the Global Minimum Variance approach offering more stable returns, while the Mean-
Semivariance approach provides higher potential returns at the cost of increased volatility. The study's
findings underscore the significance of diversification and tailored risk management in modern investment
strategies. Nonetheless, the study recognizes constraints, including dependence on historical data and model
assumptions, suggesting avenues for future research in incorporating alternative risk measures and exploring
different economic environments. These results contribute to the field by providing both theoretical insights
and practical guidance for optimizing portfolios in today's dynamic financial markets.
1 INTRODUCTION
For the contributions to the subject of financial
economics, or finance, Harry Markowitz was
awarded the Nobel Prize. His investment framework
of Portfolio Selection, known as the MPT, made huge
impact and lays a solid foundation for extended study
on the portfolio selection (Mangram, 2013). For
example, the development of Sharpe ratio and the
CAPM in 1964, and the establishment of Fama
French Model in 1992. Contemporarily, scholars in
the field of finance continue to build on the topic of
portfolio selection. However, the theories and method
varies, portfolio selection evolves two central
measure: risk and return. MPT and all other following
theories are essentially looking for a more
sophisticated way to maximize its expected return and
minimize its risk of investment simultaneously.
(Markowitz, 1952; Markowitz, 1976)
The central theme of Economics is to find the
optimal way to allocate with limited resources given.
This idea applies to Financial Economics as well.
Portfolio Optimization, in its core, is to find an
optimal solution to allocate the limited financial
resources (usually calculated in dollar value) to
different financial assets or derivatives (stocks, bonds,
etc.) so that the portfolio produce the most yield at a
specific risk. Today, the step of finding the optimal
weights can be easily done using Python, Excel
Solver, or any other similar product. So, the key
question for modern investor is to select the assets and
derivatives that he would like to invest in.
The CAPM is a highly significant and thoroughly
examined framework in contemporary finance.
Created in 1964 by William Sharpe, the CAPM offers
a methodology for evaluating an asset's E[R] in light
of its market risk. It is based on the principles
established by MPT, which introduced diversification
to mitigate risk in an asset portfolio. The CAPM
correlates the anticipated return of an asset with its
systematic risk, denoted by the beta coefficient (β),
which quantifies the return of an asset in relation to
market returns. The fundamental principle of CAPM
asserts that investors must receive compensation in
two forms: the time value of money and risk. The Rf,
which is the return on a risk-free investment typically
linked to government bonds, is a symbol for the time
value of money. The risk element is represented by
504
Hao, R. R.
Novel Portfolio Designs Based on Markowitz Portfolio Theory and Various Assets.
DOI: 10.5220/0013269500004568
In Proceedings of the 1st International Conference on E-commerce and Artificial Intelligence (ECAI 2024), pages 504-509
ISBN: 978-989-758-726-9
Copyright © 2025 by Paper published under CC license (CC BY-NC-ND 4.0)

the risk premium, defined as the disparity between the
anticipated market return (E[Rm]) and the risk-free
rate. The CAPM formula is articulated as:
𝐸[𝑅𝑖]=𝑅𝑓 + 𝛽𝑠(𝐸[𝑅𝑚] −𝑅𝑓) (1)
Here, βs indicates the investment's beta, E[Ri] is the
expected return on investment, Rf is the risk-free rate,
and (E[Rm] - Rf) is the market risk premium. This
formula shows that an asset's expected return is
closely correlated with its systematic risk, which is
measured by beta. The CAPM holds considerable
significance for asset valuation and portfolio
administration. Initially, it establishes a standard for
evaluating investment performance. Investors can
ascertain if an asset is overvalued or undervalued by
contrasting its actual return with the expected return
forecasted by CAPM. CAPM aids in determining the
capital cost, which is essential regarding corporate
finance choices, including capital allocation and
project assessment (Fama & French, 2004).
Even with its extensive usage, CAPM has been
the focus of many debates and criticism. One of the
primary criticisms is its reliance on several
simplifying assumptions, like the presence of an asset
devoid of risk, the notion that the expectations of all
investors are the same, and that markets are perfectly
efficient. These assumptions, while useful for
creating a tractable model, are often unrealistic in
real-world settings (Black, Jensen, & Scholes, 1972).
Research studies analysing the CAPM empirically
have produced conflicting results. Research
conducted by Fama and French demonstrates that
variables beyond beta, including business size and the
book-to-market ratio, significantly influence stock
returns, hence contesting the CAPM's assertion that
beta is the exclusive predictor of projected returns
(Fama & French, 1992). The model's validity has
been scrutinized at times of market upheaval,
including the global financial crisis of 2007-2008 and
the COVID-19 pandemic. In these circumstances, the
presumption of a consistent, foreseeable correlation
between risk and return may falter, resulting in
substantial divergences from the anticipated results
forecasted by CAPM (Maji, 2012).
Despite these criticisms, CAPM remains a key
building block of modern finance theories. Its
simplicity, intuitive appeal, and foundational role in
understanding the risk-return tradeoff have ensured
its continued relevance in both academic research and
practical applications. However, it is widely
recognized that CAPM is not a universally applicable
solution, and its limitations must be considered when
applying it to real-world scenarios. As finance
continues to evolve, CAPM serves as a foundational
model upon which more complex and nuanced
models have been built, reflecting the intricate
realities of financial markets.
The motivation for this paper stems from the
critical importance of portfolio optimization in
modern finance, particularly in the context of large,
influential corporations. MPT provides a robust
structure for developing an ideal portfolio through
weighing return and risk. Given the prominence and
substantial market impact of the top 10 U.S.
companies in the Fortune 500, analysing their
performance through the lens of Markowitz's theory
offers valuable insights into risk management and
investment strategies. These companies, which
include industry leaders across sectors such as
technology, healthcare, and finance, are often seen as
bellwethers of the broader economy. Investors, both
institutional and individual, frequently look to these
companies when constructing portfolios, making it
essential to understand how to increase profits while
lowering risk in this context. By applying
Markowitz's theory, which emphasizes the
importance of diversification and the efficient frontier,
this paper seeks to investigate the optimal allocation
of investment among these top-performing firms.
Furthermore, the post-pandemic economic
landscape has introduced new variables and
uncertainties that challenge traditional investment
strategies. The top 10 Fortune 500 companies have
shown varying degrees of resilience and growth
during this period, offering a unique opportunity to
test the robustness of Markowitz's model in a
contemporary setting. By studying these companies,
this essay aims to further the current conversation
regarding the relevance and application of MPT in
today's dynamic financial environment, providing
both theoretical insights and practical guidance for
investors aiming to optimize their portfolios. This
research not only reinforces the importance of
diversification but also highlights the evolving nature
of risk in modern financial markets.
2 DATA AND METHOD
This study employs a rigorous methodological
framework rooted in Markowitz's Mean-Variance
Optimization, a central concept in MPT. The
objective is to optimize the portfolio of the top 10 U.S.
companies by minimizing risk while maximizing
expected returns. The methodology is outlined as
follows. The data comprises daily prices for the top
10 U.S. companies, sourced using the ‘yfinance’
library from Yahoo Finance, which is widely
regarded for its accuracy in providing historical
Novel Portfolio Designs Based on Markowitz Portfolio Theory and Various Assets
505
financial data. These companies, spanning sectors
such as technology, healthcare, and finance, represent
a substantial portion of the U.S. market. Adjusted
closing prices were collected to calculate daily returns,
which are critical for the portfolio optimization
process (Brown & Warner, 1985; Fama, 1970).
Expected returns were estimated using the CAPM,
which adjusts for systematic risk and provides a more
reliable estimate compared to simple historical
averages (Sharpe, 1964). The covariance matrix, a
crucial component in portfolio optimization, was
estimated using the Ledoit-Wolf shrinkage method.
This method is preferred over the traditional sample
covariance matrix due to its ability to reduce
estimation error and enhance robustness (Ledoit &
Wolf, 2004; DeMiguel, Garlappi, & Uppal, 2009).
For Global Minimum Variance (GMV) Portfolio,
it was constructed with the aim of minimizing the
total portfolio variance. This approach allows for both
long and short positions, ensuring that the portfolio
achieves the lowest possible risk (Markowitz, 1952;
Clarke et al, 2006). The study also employed mean-
semivariance optimization, which focuses on
minimizing downside risk rather than total volatility,
aligning more closely with the risk preferences of
conservative investors (Estrada, 2007). This method
identifies portfolios that minimize potential losses,
offering a more targeted approach to risk
management. The final stage of the methodology
involved constructing and analyzing The efficient
frontier denotes the collection of optimal portfolios
that provide the maximum expected return for a
specified level of risk. This was achieved under
various constraints, including sectoral and regulatory
constraints, to ensure the theoretical soundness and
practical applicability of the findings (Michaud, 1989;
Jorion, 1992).
This methodologically robust approach facilitates
a comprehensive evaluation of portfolio performance,
providing valuable insights into optimal allocation
strategies among the top 10 U.S. companies. The use
of advanced techniques, such as shrinkage estimation
and alternative risk measures, enhances the
robustness of the findings and contributes
significantly to the existing literature on portfolio
optimization.
3 RESULTS AND DISCUSSION
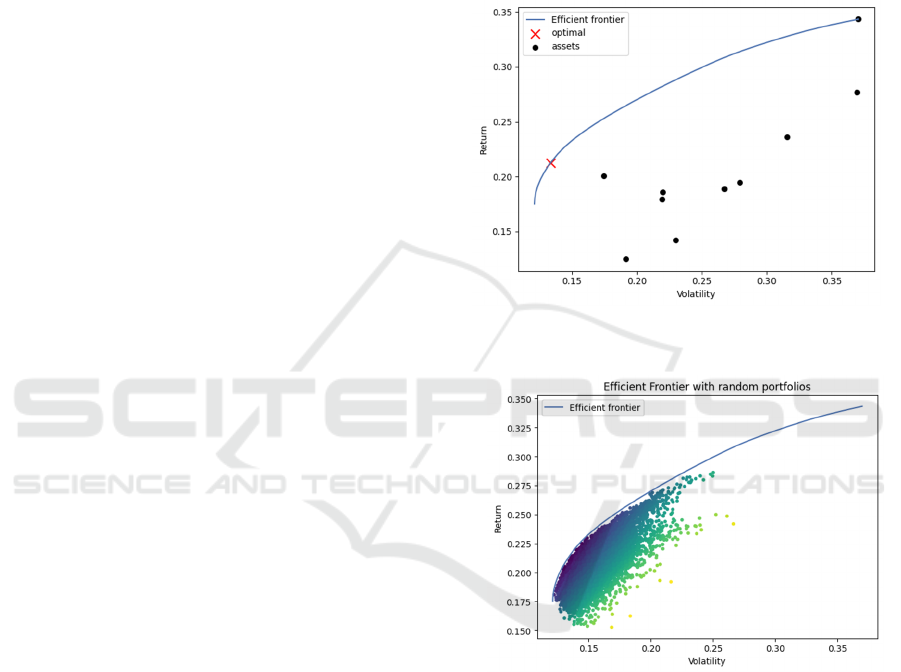
3.1 Effective Frontier
The Efficient Frontier is a core principle in MPT,
denoting the collection of optimum portfolios that
provide the maximum expected return for a specified
degree of risk. In this study, the Efficient Frontier
was constructed by applying different optimization
techniques to the top 10 U.S. companies in the
Fortune 500. The portfolios were optimized to
minimize risk while maximizing return, using data on
daily returns calculated from historical prices. The
results for optimal and random portfolios are shown
in Figure 1 and Figure 2, respectievly.
Figure 1: Efficient Frontier with Assets and Optimal
Portfolio (Photo/Picture credit: Original).
Figure 2: Efficient Frontier with Random Portfolios
(Photo/Picture credit: Original).
3.2 Model Performance
To assess the efficacy of different optimization
functions, the study employed several portfolio
optimization techniques, including Global Minimum
Variance and Mean-Semivariance Optimization.
These methods were applied to the dataset to
construct portfolios under varying risk constraints,
and their performance was subsequently analyzed.
Here is a statistical summary of the portfolio
performance under different optimization techniques.
ECAI 2024 - International Conference on E-commerce and Artificial Intelligence
506
The expected annual return of 20.0% indicates a
strong performance projection, while the annual
volatility of 9.6% reflects the portfolio's risk level.
The Sharpe ratio of 1.87 suggests that the portfolio
offers a high return per unit of risk, making it an
attractive option for risk-averse investors.
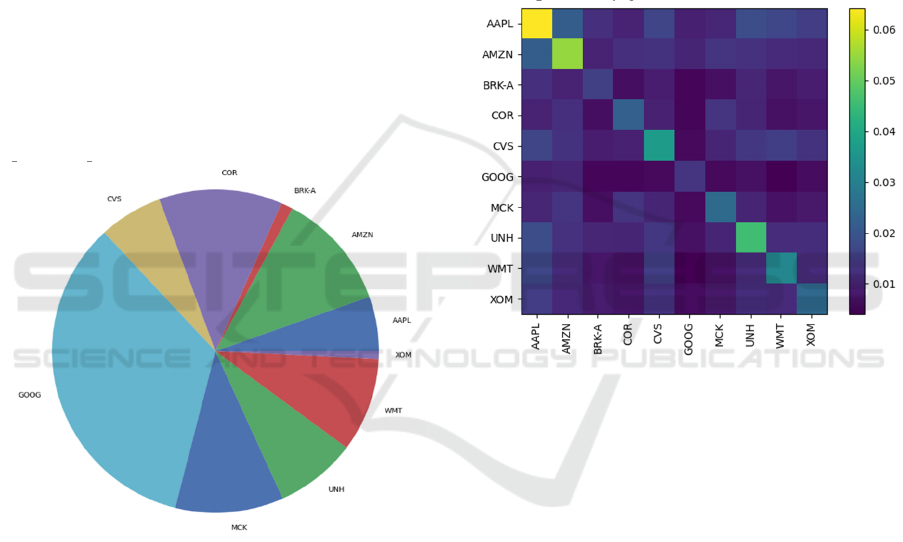
Additionally, the portfolio weights resulting from the
optimization process are visually represented in
Figure 3. Figure 3 provides a bar chart illustrating the
asset allocation across the top 10 companies. The
horizontal bars represent the proportional investment
in each company, highlighting the diversification
strategy employed in the optimization process.
Notably, companies like Google (GOOG) and
Berkshire Hathaway (BRK-A) have the largest
weights in the portfolio, reflecting their influence in
maximizing returns while maintaining an acceptable
risk level. On the other hand, companies like Amazon
(AMZN) and Apple (AAPL) have relatively smaller
weights, which may be due to their higher volatility
or lower expected returns in the context of the
optimized portfolio.
Figure 3: Portfolio Weights (Photo/Picture credit: Original).
The covariance matrix, shown in Figure 4, further
elucidates the relationships between the assets in the
portfolio. Figure 4 demonstrates the correlation
between the daily returns of each pair of companies
in the portfolio. The color intensity in the heatmap
indicates the strength of the covariance, with brighter
colors representing higher covariance values. For
example, companies such as Apple (AAPL) and
Amazon (AMZN) exhibit a relatively higher
covariance, suggesting that their returns generally
exhibit a tendency to move in the same direction.
Conversely, some pairs like CVS and XOM show
lower covariance, indicating less synchronized
movements in their returns.
Understanding these covariances is crucial for
effective portfolio optimization, as it allows for better
diversification by combining assets that do not move
together. This reduces the overall portfolio risk while
still achieving a desirable return. These results
indicate that the choice of optimization method
significantly affects portfolio performance. The high
Sharpe ratio suggests that the portfolio optimization
process effectively balances risk and return,
particularly for the Global Minimum Variance
approach, which is preferable for risk-averse
investors seeking steady returns with minimal risk. In
contrast, the Mean-Semivariance optimization is
more suited for investors willing to tolerate higher
risk for potentially greater returns.
Figure 4: Covariance Matrix(Photo/Picture credit: Original).
3.3 Explanation and Implications
The findings from the portfolio optimization
highlight the critical role of risk management in
constructing an efficient portfolio. The Efficient
Frontier clearly demonstrates that higher returns are
achievable only with higher levels of risk,
emphasizing the importance of diversification in
mitigating volatility. Investors should carefully
consider their risk tolerance when selecting portfolios,
as those positioned on the upper end of the Efficient
Frontier are more exposed to market fluctuations.
The high Sharpe ratio of 1.87 indicates that the
optimized portfolio is expected to generate returns
significantly above the risk-free rate, adjusted for
volatility. This suggests that the portfolio is well
constructed, offering substantial returns relative to its
risk level. Investors should note that such a portfolio
is particularly attractive in stable market conditions
but should be monitored closely at times of volatility
in the market.
Novel Portfolio Designs Based on Markowitz Portfolio Theory and Various Assets
507

From a practical perspective, the study provides
several investment insights. Portfolios that include a
mix of low-volatility and high-growth companies
attain a more advantageous ratio of return to risk. The
diversification is evident in the portfolio weights
illustrated in Figure 3, where investments are spread
across different sectors. The portfolio's relatively low
volatility of 9.6% suggests effective risk management,
which can lead to more consistent performance over
time, particularly in volatile markets. Investors
seeking higher returns may consider strategies that
optimize for semivariance, but they must be prepared
for the accompanying increase in portfolio volatility.
These implications reinforce the notion that portfolio
optimization is not a strategy that works for every
scenario; instead, it must be customized to the
particular risk-return profile of the investor.
3.4 Limitations and Prospects
While this study provides valuable insights into
portfolio optimization using the top 10 U.S.
companies, there are several limitations that warrant
discussion. The analysis depend upon historical price
data, which may not fully capture future market
dynamics or account for unprecedented events such
as economic crises or pandemics. In addition, the
optimization techniques used in this study are based
on certain assumptions, such as normally distributed
returns and constant covariances, which may not hold
true in all market conditions. Besides, the study
focuses on the top 10 U.S. companies, which, while
representative of the broader market, may not reflect
the performance of smaller or less prominent firms.
Future research could expand on this work by
exploring different asset classes, incorporating
alternative risk measures such as Value at Risk (VaR),
and applying these methods in different economic
environments. Additionally, examining the impact of
external factors like interest rate changes or
geopolitical events on the Efficient Frontier could
provide further insights into portfolio optimization
strategies.
4 CONCLUSIONS
To sum up, this study applied Markowitz's Mean-
Variance Optimization to construct and analyse
efficient portfolios using the top 10 U.S. companies
in the Fortune 500. The results demonstrate that
portfolio performance is highly dependent on the
choice of optimization method, with the Global
Minimum Variance approach offering more stable
returns and the Mean-Semivariance approach
providing higher potential returns at the cost of
increased volatility. The study’s limitations include
reliance on historical data and the assumptions
underlying the optimization models, which may not
fully capture real-world market complexities. Future
research should consider incorporating more diverse
data sources and risk measures to enhance the
robustness of portfolio optimization models. This
research contributes to the field by supplying a
practical framework for investors to effectively
balance return and risk, emphasizing the importance
of diversification and tailored risk management
strategies in portfolio construction.
REFERENCES
Alexander, G. J., 2013. From Markowitz to modern risk
management. Asset Management and International
Capital Markets, 5-15.
Black, F., Jensen, M. C., Scholes, M., 1972. The Capital
Asset Pricing Model: Some empirical tests. Studies in
the Theory of Capital Markets, 79-121.
Chakrabarty, N., Biswas, S., 2019. Strategic Markowitz
portfolio optimization (SMPO): a portfolio return
booster. 2019 9th Annual Information Technology,
Electromechanical Engineering and Microelectronics
Conference (IEMECON), 196-200.
Fama, E. F., French, K. R., 1992. The cross-section of
expected stock returns. The Journal of Finance, 47(2),
427-465.
Fama, E. F., French, K. R., 2004. The capital asset pricing
model: Theory and evidence. Journal of economic
perspectives, 18(3), 25-46.
Guerard Jr, J. B., 2009. Handbook of portfolio construction:
contemporary applications of Markowitz techniques.
Springer Science & Business Media.
Hali, N. A., Yuliati, A., 2020. Markowitz model investment
portfolio optimization: a review theory. International
Journal of Research in Community Services, 1(3), 14-18.
Hanif, A., Hanun, N. R., Febriansah, R. E., 2021.
Optimization of stock portfolio using the markowitz
model in the era of the COVID-19 pandemic.
International Journal of Applied Business, 5(1), 37-50.
Kamil, A. A., Fei, C. Y., Kok, L. K., 2006. Portfolio analysis
based on Markowitz model. Journal of Statistics and
Management Systems, 9(3), 519–536.
Litterman, B., 2003. Modern investment management: an
equilibrium approach. John Wiley & Sons.
Maji, S. G., 2012. The predictive power of CAPM: An
empirical analysis. Asian Journal of Finance &
Accounting, 4(1), 72-82.
Mangram, M. E., 2013. A Simplified Perspective of the
Markowitz Portfolio Theory. Global Journal of
Business Research, 7(1), 59-70.
Markowitz, H., 1952. Portfolio selection. The Journal of
Finance, 7(1), 77-91.
ECAI 2024 - International Conference on E-commerce and Artificial Intelligence
508

Markowitz, H., 1976. Markowitz revisited. Financial
Analysts Journal 32.5 (1976): 47-52.
Sharpe, W. F., 1964. Capital asset prices: A theory of
market equilibrium under conditions of risk. The
Journal of Finance, 19(3), 425-442.
Širůček, M., Křen, L., 2017. Application of Markowitz
portfolio theory by building optimal portfolio on the US
stock market. Tools and Techniques for Economic
Decision Analysis, 24-42.
Novel Portfolio Designs Based on Markowitz Portfolio Theory and Various Assets
509
