
Novel Portfolio Construction Based on ESG
Yixuan Zhang
Department of Finance, Wenzhou-Kean University, Wenzhou, China
Keywords: ESG Factors, Portfolio Optimization, Multi-Factorial Model.
Abstract: As global financial markets continue to grow increasingly complex, and as investors place greater emphasis
on sustainable development, the limitations of traditional portfolio theory are becoming more evident. With
this in mind, this study examines the impact of incorporating ESG (i.e., Environmental, Social, and
Governance) factors into traditional multi-factor models on portfolio optimization, selecting eight stocks from
different industries over the period of 2021-2024 as research subjects. By conducting an empirical analysis,
the paper assesses the performance of portfolios with ESG factors across varying risk levels and contrasts
these with portfolios based on traditional multi-factor models. According to the analysis, the inclusion of ESG
factors leads to a significant enhancement in portfolio returns at different risk levels, particularly under high-
risk conditions, where ESG factors demonstrate strong capabilities in improving risk-adjusted returns. These
results provide valuable empirical support for the integration of ESG factors into modern portfolio
optimization, offering fresh insights for the advancement of sustainable investment strategies.
1 INTRODUCTION
The development of portfolio theory has undergone
several critical stages, laying the foundation for
modern finance. In 1952, Harry Markowitz
introduced Modern Portfolio Theory (MPT), which
marked the beginning of a scientific approach to asset
management by optimizing the balance between risk
and return through diversification (Markowitz, 1952).
Following this, in 1964, William Sharpe proposed the
Capital Asset Pricing Model (CAPM), which
incorporated market risk into portfolio optimization,
further enriching asset pricing theory (Sharpe, 1964).
During the 1970s, Eugene Fama's Efficient Market
Hypothesis (EMH) promoted the growth of index
investing, allowing investors to achieve long-term
returns by holding market indices (Fama, 1970). In
the 1980s and 1990s, the derivatives market expanded
rapidly, especially with the introduction of the Black-
Scholes option pricing model, which facilitated the
inclusion of futures, options, and other tools in
portfolio construction (Black, 1973). These
traditional portfolio theories assumed market
efficiency, investor rationality, and normally
distributed asset returns, providing a fundamental
framework for asset management. However, as
financial markets became more complex and
globalized, the limitations of these traditional theories
became increasingly evident in practice. Firstly,
traditional theories assumed that asset returns follow
a normal distribution, but real market performance
often deviates from this assumption (Mandelbrot,
1863). Secondly, in modern financial markets,
investors face increasing uncertainty, especially
during extreme events such as global financial crises,
where relying solely on traditional mean-variance
models is insufficient for effectively mitigating risk
(Taleb, 2007). Consequently, both academia and
industry have increasingly recognized the need to
incorporate additional dimensions into traditional
portfolio theory to better adapt to modern market
conditions (Lo, 2004).
Currently, portfolio theory is evolving with the
introduction of emerging asset classes and
advancements in technology, gradually overcoming
the limitations of traditional theories.
Cryptocurrencies, particularly Bitcoin, have been
widely recognized for their potential to enhance
portfolio diversification due to their high volatility
and low correlation with traditional assets (Brière et
al., 2015). Research indicates that incorporating
cryptocurrencies into traditional stock and bond
portfolios can significantly improve overall
performance, particularly in terms of risk
management. Further empirical analysis suggests that
cryptocurrencies may serve as a safe-haven asset
484
Zhang, Y.
Novel Portfolio Construction Based on ESG.
DOI: 10.5220/0013269200004568
In Proceedings of the 1st International Conference on E-commerce and Artificial Intelligence (ECAI 2024), pages 484-490
ISBN: 978-989-758-726-9
Copyright © 2025 by Paper published under CC license (CC BY-NC-ND 4.0)

under certain market conditions, though their high
volatility necessitates caution in practical
applications (Corbet et al., 2018). Additionally,
private equity, hedge funds, and real estate have
increasingly become vital tools for diversifying
investment portfolios over the past few years (Anson,
2007; Stulz, 2007). These asset classes have a low
correlation with traditional stocks and bonds,
enabling them to offer more stable returns during
market fluctuations. Studies have shown that
including these alternative investments in a portfolio
often significantly reduces overall volatility while
enhancing long-term returns (Pedersen et al., 2014).
This trend further underscores the need for traditional
portfolio theory to adapt to modern market conditions
by incorporating emerging asset classes and
addressing the complexities of financial markets
(Ang, 2014). In this context, traditional quantitative
investment strategies continue to play a crucial role.
These strategies rely on a series of quantifiable
factors that can predict the future performance of
stocks. The most common factors include momentum,
value, and quality factors. With the growing global
focus on sustainable development, the application of
ESG (Environmental, Social, and Governance)
factors in investments has also been increasing. The
use of ESG factors is no longer limited to socially
responsible investing but is gradually becoming a key
consideration for mainstream investors. Research
indicates that companies with high ESG ratings tend
to perform more steadily over the long term and can
effectively reduce portfolio risk. Moreover, ESG
factors can help investors avoid potential
environmental and social risks, thereby improving
risk-adjusted returns in their portfolios. However,
despite the increasing importance of ESG factors,
their integration into traditional investment strategies
remains contentious and under-researched. In recent
years, more studies have begun to explore how ESG
factors can be combined with traditional quantitative
factors to build more comprehensive multi-factor
models. For example, research has shown that
integrating ESG factors with momentum, value, and
quality factors can significantly enhance portfolio
performance and reduce investment risk. Some
studies have also highlighted that ESG factors
perform particularly well during economic downturns,
providing investors with a certain degree of downside
protection. Nevertheless, existing research has some
limitations. Many studies focus only on single
markets or short-term performance, lacking analysis
of long-term and cross-market effects. Additionally,
there is limited research on how to prioritize ESG
factors relative to traditional factors within multi-
factor models.
The paper aims to construct an innovative
portfolio optimization framework by integrating ESG
factors with traditional Alpha factors, thereby
developing a multi-factor model. Through empirical
analysis, the paper seeks to validate the effectiveness
of this model in achieving a balance between
maximizing financial returns and minimizing risk. By
incorporating ESG factors into the traditional multi-
factor model, the paper aims to optimize stock
selection and trading strategies, creatively combining
environmental, social, and governance (ESG)
dimensions with momentum, value, and quality
Alpha factors. In terms of data processing, the paper
will utilize stock and ESG rating data, coupled with
empirical analysis, to assess the model's performance
across different market environments and to verify its
robustness in multi-asset portfolios. Ultimately, the
paper aims to provide a comprehensive investment
solution that combines financial performance with
sustainable development goals, thereby promoting
the practical application of ESG investing.
2 DATA AND METHOD
The paper selected weekly price data from the past
three years for eight stocks, analysing them to
construct an investment portfolio. The data is based
on their market performance, ESG ratings, and
various factors such as momentum, value, and quality.
The eight selected stocks demonstrate strong ESG
performance and financial stability, and include
Microsoft, Costco, Adobe, NVIDIA, Apple, Walmart,
Johnson & Johnson, and Procter & Gamble, covering
multiple industries to ensure diversity and
representativeness in the portfolio.
ESG factors have increasingly gained importance
in the investment field as key indicators for assessing
a company's sustainable development capabilities.
ESG factors are divided into three components:
environmental factors, which focus on a company’s
performance in areas such as climate change and
resource utilization; social factors, which relate to
labor rights, community impact, and other social
considerations; and governance factors, which
examine a company’s management structure and
corporate ethics. By evaluating these factors,
investors can identify companies that are stable and
low risk over the long term. The inclusion of ESG
factors not only helps enhance the sustainability of
the investment portfolio but also serves as an
effective risk management tool. Typically, ESG
Novel Portfolio Construction Based on ESG
485
ratings are categorized into high, medium, and low
tiers, allowing investors to optimize their portfolios
by selecting companies that excel across these areas.
Furthermore, integrating ESG factors into a multi-
factor investment model can help balance returns and
risks amid market fluctuations, contributing to long-
term returns.
The Alpha factor model is a financial model used
in portfolio management and stock selection. It aims
to identify specific factors (Alpha factors) that can
explain and predict asset returns, thereby achieving
excess returns beyond the market benchmark. Alpha
factors represent the performance of individual stocks
or assets that are independent of the overall market
trend, i.e., the excess returns generated by active
management. By capturing the impact of these factors,
the model provides a basis for informed investment
decisions.
The paper selected three factors: momentum,
value, and quality. The momentum factor is based on
the historical price trends of assets, typically
reflecting the continuation of upward or downward
price movements. For the momentum factor, the
cumulative return over the past 12 months was used.
The value factor measures the pricing of an asset
relative to its fundamental value, with the price-to-
earnings ratio (P/E) being chosen to identify
undervalued or overvalued stocks. The quality factor
assesses a company's financial health and operational
efficiency, with return on equity (ROE) being
selected to identify high-quality companies. Each
factor may carry different weights depending on the
period and market conditions. The traditional multi-
factor model is:
𝑅
𝛼𝛽
𝑀𝑜𝑚𝑒𝑛𝑡𝑢𝑚𝛽
𝑉𝑎𝑙𝑢𝑒
𝛽
𝑄𝑢𝑎𝑙𝑖𝑡𝑦𝜖 (1)
In the traditional multi-factor model, an ESG factor is
introduced to adjust the portfolio's weight distribution.
The inclusion of the ESG factor may influence the
final portfolio selection, particularly in the analysis of
risk-adjusted returns. The multi-factor model with the
ESG factor is:
𝑅
𝛼𝛽
𝑀𝑜𝑚𝑒𝑛𝑡𝑢𝑚𝛽
𝑉𝑎𝑙𝑢𝑒
𝛽
𝑄𝑢𝑎𝑙𝑖𝑡𝑦𝛽
𝐸𝑆𝐺 (2)
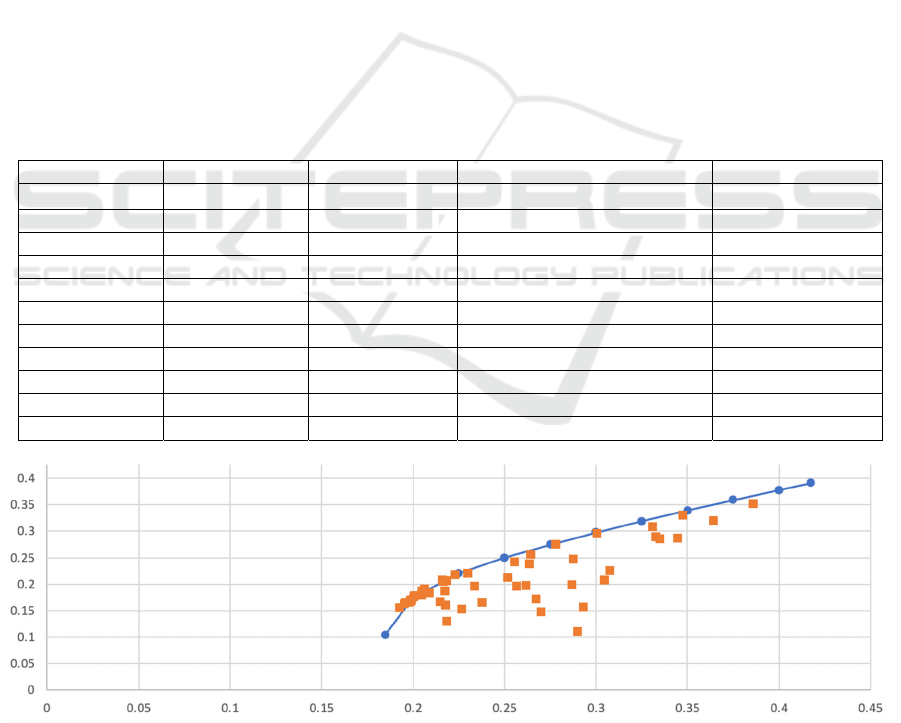
Table 1: Construction of effective frontier of traditional multi-factor model.
COST ADBE NVDA Portfolio standard deviation Portfolio return
0.8986 0.2833 -0.1819 0.1849 0.1046
0.8766 0.0614 0.0620 0.2000 0.1750
0.7564 0.0000 0.2436 0.2250 0.2202
0.6243 0.0000 0.3757 0.2500 0.2500
0.5135 0.0000 0.4865 0.2750 0.2750
0.4131 0.0000 0.5869 0.3000 0.2976
0.3191 0.0000 0.6809 0.3250 0.3188
0.2291 0.0000 0.7709 0.3500 0.3391
0.1422 0.0000 0.8578 0.3750 0.3587
0.0574 0.0000 0.9426 0.4000 0.3778
0.0000 0.0000 1.0000 0.4172 0.3908
Figure 1: The effective frontier of traditional multi-factor model (Photo/Picture credit: Original).
ECAI 2024 - International Conference on E-commerce and Artificial Intelligence
486

3 RESULTS AND DISCUSSION
3.1 Effective Frontier
After calculating the weighted average for each stock
(listed in Table 1), the paper determined the overall
scores for each stock, integrating the weights of
momentum, value, quality, and ESG factors. Based
on these scores, the top three stocks were selected to
construct the investment portfolio. Specifically, the
Figure. 1 (traditional multi-factor model) illustrates
the efficient frontier for Tesla (TSLA), Adobe
(ADBE), and Nvidia (NVDA). The efficient frontier
represents the optimal expected returns that investors
can achieve at different levels of risk. In this model,
the distribution of points is relatively tight, indicating
a stable and linear relationship between risk and
return. The risk range is mainly concentrated within a
portfolio standard deviation of 0.18 to 0.41, reflecting
a conservative level of risk. The return at low-risk
levels is relatively modest, and the increase in returns
is gradual, suggesting that in the traditional multi-
factor model, higher expected returns typically
require taking on greater risk.
The Figure. 2 shows the efficient frontier after
incorporating the ESG factor, with the portfolio
comprising Adobe (ADBE), Nvidia (NVDA), and
Apple (AAPL), where the parameters are listed in
Table 2.. Compared to the traditional model, the
inclusion of the ESG factor significantly alters the
shape and position of the efficient frontier, shifting
the curve upward and to the left. This shift indicates
that investors can achieve higher expected returns at
the same level of risk. The range of points is broader,
particularly in the high-risk area, suggesting that the
ESG factor enables the model to better accommodate
diversified risk/return combinations. Compared to the
traditional model, the risk range under the ESG model
expands, with the standard deviation ranging from
0.2489 to 2.5, showing that this portfolio can tolerate
higher risk levels while also delivering substantially
higher returns. For example, at a standard deviation
of 0.35, the return can reach 0.6454, indicating that
high returns can still be achieved even at lower risk
levels. The maximum portfolio return increases
significantly from approximately 0.3907 in the
traditional model to 14.0475, with a corresponding
portfolio standard deviation also rising to 2.5,
indicating that investors can obtain greater returns
while accepting higher risks.
Table 2: Effective frontier construction of models incorporating ESG factors.
ADBE NVDA AAPL Portfolio standard deviation Portfolio return
0.8517 0.2194 -0.0710 0.2489 -0.8316
0.9972 0.0006 0.0023 0.3000 0.1280
0.8347 0.1287 0.0366 0.3500 0.6454
0.8295 0.1046 0.0659 0.4000 1.0481
0.8249 0.0821 0.0929 0.4500 1.4190
0.8203 0.0610 0.1186 0.5000 1.7717
0.8168 0.0397 0.1435 0.5500 2.1128
0.8148 0.0174 0.1678 0.6000 2.4459
0.7853 0.0000 0.2147 0.7000 3.0960
0.7398 0.0000 0.2602 0.8000 3.7315
0.6950 0.0000 0.3050 0.9000 4.3577
0.6506 0.0000 0.3494 1.0000 4.9776
0.6066 0.0000 0.3934 1.1000 5.5930
0.5628 0.0000 0.4372 1.2000 6.2051
0.5191 0.0000 0.4809 1.3000 6.8148
0.4756 0.0000 0.5244 1.4000 7.4225
0.4323 0.0000 0.5677 1.5000 8.0287
0.3890 0.0000 0.6110 1.6000 8.6337
0.3457 0.0000 0.6543 1.7000 9.2376
0.3026 0.0000 0.6974 1.8000 9.8407
0.2594 0.0000 0.7406 1.9000 10.4431
0.2164 0.0000 0.7836 2.0000 11.0449
0.1303 0.0000 0.8697 2.2000 12.2471
0.0015 0.0000 0.9985 2.5000 14.0475
Novel Portfolio Construction Based on ESG
487
Figure 2: Effective frontier of model incorporating ESG factors (Photo/Picture credit: Original).
Table 3: Optimal risk combination of traditional multi-factor model.
COST ADBE NVDA
0.57154927 0 0.42845073
Rf Portfolio Rf+Portfolio standard deviation Rf+Portfolio return
-1 2 0.52302755 0.51398898
-0.9 1.9 0.49687617 0.48877611
-0.8 1.8 0.4707248 0.46356325
-0.7 1.7 0.44457342 0.43835038
-0.6 1.6 0.41842204 0.41313752
-0.5 1.5 0.39227066 0.38792465
-0.4 1.4 0.36611929 0.36271178
-0.3 1.3 0.33996791 0.33749892
-0.2 1.2 0.31381653 0.31228605
-0.1 1.1 0.28766515 0.28707318
0 1 0.26151378 0.26186032
0.1 0.9 0.2353624 0.23664745
0.2 0.8 0.20921102 0.21143459
0.3 0.7 0.18305964 0.18622172
0.4 0.6 0.15690827 0.16100885
0.5 0.5 0.13075689 0.13579599
0.6 0.4 0.10460551 0.11058312
0.7 0.3 0.07845413 0.08537025
0.8 0.2 0.05230276 0.06015739
0.9 0.1 0.02615138 0.03494452
1 0 0 0.00973166
3.2 Model Performance
In the first set of results, one can clearly observe the
performance of the investment portfolio under
different optimization functions. The efficient
frontier demonstrates the optimal returns achievable
at various levels of risk. For instance, in the minimum
variance portfolio, the allocation tends to reduce
exposure to highly volatile stocks (such as NVDA) to
lower overall risk. This strategy effectively controls
the portfolio’s volatility, providing relatively stable
returns. In the maximum Sharpe ratio portfolio, more
weight is allocated to higher-returning stocks (such as
COST and NVDA) to maximize risk-adjusted returns.
This allocation strategy aims to enhance overall
portfolio returns, albeit potentially with higher
volatility. The optimal investment portfolio under the
traditional model exhibits lower standard deviation
and relatively stable returns, with the highest Sharpe
ratio recorded at 1.001325, indicating that the
portfolio can achieve solid performance under strict
risk control. Additionally, this suggests that the
traditional factor model is already capable of
balancing returns and risks to some extent, though its
potential for improvement is limited. The results are
listed in Table 3.
ECAI 2024 - International Conference on E-commerce and Artificial Intelligence
488

Compared to the traditional model, the efficient
frontier curve after incorporating the ESG factor is
steeper, indicating that as investors are willing to take
on more risk, the rate of return increases more
significantly. The ESG-enhanced model
demonstrates stronger risk tolerance, allowing for
optimized investment returns across a broader range
of risk levels. Although the risk level increases, the
portfolio’s returns also rise considerably, reflecting
the effectiveness of the ESG factor in portfolio
optimization. Notably, the Sharpe ratio significantly
improves after the inclusion of the ESG factor,
reaching a maximum of 5.619526. This substantial
increase indicates that the ESG factor not only
enhances portfolio returns but also significantly
optimizes risk-adjusted returns, allowing investors to
achieve markedly higher returns at the same level of
risk. Furthermore, the optimal investment portfolio
under the ESG model performs exceptionally well
under high-risk conditions, particularly when the risk-
free rate is set at 1.0, with a return of 14.06808, far
surpassing the performance under the traditional
model. This demonstrates that the ESG factor not
only boosts the return potential of the portfolio but
also offers more attractive returns under high-risk
conditions, proving its critical role in long-term
investment strategies. The results are shown in Table
4.
3.3 Explanation and Implications
When comparing the traditional multi-factor
model with the model incorporating ESG factors, it is
evident that the inclusion of ESG factors significantly
enhances portfolio performance, particularly under
high-risk conditions. The steeper efficient frontier
observed after adding ESG factors indicates that as
risk increases, the rate of return improves more
markedly, highlighting the crucial role of ESG factors
in boosting portfolio return potential. Additionally,
the ESG factors significantly increase the portfolio's
Sharpe ratio, demonstrating a substantial contribution
to risk-adjusted returns. These results suggest that
Table 4: Optimal risk mix of models with ESG factors.
ADBE NVDA AAPL
0 0 1
Rf Portfolio Rf+Portfolio standard deviation Rf+Portfolio return
-1 2 5.006857804 28.12643346
-0.9 1.9 4.756514914 26.72059837
-0.8 1.8 4.506172024 25.31476328
-0.7 1.7 4.255829133 23.90892819
-0.6 1.6 4.005486243 22.5030931
-0.5 1.5 3.755143353 21.09725801
-0.4 1.4 3.504800463 19.69142292
-0.3 1.3 3.254457573 18.28558783
-0.2 1.2 3.004114682 16.87975274
-0.1 1.1 2.753771792 15.47391765
0 1 2.503428902 14.06808256
0.1 0.9 2.253086012 12.66224747
0.2 0.8 2.002743122 11.25641238
0.3 0.7 1.752400231 9.850577288
0.4 0.6 1.502057341 8.444742197
0.5 0.5 1.251714451 7.038907107
0.6 0.4 1.001371561 5.633072017
0.7 0.3 0.751028671 4.227236926
0.8 0.2 0.50068578 2.821401836
0.9 0.1 0.25034289 1.415566746
1 0 0 0.009731655
Novel Portfolio Construction Based on ESG
489

integrating ESG factors into long-term investment
strategies can not only optimize risk management but
also lead to more substantial returns. Even if the
selected stocks are similar or the same, the inclusion
of ESG factors may improve risk-adjusted returns,
offering valuable insights for adjusting future
investment strategies. This analysis can assist
investors in developing more robust and sustainable
investment portfolios in the modern market
environment. Furthermore, ESG factors provide
greater portfolio diversification, enabling investors to
adapt strategies flexibly in various market conditions,
further enhancing the stability and sustainability of
investments.
3.4 Limitations and Prospects
Despite the significant improvement in portfolio
performance achieved through the incorporation of
ESG factors, this paper has some limitations. Firstly,
the time span of the data sample is limited and does
not cover longer market cycles, which may affect the
generalizability of the results. Secondly, the
assignment of weights to ESG factors is somewhat
subjective, and the paper does not deeply explore the
impact of different weight configurations on portfolio
performance. Additionally, this research focuses on a
small number of stocks, which limits the applicability
of the findings across different markets and industries.
Future research should consider expanding the
sample to include a broader range of market cycles
and asset classes, while also employing more
dynamic weight adjustment mechanisms to enhance
the reliability and applicability of the results.
Furthermore, exploring the integration of ESG factors
with other emerging factors, such as big data and
artificial intelligence, could provide additional
perspectives and innovative opportunities for
portfolio optimization.
4 CONCLUSIONS
To sum up, this study significantly advances the
traditional multi-factor model by integrating ESG
factors, thereby developing a more forward-looking
and adaptable framework for portfolio optimization.
The research findings indicate that the inclusion of
ESG factors not only boosts portfolio returns across
various risk levels but also exhibits particularly strong
performance under high-risk conditions, showcasing
substantial risk-adjusted return capabilities.
Moreover, the paper highlights that the integration of
ESG factors effectively enhances the portfolio's
Sharpe ratio, further optimizing the overall
investment performance. Despite these promising
results, the research is constrained by a limited time
span and a small sample of stocks, which may affect
the broader applicability of the findings. Future
research could address these limitations by expanding
the sample size, utilizing dynamic factor weight
adjustments, and incorporating other emerging
factors to improve the generalizability and robustness
of the results. Overall, this paper provides critical
empirical support for incorporating ESG factors into
modern portfolio optimization strategies,
contributing to the advancement of sustainable
investment practices.
REFERENCES
Ang, A. 2014. Asset Management: A Systematic approach
to factor investing. OUP Catalogue.
Anson, M., 2007. Performance Measurement in Private
Equity: Another Look. The Journal of Private Equity,
103, 7–21.
Black, F., Scholes, M., 1973. The Pricing of Options and
Corporate Liabilities. Journal of Political Economy,
813, 637–654.
Brière, M., Oosterlinck, K., Szafarz, A., 2015. Virtual
currency, tangible return: Portfolio diversification with
bitcoin. Journal of Asset Management, 166, 365–373.
Corbet, S., Meegan, A., Larkin, C., Lucey, B., Yarovaya, L.,
2018. Exploring the dynamic relationships between
cryptocurrencies and other financial assets. Economics
Letters, 165, 28–34.
Fama, E. F., 1970. Efficient Capital Markets: A Review of
Theory and Empirical Work. The Journal of Finance,
252, 383–417.
Lo, A. W. 2004., The Adaptive Markets hypothesis. The
Journal of Portfolio Management, 305, 15–29.
Mandelbrot, B., 1963. The Variation of Certain Speculative
Prices. The Journal of Business, 364, 394–419.
Markowitz, H., 1952. Portfolio Selection. The Journal of
Finance, 71, 77–91.
Pedersen, N., Page, S., He, F., 2014. Asset Allocation: Risk
Models for Alternative Investments. Financial Analysts
Journal, 703, 34–45.
Sharpe, W. F., 1964. Capital Asset Prices: A Theory of
Market Equilibrium under Conditions of Risk. The
Journal of Finance, 193, 425–442.
Stulz, R. M., 2007. Hedge Funds: Past, Present, and Future.
The Journal of Economic Perspectives, 212, 175–194.
Taleb, N. N., 2007. Black Swans and the Domains of
Statistics. The American Statistician, 613, 198–200.
ECAI 2024 - International Conference on E-commerce and Artificial Intelligence
490
