
Analysis of the Prediction and Influencing Mechanism for Bitcoin
Price
Minglei Lyu
Department of Applied Economics, Beijing Normal University-Hong Kong
Baptist University United International College, Zhuhai, China
Keywords: Cryptocurrency, Blockchain, Bitcoin Price.
Abstract: As a matter of fact, with the rapid development of information technology, cryptocurrency has become a
common tool for investment. Under the dramatically fluctuations markets globally, the cryptocurrency prices
have been changed with a huge volatility. Among which, Bitcoin is the currency with the largest assets, also
fluctuate significantly. With this in mind, this study will evaluate and estimate the influencing factors for
Bitcoin prices. To be specific, the hedge and support mechanism for price of Bitcoin will be discussed and
evaluated. In the meantime, the Autoregressive Integrated Moving Average (ARIMA) model is adopted in
order to show the price trend prediction. In addition, the correlation analysis is adopted in order to find the
intrinsic connections between other issues and cases. At the same time, the limitations and prospects will be
demonstrated as well according to the analysis. Overall, these results shed light on guiding further exploration
of Bitcoin pricing as well as provide a guideline for analysis of the inherit price for Bitcoin.
1 INTRODUCTION
Cryptocurrency, including Bitcoin, is constructed
based on the blockchain system, and the blockchain
system has also evolved since its inception, now
serving as the foundation of various decentralized
applications beyond cryptocurrency. Blockchain is a
distributed and decentralized ledger technology (DLT)
to record and memorize the transactions across
networks, in a transparent, secure, and immutable
way. Every block inside the blockchain system
contain a series of transactions, these blocks are
cryptographically linked, ensuring its data integrity.
This contributes to the protection of information
transactions' confidentiality and integrity, which form
the basis of the Blockchain system. Because
blockchain systems are inherently decentralized,
there is no longer a need for middlemen, which
lowers costs and improves transaction efficiency and
speed (Wang et al., 2019).
Blockchain's progress has improved its adaptability to
smart contract applications in recent years, this
ensures the possibility of decentralized autonomous
organizations (DAOs), which function without
centralized control (Buterin, 2014). This
development highlights blockchain's potential in trust
less settings, where codes take the role of
conventional centralized organizations (Swan, 2015).
A sketch is shown in Figure. 1 (Santander, 2015).
Blockchain is therefore developing into the essential
infrastructure for the digital economy, driving
innovation in fields that demand efficiency, safety,
and transparency (Yermack, 2017). This accelerates
the application of blockchain technologies.
Figure 1: Blockchain Operation Process (Santander, 2015).
Web3 is the next generation of the internet,
transitioning from centralized control to a
decentralized and user-centric model. In this system,
the users can control their digital identities, assets and
data facilitated by decentralized applications (dApps).
The fundamental principles of Web3 include
decentralization, privacy, and interoperability, which
476
Lyu, M.
Analysis of the Prediction and Influencing Mechanism for Bitcoin Price.
DOI: 10.5220/0013269000004568
In Proceedings of the 1st International Conference on E-commerce and Artificial Intelligence (ECAI 2024), pages 476-483
ISBN: 978-989-758-726-9
Copyright © 2025 by Paper published under CC license (CC BY-NC-ND 4.0)

is highly connected to the spirit of blockchain. Web3
is the future shape of internet, breaking the monopoly
of information and resources, fostering, and
promoting a more inclusive and equitable internet
where the users are the core of this system.
Bitcoin operates on blockchain, consensus
mechanisms such as Proof of Work (PoW) or Proof
of Stake (PoS) are utilized to validate transactions.
PoW, particularly, is important to Bitcoin’s operation,
as it requires miners to solve mathematical puzzles to
validate transactions, known as mining for this
process. The miners compete to solve the puzzles and
the first to do so will be rewarded newly minted
Bitcoin. This process requires energy especially
electricity, so the costs of mining may fluctuate
significantly. The fluctuations in mining costs could
be affected by energy cost and technology
advancement, the overall changes directly impact the
prices of Bitcoins. So, knowing exactly how mining
costs evolve is crucial for analysing Bitcoin's cost-
support price.
This study is based on the existing research, using
the Bitcoin mining output model to forecast the future
mining cost and its impacts for Bitcoin’s pricing. The
halving event of Bitcoin mining output in 2024 is a
pivotal moment in the cryptocurrency’s economic
cycle. The Block Reward for miners will be reduced
from 6.25 per block to 3.125 per block. Historically,
each halving event can cause significant increase in
Bitcoin’s price, driven by the reduction in supply and
increase in demand (Narayanan et al., 2016). For
instance, in 2012, the first halving caused a price
increase of 8000% in a span of 12 months, while the
second and third halving led to price increases of
2900% and 600%, respectively. These trends
demonstrated the robust relationship between Bitcoin
price increases and halving, which gave this study
considerable inspiration. By examining the potential
changes in mining output and costs, this study aims to
make contribution to the existing literature on
Bitcoin’s economic model. In addition, this study
similarly seeks to explore the correlation between
Bitcoin and traditional assets such as stocks and gold,
and thus explore the broader implications of these
changes to provide more informed recommendations
for diversification and asset allocation in conjunction
with changes in the cost of Bitcoin.
The framework for this study will involve two key
analytical approaches. First, an Autoregressive
Integrated Moving Average (ARIMA) time series
model is employed to predict future bitcoin mining
output, considering factors such as network difficulty
and hash rates. The model is well suited to capturing
the temporal dynamics of bitcoin mining and provides
a solid basis for predicting future changes in output.
Second, Spearman rank correlation coefficients will
be used to assess the relationship between Bitcoin and
traditional assets, providing more insight into how
Bitcoin's price movements align or deviate from more
mature markets. By integrating these methods and
validating the data, this study aims to
comprehensively analyse the future status and role of
Bitcoin, especially in the context of 2024 halving
event.
2 DATA AND METHOD
This part illustrates all the models used in this paper,
including Bitcoin mining output model; ARIMA
model and Spearman's rank correlation coefficient.
Previous scholars have developed a model of Bitcoin
mining output, his research established a model of
Bitcoin mining output (Hayes, 2015). By measuring
the relationship between various factors and time that
affect Bitcoin mining output, a more accurate cost-
support price could be predicted:
𝐵𝑇𝐶 𝑚𝑖𝑛𝑖𝑛𝑔 𝑜𝑢𝑡𝑝𝑢𝑡 / 𝐷𝑎𝑦 = 𝜃(
) (1)
Here, β is the block reward in BTC/block; δ is the
mining difficulty in GH/block; ρ is the hash rate used
by miners in TH/s and θ is a constant used to convert
hash arithmetic to expected daily bitcoin production.
This model takes Block reward, mining difficulty
and hash rates as the factors of Bitcoin mining
production, these factors serve as vital tools for
understanding the dynamic nature of Bitcoin mining,
especially in a volatile market environment. In the
following calculation process, this study will use this
model to estimate the daily output of Bitcoin mining,
then calculate and fit the future change in mining
support costs with the Bitcoin halving cycle. The
ARIMA model, is a commonly used in time featured
analysis. Its general form can be expressed as:
𝑌
= 𝑐 + 𝜑
𝑌
+ 𝜑
𝑌
+ ⋯ + 𝜑
𝑌
+
𝜃
𝜖
+ 𝜃
𝜖
+ ⋯ + 𝜃
𝜖
+ 𝜖
(2)
This research uses an ARIMA model to analyze
datasets on Bitcoin mining costs. The model is used
to understand historical trends and make predictions
about future mining costs. The model using process
involves:
Selecting a simplified ARIMA model based on
data characteristics and preprocessing results
Determining model parameters through analysis
of ACF and PACF
Estimating parameters using maximum
likelihood and confirming significance through
statistical tests
Analysis of the Prediction and Influencing Mechanism for Bitcoin Price
477
Assessing model fit using AIC and BIC criteria
Verifying residual white noise properties with
the Ljung-Box Q test
Generating forecasts for future Bitcoin mining
output
The Spearman's rank correlation coefficient,
denoted by the Greek letter ρ, is a non-parametric
measure used to assess the strength and direction of
association between two ranked variables. The
formula can be expressed as:
𝜌
=1−
(
)
(3)
Spearman's correlation is chosen for its ability to
capture monotonic relationships without assuming
linearity. So, this research utilizes Spearman's rank
correlation coefficient to assess the relationship
between Bitcoin and traditional assets (NASDAQ and
Gold). This analysis is conducted over the entire
study period and examine how correlations evolve
over time.
This study collected two distinct datasets to
investigate Bitcoin mining costs changes through
time and the relationship between Bitcoin prices with
traditional assets like gold and stocks. The quarterly
data from January 2016 to July 2024 are collected,
containing 35 datasets spanning 8 years. For each
quarterly data, there is less variation in internal
changes, so one collects data every three months to
ensure the continuity and reliability of the relevant
data. The datasets include the following variables
including block reward; Hash Rate (TH/S); Mining
Difficulty (GH/S); Bitcoin price ($); Actual Mining
cost of Bitcoin ($); Actual Total Cost; Estimated
Mining Cost; Ratio (Mining cost/Price) and Error
Ratio (Estimated/Real Cost). Data sources include
coinwards.com for hash rate, mining difficulty and
block reward, Binance.com for Bitcoin price, and
macromicro.com for actual mining cost of Bitcoin
and the actual mining output of Bitcoin. This dataset
will be used to examine the model of (Hayes, 2015),
and then to predict the Bitcoin mining cost in the
future, trying to provide supportive data for Bitcoin
price analysis.
To analyze the relationship between Bitcoin and
traditional assets, one collected weekly data from
January 2015 to July 2014, encompassing Bitcoin
Price ($); NASDAQ Composite Index and Gold Spot
Price ($/oz). The data was sourced from
Yahoofinance.com for Bitcoin/USD prices and
NASDAQ Composite Index and World Gold Council
for Gold prices. These datasets comprise
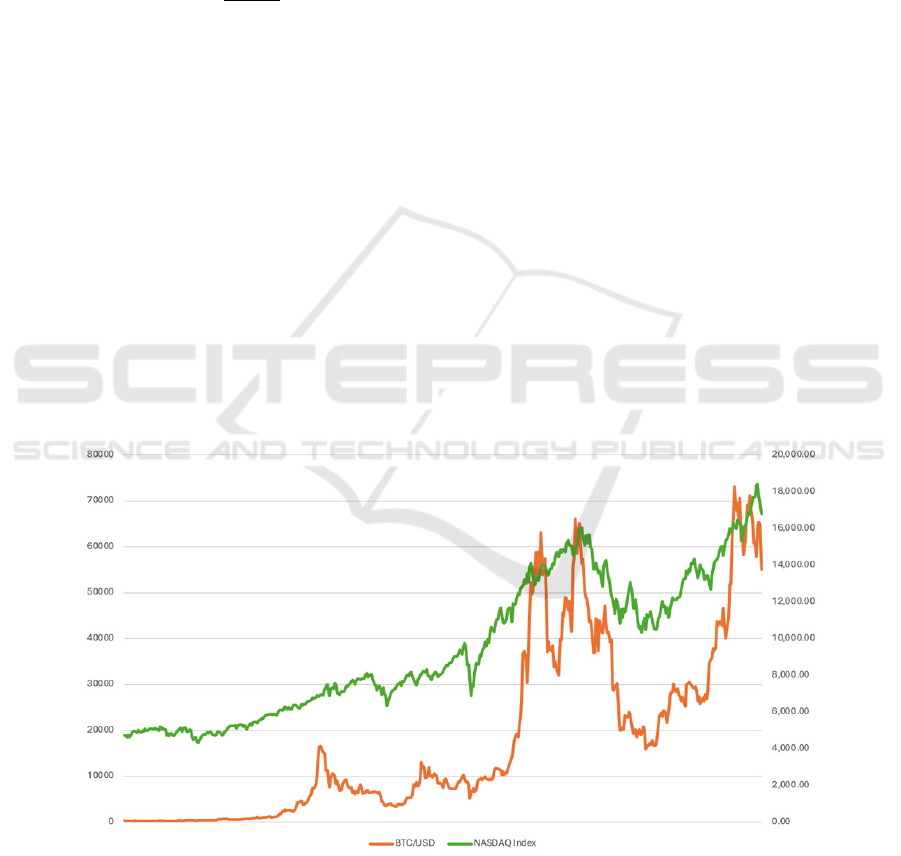
approximately 500 weekly observations. Figure. 2
and Figure. 3 show the normalized weekly price
trends of Bitcoin, NASDAQ, and Gold, sourced from
Tradingview.com. These datasets will be used for
Spearman correlation analysis to find the relationship
of Bitcoin and traditional assets and trying to find
opportunities for Bitcoin to hedge and to inform asset
allocation recommendations.
Figure 2: BTC & NASDAQ (Photo/Picture credit: Original).
ECAI 2024 - International Conference on E-commerce and Artificial Intelligence
478
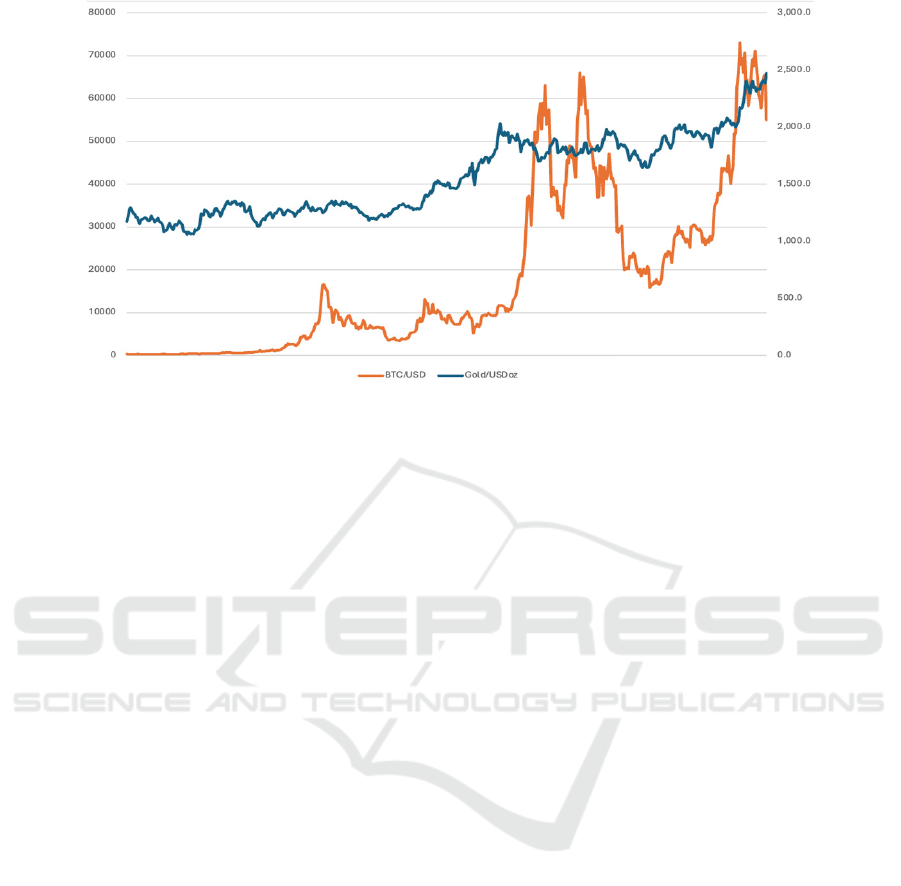
Figure 3: BTC&GOLD (Photo/Picture credit: Original).
3 RESULTS AND DISCUSSION
3.1 ARIMA MODEL
This part will present the results of the ARIMA model
applied to the quarterly Bitcoin mining output data
collected from January 2016 to July 2024. Then
examine and compare it with the real mining cost and
output. Using the estimated mining output and real
total mining cost, one could get the estimated mining
cost of each Bitcoin. Then, this study will divide the
estimated mining cost by real mining cost to get the
error ratio, which could test the accuracy of the
prediction of the model.
In this research, an ARIMA (0,1,1) model was
selected on the data characteristics, which shows a
noticeable trend without a clear seasonal pattern.
When determining the values of p and q, one analyzed
the ACF and PACF plots of the post differential data.
The ACF plots showed a rapid decay after lagging by
order 1, while the PACF plots did not show a clear
truncated tail pattern. These features suggest that the
MA (1) term may be suitable for the data without the
AR term. Therefore, one chose the ARIMA (0,1,1)
model, and preprocessing results with the following
specific formula:
𝑌
= −53.822 − 0.411𝜖
(4)
The ARIMA model parameters were determined
through the analysis of the ACF and PACF. Model
selection was based on minimizing the AIC and BIC.
These parameters were obtained by maximum
likelihood estimation and their significance was
confirmed by statistical tests. The specific
significance test results are as shown in Table 1.
One used a significance level of 0.05. The p-value
of 0.047 for the constant term is just below the 0.05
level of significance, which suggests that this
parameter may have some importance in the model,
but its effect may not be as significant as that of the
MA parameter. The p-value of 0.013 for the MA
parameter is significantly lower than 0.05, which
suggests that this parameter plays an vital role in the
model. The goodness of fit of the model was assessed
by AIC and BIC with the following values: Akaike
Information Criterion (AIC): 471.355 and Bayesian
Information Criterion (BIC): 475.934. The AIC and
BIC values were minimized, further supporting the
model’s adequacy.
The model Q statistic data, namely the Ljung-Box
Q test statistic, is displayed in Table 2 together with
the p-value and statistic value. The Q statistic test for
white noise may be used to verify if the model
residuals are white noise, the original hypothesis is:
the residuals are white noise). Q6 will be used to test
the residuals of the first 6 orders to meet the white
noise, commonly, the p-value is greater than 0.1
means it meets the white noise test. Usually, only Q6
need to be examined. The p-value of Q6 is larger than
0.1, so the original hypothesis cannot be rejected, at
the significance level of 0.1, so these residuals are
white noise, the model could meet the requirements.
Then, using the fitted ARIMA (0,1,1) model,
forecasts for Bitcoin mining output were generated
for the period from Q3 2024 to Q1 2026, the forecasts
indicate a continuous decreasing trend in mining
output. The results are shown in Figure. 4 and Figure.
5.
Analysis of the Prediction and Influencing Mechanism for Bitcoin Price
479

Table 1: ARIMA prediction results.
ARIMA (0,1,1) Model Parameter List
Term Symbol Coefficient Standard Error z-value p-value 95% CI
Constant
Term
c -53.822 27.112 -1.985 0.047
-
106.960 ~ -
0.684
MA
parameters
β
1
-0.411 0.165 -2.489 0.013
-0.734 ~
-0.087
AIC value = 471.355
BIC value = 475.934
Table 2: Q statistical Table.
Item Statistic p-value
Q6 0.561 0.454
Q12 0.735 0.693
Q18 0.740 0.864
Q24 2.922 0.571
Figure 4: Bitcoin Mining Output Forecast (Photo/Picture credit: Original).
Figure 5: Error Ratio Normal Distribution (Photo/Picture credit: Original).
ECAI 2024 - International Conference on E-commerce and Artificial Intelligence
480
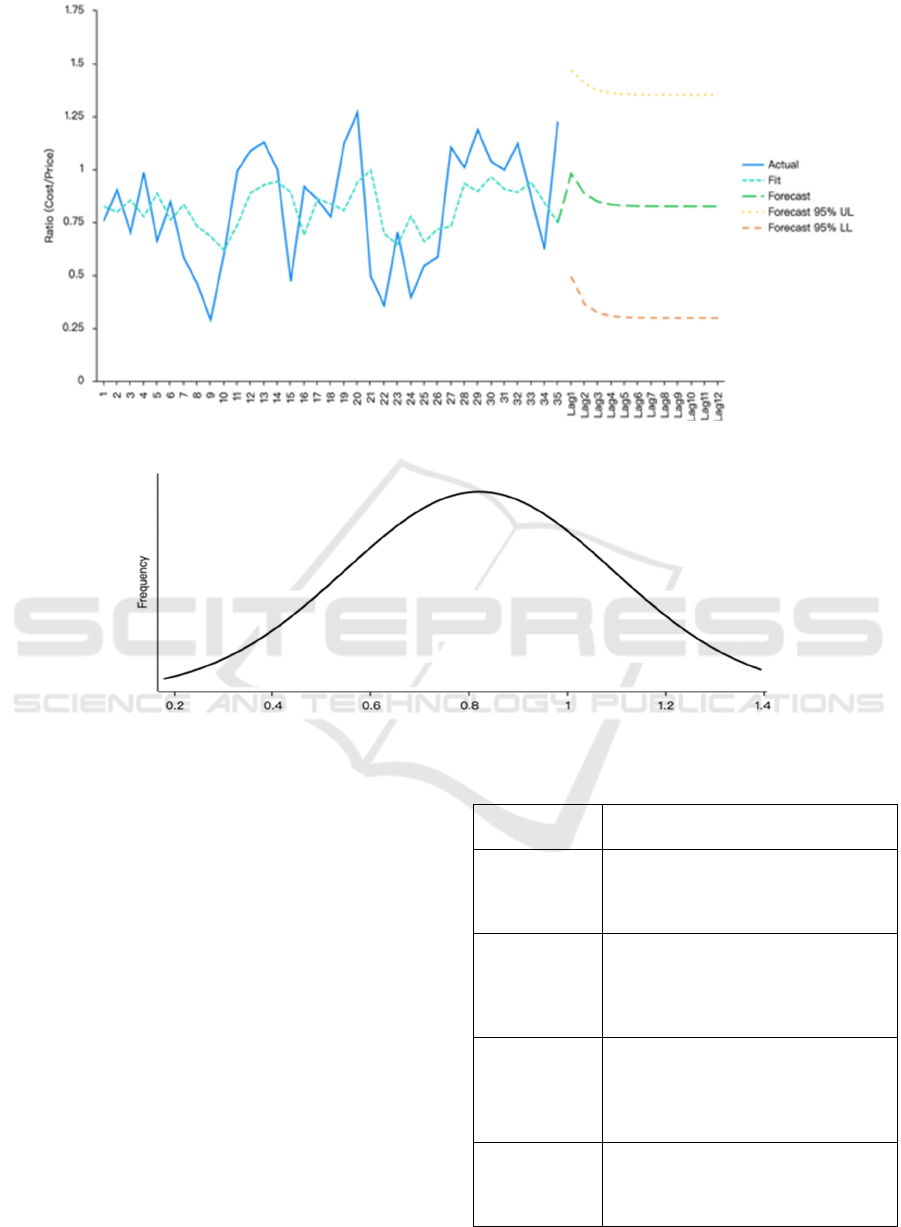
Figure 6: Ratio Forecast (Photo/Picture credit: Original).
Figure 7: Ratio Normal Distribution (Photo/Picture credit: Original).
The data visualization in Figure. 6 and Figure. 7
shows the data for Error Ratio (Estimated mining
cost/Real Cost), examining the last 35 issues of the
dataset: The 35 measurements of accuracy on the
dataset consistently centered around 0.85, with a
distribution that closely follows a normal distribution.
The distribution is bell-shaped, which is
approximately normal, with the mean around 0.85,
which demonstrate the accuracy of the model’s
predictions.
Reviewing historical data, the ratio of bitcoin
mining costs to the true price of bitcoin ranges from
0.5 to 1.2, which shows the profitability of miners as
well as the volatility of the bitcoin price. Based on this
data and the multiplier relationship with the mining
price, over a four-year timeframe (the timeframe of
each halving) after the 2024 Bitcoin mining halving
event, one can get the critical support price on Bitcoin
as presntend in Table 3.
Table 3: Price supporting analysis.
Important
Support Price
Explanation
$30000
Shutdown
Price
Historically, there has been no
instance where mainstream or flagship
models have shut down under relatively
moderate electricity prices.
$48000 Black
Swan Support
Price
(Shutdown price * 160%) No
Black Swan events have ever occurred
where the market price fell below 160%
of the electricity cost during the current
cycle.
$52000 Cost
Support Price
When the price falls below this
level, the risk of buying a BTC on the
secondary market is significantly lower
than the risks undertaken by miners who
invest tens of millions or more to mine.
$60000 Bear
Market
Support Price
In most cases during a bear market,
the market price fluctuates around
200% of the shutdown price, which is
around $60,000.
Analysis of the Prediction and Influencing Mechanism for Bitcoin Price
481

Table 4: Spearman correlation analysis.
BTC/USD
Gold/USDoz
Coefficient 0.882**
p value 0.000
NASDAQ INDEX
Coefficient -0.489**
p value 0.000
Spearman Correlation Matrix
BTC/USD Gold/USDoz NASDAQ Index
BTC/USD 1
Gold/USDoz 0.882** 1
NASDAQ INDEX -0.489** -0.571** 1
* p<0.05 ** p<0.01
3.2 Correlation Analysis
The Spearman correlation analysis was conducted to
assess the relationship between Bitcoin (BTC/USD)
Gold (Gold/USD per oz) and NASDAQ Index. The
results are given in Table 4. The BTC/USD and
Gold/USD per oz correlation coefficient is 0.882, and
it is at the 0.01 significance level, meaning that there
is a significant positive correlation between the two.
The NASDAQ INDEX and BTC/USD have a -0.489
correlation coefficient, at the 0.01 significance level.
The value of correlation coefficient between
BTC/USD and NASDAQ INDEX is -0.489 and
shows 0.01 level of significance, thus indicating that
there is a moderate negative relationship Between
BTC/USD and NASDAQ Index.
The result for Bitcoin and gold demonstrates a
strong positive correlation suggests that Bitcoin and
gold tend to move in the same direction, which means
the price of Bitcoin could possibly increase while the
price of gold increasing. This implies that Bitcoin
may be seen as a digital store of value by investors,
which is like gold (Dyhrberg, 2016). However, a
moderate negative correlation between Bitcoin and
NASDAQ Index are found, this negative relationship
means potential hedging opportunity against stock
market movements may exist, by using Bitcoin as a
tool, particularly in the tech-heavy NASDAQ.
Although Bitcoin and gold price is strongly
correlated, the unique risk-return features and the
negative correlation with the stock market shows its
possibility to play a role in portfolio diversification.
Brière et al. found that including even a small
proportion of Bitcoin in a diversified portfolio
significantly improved its risk-return characteristics
(Brière et al., 2015). The negative correlation with the
NASDAQ Index suggests that Bitcoin could
potentially server as a hedge against downturns in the
technology sector. This aligns with findings by
Guesmi et al., who found that Bitcoin can perform
effective diversifier in various financial markets
(Guesmi et al., 2019). During stock market downturns,
one needs to increase Bitcoin allocation to potentially
offset losses in equity positions.
During periods of economic uncertainty: Consider
allocating both Bitcoin and gold, as they showed
similar features, but also takes a dynamic hedging
strategy, the investors could adjust the proportion of
Bitcoin and other assets in their portfolios. One
research stressed that dynamic strategies involving
Bitcoin outperformed static approaches. (Platanakis
et al., 2020)
4 CONCLUSIONS
To sum up, this study investigates the price prediction
of bitcoin and analyse the inherit influencing
mechanisms. While this study provides valuable
insights into the measurement and prediction of
bitcoin mining costs, as well as exploring the
relationship between bitcoin and traditional assets,
there are undeniably still some limitations. Bitcoin's
time horizon as a mainstream investment target is less
than ten years, and the amount of historical data is
relatively limited, so this may limit the reliability of
back testing based on Bitcoin's historical data. The
cryptocurrency market is in a state of rapid change
and development, so limited historical data is one of
the major limitations of this paper. The mining cost
model used in this study, although validated by data
back testing and highly accurate, may not fully
capture the latest technological advances in mining
equipment and technology. Therefore, more accurate
and efficient mining-related models are necessary.
The correlation analysis does not analyse global
macroeconomic factors much, but only price
movements, which may miss the impact of some
policy shifts and major economic events. Future
ECAI 2024 - International Conference on E-commerce and Artificial Intelligence
482

research could improve these limitations in these
ways, i.e., using more accurate models of bitcoin
mining output and costs; analysing the impact of
specific macro policy and regulatory changes in
conjunction with the bitcoin and cryptocurrency
markets in a more comprehensive manner.
REFERENCES
Brière, M., Oosterlinck, K., Szafarz, A., 2015. Virtual
currency, tangible return: Portfolio diversification with
bitcoin. Journal of Asset Management, 16(6), 365-373.
Buterin, V., 2014. Ethereum Whitepaper. Ethereum.org.
Retrieved from: https://ethereum.org/en/whitepaper/
Dyhrberg, A. H., 2016. Bitcoin, gold and the dollar–A
GARCH volatility analysis. Finance Research Letters,
16, 85-92.
Guesmi, K., Saadi, S., Abid, I., Ftiti, Z., 2019. Portfolio
diversification with virtual currency: Evidence from
bitcoin. International Review of Financial Analysis, 63,
431-437.
Hayes, A., 2015. A Cost of Production Model for Bitcoin.
Available at SSRN 2580904.
Narayanan, A., Bonneau, J., Felten, E., Miller, A.,
Goldfeder, S., 2016. Bitcoin and Cryptocurrency
Technologies. Princeton University Press.
Platanakis, E., Urquhart, A., 2020. Should investors include
Bitcoin in their portfolios? A portfolio theory approach.
The British Accounting Review, 52(4), 100837.
Santander, I., 2015, The Fintech 2.0 Paper: rebooting
financial services.
Swan, M., 2015. Blockchain : blueprint for a new economy.
O’Reilly.
Wang, Y., Han, J. H., Beynon-Davies, P., 2019.
Understanding Blockchain Technology for Future
Supply chains: a Systematic Literature Review and
Research Agenda. Supply Chain Management: An
International Journal, 24(1), 62–84.
Yermack, D., 2017. Corporate Governance and
Blockchains. Review of Finance, 21(1), 7–31.
Analysis of the Prediction and Influencing Mechanism for Bitcoin Price
483
