
E-Commerce Sales Analysis and Prediction in UK
Xinyi Wu
a
College of Business, City University of Hong Kong, Hong Kong, China
Keywords: E-Commerce, Prediction, UK, Random Forest.
Abstract: During recent years, it has been remarkable that the e-Commerce industry has already grown rapidly. It could
provide customers with access to a wide range of products that enable them to make purchases from the
convenience of their homes. Nevertheless, this has brought a great number of new challenges to businesses,
especially regarding sales, which is the most crucial aspect in e-commerce. To obtain insights and engineer
features, the study adopted the EDA and RFM models. Subsequently, several predictive models, including
Artificial Neural Network, Linear Regression, Decision Trees, and Random Forest, are utilized to forecast
sales. In addition, the performance of these models was evaluated and compared on the basis of various
metrics. However, there are still certain limitations and future directions. This research contributes to a better
understanding of e-commerce sales dynamics in the UK that could provide valuable insights for businesses
and researchers in the field, thus improving sales prediction accuracy and decision making.
1 INTRODUCTION
In contemporary times, e-commerce has grown
remarkably and meteorically. The digital economy
has been exponential expanded, thus providing
customers with access to an almost limitless range of
products and services. Both the ease of use and
accessibility have revolutionized shopping habits.
This could allow people to make purchased anytime
and anytime that transcending their location and time
constraints. It has not only brought more convenience
to consumers, but also changed the corporate
environment significantly. And as to access a wider
customer base, companies of all sizes, from small
startups to massive multinational corporations, have
rushed to create an online presence. The intensified
competition leading to continuous innovation in
delivery methods, customer service, marketing
strategies and so on. Furthermore, technological
advancements in fields such as mobile applications,
secure payment gateways, and personalized
recommendation systems have further contributed to
the growth of e-commerce. It has seamlessly
integrated into people's lives, becoming an
indispensable component of the contemporary
shopping experience.
a
https://orcid.org/ 0009-0009-7648-3663
Despite this remarkable growth, existing studies
in the field of e-commerce have left certain aspects
uncovered or inadequately explored. This has given
rise to the current research. In this study, it focused
on the analysis and prediction of online retail
operations that do not have brick-and-mortar stores.
To achieve this, the study collected a publicly
available transactional dataset from the Kaggle
website. Then employed exploratory data analysis
and the reliability, frequency, and monetary value
models to extract valuable insights and engineer
effective features. Additionally, it utilized a diverse
range of methods, including the potent artificial
neural network, the classic linear regression, the
intuitive decision tree, and the robust random forest,
for modelling and prediction. By comparing the
performance of these algorithms, the research aimed
to determine the most appropriate approach for
precise predictions in the e-commerce domain.
This research holds significant importance as it is
expected to fill the existing knowledge gaps, provide
a deeper understanding of online retail patterns, and
offer valuable guidance for businesses operating in
this highly competitive and rapidly evolving
landscape. It has the potential to enhance business
strategies, optimize customer experiences, and drive
the continued growth and success of e-commerce
enterprises.
Wu, X.
E-Commerce Sales Analysis and Prediction in UK.
DOI: 10.5220/0013268600004568
In Proceedings of the 1st International Conference on E-commerce and Artificial Intelligence (ECAI 2024), pages 447-452
ISBN: 978-989-758-726-9
Copyright © 2025 by Paper published under CC license (CC BY-NC-ND 4.0)
447
2 LITERATURE REVIEW
In the realm of e-commerce, prediction has become a
crucial area of research. Previous studies have
utilized a variety of methods to forecast different
aspects of online retail. For instance, Zheng et al.
(2013) employed artificial neural networks to predict
customer behavior. This approach demonstrated the
power of machine learning algorithms in
understanding complex patterns in e-commerce data.
Similarly, Usmani et al. (2017) focused on
predicting sales in e-commerce, highlighting the
importance of accurate predictions for business
planning and decision-making. The use of advanced
analytics and data-driven models in these studies has
shown promising results in terms of improving the
efficiency and effectiveness of e-commerce
operations.
However, there are several aspects where the
present study differentiates itself. While existing
studies have often focused on a single prediction
method or a limited set of variables, this research
takes a comprehensive approach by incorporating
multiple algorithms such as Artificial Neural
Network, Linear Regression, Decision Tree, and
Random Forest. This allows for a more robust
comparison and identification of the most suitable
method for accurate predictions in the specific
context of online retail without physical stores.
Moreover, previous studies may not have fully
explored the potential of combining exploratory data
analysis and the RFM model. In this study, the use of
Exploratory Data Analysis helps in understanding the
characteristics and patterns of the dataset, providing a
solid foundation for further analysis. The RFM model
(Wei et al., 2010), with its segmentation of customers
based on Recency, Frequency, and Monetary value,
offers a detailed view of customer behavior and
allows for targeted strategies.
By integrating these techniques and a diverse set
of algorithms, this study aims to fill the gaps in
existing research and provide more valuable insights
and practical solutions for businesses in the rapidly
evolving field of e-commerce. It is expected to
contribute to a better understanding of online retail
patterns and enhance the ability to make accurate
predictions, ultimately leading to improved business
strategies and customer experiences.
3 METHODOLOGY AND
RESULTS
3.1
Feature Engineering
3.1.1 EDA
A recent study found that Exploratory Data Analysis
(EDA) is a fundamental approach in data analysis that
could summarize the key features of a dataset. And it
involves a range of techniques to make date
visualizable, thus enabling a better understanding of
the different aspects of the data, such as the
distribution, structure and relationships (Komorowski
et al., 2016).
This powerful methodology is a crucial
foundation that could help people to extract
meaningful patterns and insights from complex
datasets. It enables to gain an initial understanding of
the data's nature, and thereby laying the groundwork
for more in-depth analyses and informed decision-
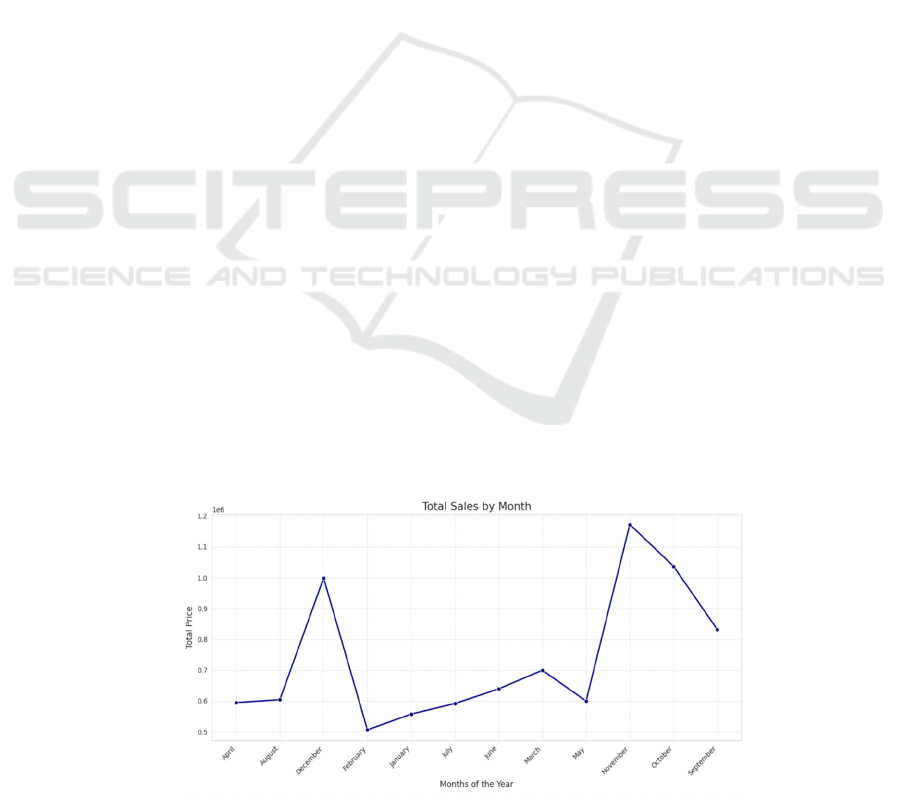
making. The results of the total sales by month and
day are as follow in Figure 1 and Figure 2.
• Total sales by month December, November,
October and September have the highest sales in one
year.
• Total sales by day
Figure 1: Total Sales by Month.
ECAI 2024 - International Conference on E-commerce and Artificial Intelligence
448
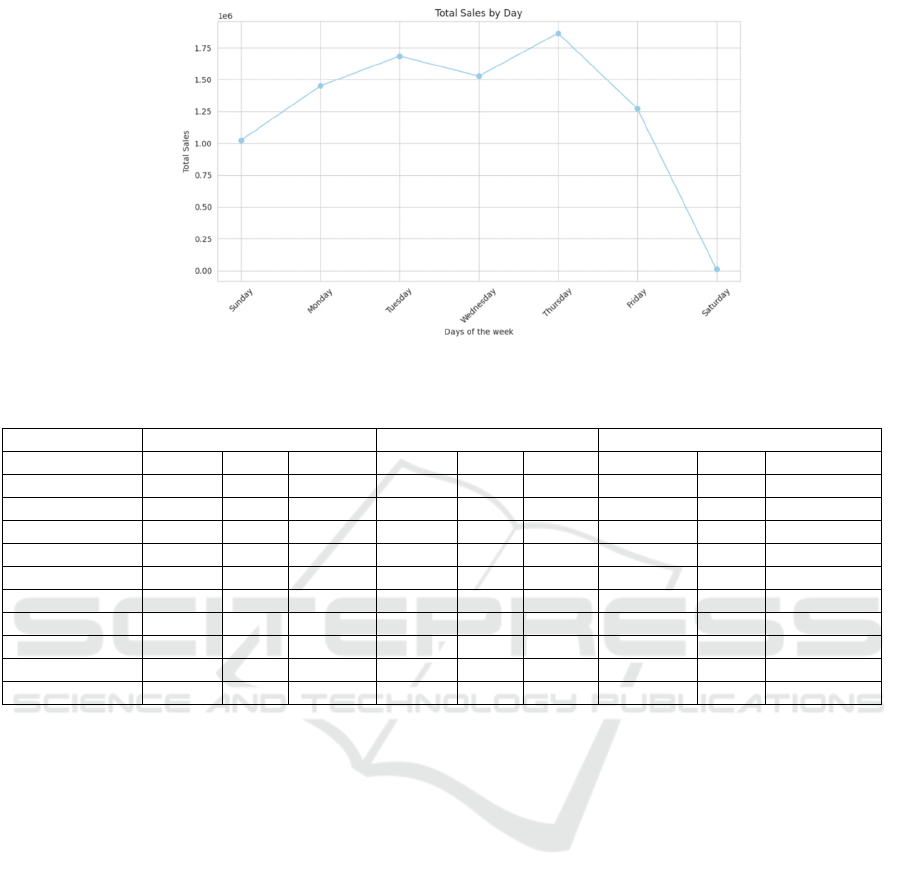
Figure 2: Total Sales by Day.
Table 1: RFM Segmentation Summary.
Recency Frequency Monetary
Segment Mean Count Sum Mean Count Sum Mean Count Sum
About to sleep 53.819 343 18460 1.201 343 412 441.32 343 151372.76
At risk 152.159 611 92969 3.074 611 1878 1188.878 611 726404.651
Can’t loose 124.117 77 9557 9.117 77 702 4099.45 77 315657.65
Champions 7.119 663 4720 12.554 663 8323 6852.264 663 4543051.143
Hibernating 213.886 1015 217094 1.126 1015 1143 403.978 1015 410037.504
Loyal customers 36.287 742 26925 6.830 742 5068 2746.067 742 2037581.976
Need attention 53.266 207 11026 2.449 207 507 1060.357 207 219493.9
New customers 8.580 50 429 1.000 50 50 386.199 50 19309.960
Potential loyalists 18.793 517 9716 2.017 517 1043 729.511 517 377157.18
Promising 25.747 87 2240 1.000 87 87 367.087 87 31936.55
Sunday, Monday, Tuesday, Wednesday,
Thursday and Friday have the highest sales in one
week.
3.1.2 RFM
The RFM (Recency, Frequency, Monetary) model
was adopted for its comprehensive view of customer
behavior. It helps identify engaged and at-risk
customers, understand loyalty through frequency, and
highlight valuable customers via monetary value. The
study used the RFM model to segment the customer
base into distinct groups, like "Champions" and
"About to sleep." This enabled analyzing group
characteristics and patterns, allowing for more precise
marketing and customer engagement. The study
focused on reactivating at-risk customers, nurturing
potential loyalists, and rewarding loyal customers to
enhance retention and increase revenue.
Recency: It refers to how recently a customer
purchase the things. And more recent the customer’s
purchase, the more likely continue purchasing have.
Therefore, this information could be used to
encourage lapsed customers to resume buying and
attract recent customers to make more purchases
(Segal, 2022).
Frequency: It could be influenced by several
factors such as products type, the purchase price and
the need for replenishment or replacement. And it
could remind customers to visit the business within a
given time frame through predicting the cycle of
purchase (Segal, 2022).
Monetary: It is based on how much that the
customer purchases within a specific time period. In
general, the more a client spends, the more valuable
to the business. And note that it is significate not to
alienate the customers who spend consistently but
spend less per transaction (Segal, 2022). Some basic
information is shown in Table 1.
3.2
Data Prepossessing
In the data preprocessing stage of the study, several
crucial steps were carried out.
Firstly, data cleaning was performed to handle
missing values, outliers, and any data anomalies to
E-Commerce Sales Analysis and Prediction in UK
449

ensure the data's quality and reliability. The creation
of the 'quantity per invoice' feature was another
important aspect. This feature helped in
understanding the distribution and patterns of the
quantity of items per invoice, providing valuable
insights into the purchasing behavior. Besides,
bucketing the quantity and unit price feature was also
implemented to categorize the data into meaningful
ranges, facilitating easier analysis and interpretation.
Furthermore, extracting and bucketing dates was
essential for temporal analysis and identifying
patterns based on specific time periods.
Finally, the dataset was separated into training and
testing subsets through the 'Train – Test split'
procedure. The test size was set to 0.20, and a random
state of 42 was used. This division allowed for the
accurate assessment and validation of the models
during the subsequent analysis stages. These
preprocessing steps were fundamental in preparing
the data for effective analysis and ensuring the
validity and reliability of the subsequent results.
3.3 Modelling
3.3.1 ANN
An Artificial Neural Network (ANN) is a
computational model that people inspired from
biological nervous processing. And because of the
reliability, nonlinearity, simplicity and robustness it
has, ANN can be used to solve and model numerous
complex environment systems (Malekian & Chitsaz,
2021).
In typical, an ANN have three parts that are one
input layer, the hidden layer which could have one or
more and one output layer. Besides, there are multiple
neurons in each layer.
The output 𝑦 of a neuron in a layer is calculated
based on the weighted sum of the previous layer’s
inputs 𝑥
and a bias term 𝑏, and then followed by the
application of an activation function 𝑓. It can be
represented mathematically as:
𝑦 =
𝑓
(𝑤
𝑥
+ 𝑏
i=
1
)
(1)
where 𝑤
are the weights associated with the
inputs 𝑥
. In this method, there are there common
activation functions that could be used, including the
sigmoid function 𝑓
(
𝑧
)
=
, 𝑓
(
𝑧
)
=max (0,𝑧)
named the rectified linear unit (ReLU) function, and
the hyperbolic tangent function 𝑓
(
𝑧
)
=tanh (𝑧) .
And selecting the most accurate and effective
approach in the different circumstances (Yang &
Wang, 2020).
During the training of an ANN, according to study
(Yang & Wang, 2020), the weights 𝑤
and the biases
𝑏 are adjusted to minimize a loss function 𝐿 as large
as possible. This function is usually used to measure
the difference between the output of the network and
the desired. This is typically accomplished by using
optimization algorithms such as gradient descent.
Therefore, ANNs have shown remarkable
capabilities in different problems. For instance,
handling vast amounts of data, pattern recognition,
classification, regression, prediction and so on.
Additionally, because of these numerous great
characters, it has been applied in various fields
widely, such as the recognition of image and speech,
financial forecasting and the process of natural
language.
3.3.2 Linear Regression
As James et al. (2023) stated that Linear regression is
actually a statistical method. And it could be
employed to establish a model that describe the
relationship between a dependent variable and
independent variable which have one or more.
In simple linear regression, the relationship is
assumed to follow the equation:
𝑦 = 𝛽
+ 𝛽
𝑥 + 𝑒
(2)
𝛽
is the intercept, 𝛽
is the line’s slop, and 𝑒 is
the error term. That 𝑒 could represent the deviation
from the perfect linear relationship.
The goal of linear regression is to estimate 𝛽
and
𝛽
values, thereby making the sum of the squared
residuals is minimized. Additionally, the residual is
the differences between the observed 𝑦 and the
predicted values based on the linear equation (James
et al., 2023).
Mathematically, the sum of all squared residuals
is given by:
𝑅𝑆𝑆 = 𝑦
−
(
𝛽
+ 𝛽
𝑥
)
(3)
To find the optimal values of 𝛽
and 𝛽
, the least
squares method can be used. The formulas for the
estimators of 𝛽
and 𝛽
are:
𝛽
=
∑
(𝑥
−𝑥
̅
)(𝑦
−𝑦)
∑
(𝑥
−𝑥
̅
)
(4)
𝛽
= 𝑦−𝛽
𝑥
̅
(5)
where 𝑥̅ and 𝑦 are the means of 𝑥 and 𝑦 ,
respectively.
Therefore, linear regression has wide applications
in diverse fields which including prediction, trend
analysis, and understanding the relationship between
variables.
ECAI 2024 - International Conference on E-commerce and Artificial Intelligence
450

3.3.3 Decision Tree
Decision Tree have flowchart-like structure. And it is
a non-parametric supervised learning algorithm that
could be used in several tasks like classification and
regression. Besides, it has a hierarchical tree
structure, and a complete decision tree consists of
four different parts that are a root node, branches and
the nodes from internal and leaf (Song & Lu, 2015).
Each internal node of the decision tree would
evaluate a feature in order to separate the data into
subsets. And the goal is to create splits, thus
maximizing the purity or homogeneity of the target
variable in the resulting subsets.
In actual, there are numerous ways to select the
best attribute at every node. But there are two
methods that are commonly used as segmentation
criteria for decision tree modeling which named Gini
impurity and entropy.
The Gini impurity for a node 𝑡 with 𝑦 classes and
the proportion 𝑝
of instances belonging to class 𝑘
are given by:
𝐺𝑖𝑛𝑖
(
𝑡
)
=1−𝑝
(6)
The entropy of a node 𝑡 is defined as:
𝐸𝑛𝑡𝑟𝑜𝑝𝑦
(
𝑡
)
= −𝑝
𝑙𝑜𝑔
(𝑝
)
(7)
In general, Decision trees could be understood and
interpret easily. Additionally, that is little to no data
preparation required and more flexible than other
algorithms.
3.3.4 Random Forest
Random Forest is an ensemble learning method
which could be used in various tasks such as
classification, regression and so on. Besides, when
making predictions at a training time, it would
combine multiple decision trees (Rigatti, 2017).
The fundamental idea of Random Forest is to
build a collection of decision trees that each one is
trained on a random subset of the training data, then
using a randomly selected features’ subset. That 𝑋 =
{𝑥
, 𝑥
,…,𝑥
} be the input features and 𝑌 =
{𝑦
, 𝑦
,…,𝑦
} be the corresponding target variables.
And when training a decision tree in a Random
Forest, a random subset of features could be
considered for splitting the data at every node of the
tree. There are two functions able to choose when
splitting a certain impurity measure maximize which
named entropy and Gini impurity.
For a node 𝑡 with classes 𝐶
, 𝐶
,…,𝐶
and the
proportion of class 𝐶
given by 𝑝(𝐶
), the equation of
the Gini impurity is defined as follow:
𝐺𝑖𝑛𝑖
(
𝑡
)
=1−𝑝(𝐶
)
(8)
After training, in order to predict an input 𝑥, the
Random Forest 𝑦
(
𝑥
)
could be realized by averaging
all the individual trees’ predictions:
𝑦
(
𝑥
)
=
1
𝑇
𝑦
(𝑥)
(9)
Where 𝑇 is the decision trees number and 𝑦
(𝑥) is
the prediction of the 𝑖-th tree in the certain input of 𝑥.
Therefore, random Forest has several advantages,
including high accuracy and the ability to handle the
data in high dimensional.
3.4 Results and Comparison
The different model’s performance is calculated
using the coefficient of determination (𝑅
) (See Table
2).
Table 2: Model Performance Evaluation by Coefficient of
Determination.
ANN Linear
Regression
Decision
Tree
Random
Fores
t
𝑅
-
0.0173
0.1563 0.5521 0.5859
The result of the coefficient of determination for
the ANN method was -0.0173. 𝑅
is examined the
degree to which the statistical model predicts the
outcome. And according to the properties of 𝑅
,
when the coefficient of determination is negative, it
indicates poor performance of the model in capturing
the relationship between the variables of input and
output.
Moreover, according to research (Turney, 2022),
the better a model is at making predictions, the closer
its 𝑅
will be to 1. And it is obvious that the model of
random forest resulted in the highest 𝑅
value which
was 0.5859.
Therefore, random forest performed best in sales
prediction in this dataset. And followed by the
decision tree algorithm, then the linear regression has
the poorest performance. This superior performance
can be attributed to the nature of ensembles that
include multiple decision trees combined, thus
making more accurate predictions. The randomness
of feature selection and tree construction helps reduce
overfitting risk and increase generalization ability.
E-Commerce Sales Analysis and Prediction in UK
451

4 CONCLUSIONS
The e-commerce industry has been seen a rapid
growth in recent years. Customers are enabled to
access a wide variety of products and purchase the
things from the comfort of their homes. However, this
has presented numerous new challenges to
businesses, particularly in sales, which is the most
critical aspect in e-commerce. To gain insights and
engineer features, the study employed the EDA and
RFM models. Then, several predictive models such
as Artificial Neural Network, Linear Regression,
Decision trees, and Random Forest were used to
predict sales. Additionally, the performance of these
different models was measured and compared based
on various metrics. The comparison revealed that the
method of Random Forest performed the best in terms
of accuracy, followed by the Decision Tree model.
However, both the Artificial Neural Network and
Linear Regression models had relatively lower
accuracies. There are still certain limitations and
future directions. This research could help to have a
better understanding of the dynamics of e-commerce
sales in the UK and can offer valuable insights for
businesses and researchers in the field, thereby
enhancing sales prediction accuracy and decision-
making.
The study has limitations that future research
should address. In feature engineering, not all features
were fully utilized, potentially missing hidden
patterns. Future efforts need to explore more
comprehensive techniques to extract deeper insights.
Generalizability is a concern as the model may not
work well on new e-commerce datasets.
Incorporating diverse datasets and cross-validation
can improve applicability. Additionally,
experimenting with its hyperparameters and
architectures can enhance e-commerce sales
predictions. Validating on external datasets is crucial
for understanding robustness and effectiveness. By
focusing on these areas, future research can build on
current findings and provide more reliable solutions
for e-commerce businesses.
REFERENCES
James, G., Witten, D., Hastie, T., Tibshirani, R., & Taylor,
J. (2023). Linear Regression. An Introduction to
Statistical Learning, 69–134.
Komorowski, M., Marshall, D. C., Salciccioli, J. D., &
Crutain, Y. (2016). Exploratory Data Analysis.
Secondary Analysis of Electronic Health Records, 185–
203.
Rigatti, S. J. (2017). Random Forest. Journal of Insurance
Medicine, 47(1), 31–39.
Segal, T. (2022, November 19). Inside Recency,
Frequency, Monetary Value (RFM). Investopedia.
https://www.investopedia.com/terms/r/rfm-recency-
frequency-monetary-value.asp
Song, Y. Y., & Lu, Y. (2015). Decision tree methods:
applications for classification and prediction. Shanghai
archives of psychiatry, 27(2), 130–135.
Turney, S. (2022, April 22). Coefficient of Determination
(R2) | Calculation & Interpretation. Scribbr.
https://www.scribbr.com/statistics/coefficient-of-
determination/#:~:text=coefficient%20of%20determin
ation-
Usmani, Z. A., Manchekar, S., Malim, T., & Mir, A. (2017).
A predictive approach for improving the sales of
products in e-commerce. 2017 Third International
Conference on Advances in Electrical, Electronics,
Information, Communication and Bio-Informatics
(AEEICB).
Wei, J. T., Lin, S. Y., & Wu, H. H. (2010). A review of the
application of RFM model. African journal of business
management, 4(19), 4199.
Yang, G. R., & Wang, X.-J. (2020). Artificial Neural
Networks for Neuroscientists: A Primer. Neuron,
107(6), 1048–1070.
Zheng, B., Thompson, K., Lam, S. S., Yoon, S. W., &
Gnanasambandam, N. (2013). Customers’ behavior
prediction using artificial neural network. In IIE Annual
Conference. Proceedings (p. 700). Institute of Industrial
and Systems Engineers (IISE).
ECAI 2024 - International Conference on E-commerce and Artificial Intelligence
452
