
Stock Price Prediction Using Technical Indicators: A
CNN+LSTM+Multi-Head Attention Approach
Juncheng Long
College of Letters & Science, University of Wisconsin-Madison, Madison, U.S.A.
Keywords: Stock Price Prediction, Technical Indicators, CNN+LSTM+Multi-Head Attention, Financial Forecasting.
Abstract: As a matter of fact, on account of the inherent volatility and complexity of financial markets, predicting stock
prices has always been a highly challenging task especially under the complex situation in recent years. With
this in mind, this study explores the application of advanced machine learning models, particularly the
CNN+LSTM+multi head attention model, to predict stock prices based on a comprehensive set of technical
indicators. Based on evaluating the effectiveness of the model through various trading strategies and
comparing its performance with other models, the results show that the CNN+LSTM+multi head attention
model is significantly superior to other models in capturing market trends and achieving cumulative returns.
At the same time, the current limitations for the models as well as improvements proposals for further study
have been discussed at the same time. Overall, this study highlights the practical application value of the
model in financial forecasting, providing a powerful tool for optimizing trading strategies.
1 INTRODUCTION
Predicting stock prices has always been one of the
most challenging tasks in financial markets, mainly
due to the inherent volatility, complex
interdependence, and the influence of numerous
factors ranging from microeconomic indicators to
macroeconomic events. Although traditional time
series models such as Autoregressive Integrated
Moving Average (ARIMA) and Generalized
Autoregressive Conditional Heteroskedasticity
(GARCH) have been widely used in financial
forecasting, they often perform poorly in capturing
common nonlinear and dynamic patterns in financial
data, especially during periods of market instability
(Bollerslev, 1986; Sezer et al., 2020). As research
deepens, new methods gradually enter the field of
vision. In recent years, the rise of deep learning
techniques, especially Long Short-Term Memory
(LSTM) networks, has made significant progress in
processing sequential data and modelling complex
dependencies in time series (Graves, 2012; Greff et
al., 2016), provided a new direction for financial
forecasting.
In addition, technical indicators play a crucial role
in financial forecasting, providing valuable insights
into market trends, volatility, and potential price
reversals. These indicators, ranging from moving
averages to momentum oscillations, help traders and
analysts better grasp market sentiment and make
wiser decisions (Kim & Kim, 2019). Therefore, by
integrating a comprehensive set of technical
indicators, not only can the multidimensional
characteristics of the financial market be reflected,
but the predictive accuracy of the model can also be
significantly improved (Thakkar & Chaudhari, 2021).
This method provides an effective supplement to the
shortcomings of traditional models and marks an
important progress in the field of financial forecasting.
In recent years, significant progress in the field of
deep learning has driven the development of hybrid
models, which significantly improve the performance
of financial market forecasting by integrating the
advantages of different architectures. LSTM
networks are widely used in stock price prediction
due to their powerful ability to model long-term
dependencies and have shown better performance
than traditional statistical methods in multiple studies
(Siami et al., 2018). Based on this, the hybrid model
integrating Convolutional Neural Networks (CNN)
and LSTM demonstrates significant potential in
capturing local and temporal features in financial data.
Specifically, CNN excels at extracting features from
short-term patterns, while LSTM performs well in
handling sequence dependencies (Kim & Kim, 2019).
This hybrid architecture enhances the ability to model
Long, J.
Stock Price Prediction Using Technical Indicators: A CNN+LSTM+Multi-Head Attention Approach.
DOI: 10.5220/0013264900004568
In Proceedings of the 1st International Conference on E-commerce and Artificial Intelligence (ECAI 2024), pages 437-446
ISBN: 978-989-758-726-9
Copyright © 2025 by Paper published under CC license (CC BY-NC-ND 4.0)
437
the complexity of financial markets by synergistically
utilizing the advantages of two models.
On this basis, the introduction of self-attention
mechanisms, especially in Transformer models,
marks another important progress in this field. This
mechanism allows the model to dynamically focus on
the most relevant parts of the input sequence, thereby
further improving the accuracy of predictions
(Vaswani, 2017). The hybrid model combining CNN,
LSTM, and self-attention mechanism demonstrates
excellent ability in balancing short-term feature
capture and long-term dependency modelling,
significantly improving the accuracy of stock price
prediction (Li et al., 2019). This multi model fusion
method not only expands the application prospects of
deep learning in financial market prediction, but also
lays a solid foundation for building more accurate and
robust prediction models. A significant innovation in
this domain is the optimization of multi-head self-
attention mechanisms. In traditional self-attention, all
heads treat the sequence data similarly, potentially
overlooking critical time-specific information. The
optimized multi-head self-attention mechanism,
however, allows each attention head to specialize in
capturing different temporal aspects of the data. This
not only enhances the model's ability to focus on
relevant information at various time scales but also
improves its robustness in volatile market conditions
(Jialin et al., 2022). Integrating this optimized
attention mechanism with a comprehensive set of
technical indicators ensures that the model can
effectively process a diverse range of market signals,
leading to more accurate and reliable predictions
(Fischer & Krauss, 2018; Zhang, et al., 2023).
Although existing models have made significant
progress in predicting stock prices, there are still
many challenges in dealing with the complexity and
multidimensionality of financial time series data. The
main objective of this study is to explore the potential
of a hybrid model that combines CNN, LSTM, and
optimized multi head self-attention mechanism in
stock price prediction, particularly by
comprehensively utilizing a wide range of technical
indicators to improve prediction accuracy and model
robustness. The research object selected Apple Inc.
(AAPL) stock, which is an ideal choice for verifying
the effectiveness of advanced predictive models due
to its high liquidity and extensive market analysis. By
integrating multiple technical indicators and applying
the innovative CNN+LSTM+Multi-Head self-
attention architecture, this study not only aims to
provide more accurate stock price predictions, but
also hopes to bring new insights to the field of
financial forecasting and promote its development.
The structure of this paper is organized as follows:
The next section discusses the data collection and
preprocessing methods, followed by a detailed
description of feature engineering and model
construction. Subsequent sections evaluate the
model's performance and conduct back testing
through various trading strategies. Finally, the paper
concludes with a summary of the key findings and
suggestions for future research.
2 DATA AND METHOD
2.1 Data
In data analysis projects, data collection and
preprocessing are the foundation of the entire analysis
process. The accuracy and completeness of time
series data in financial markets are crucial. The data
analysed this time comes from the stock trading
records of AAPL (Apple Inc.), covering multiple
features such as dates and closing prices. The data
mainly comes from various technical indicators
provided by Yahoo Finance and ta lib library. The
data range is from December 31, 2010 to December
31, 2022. It is hoped to predict daily returns and
capture fluctuations in stock returns. In order to
effectively demonstrate the characteristics of the data,
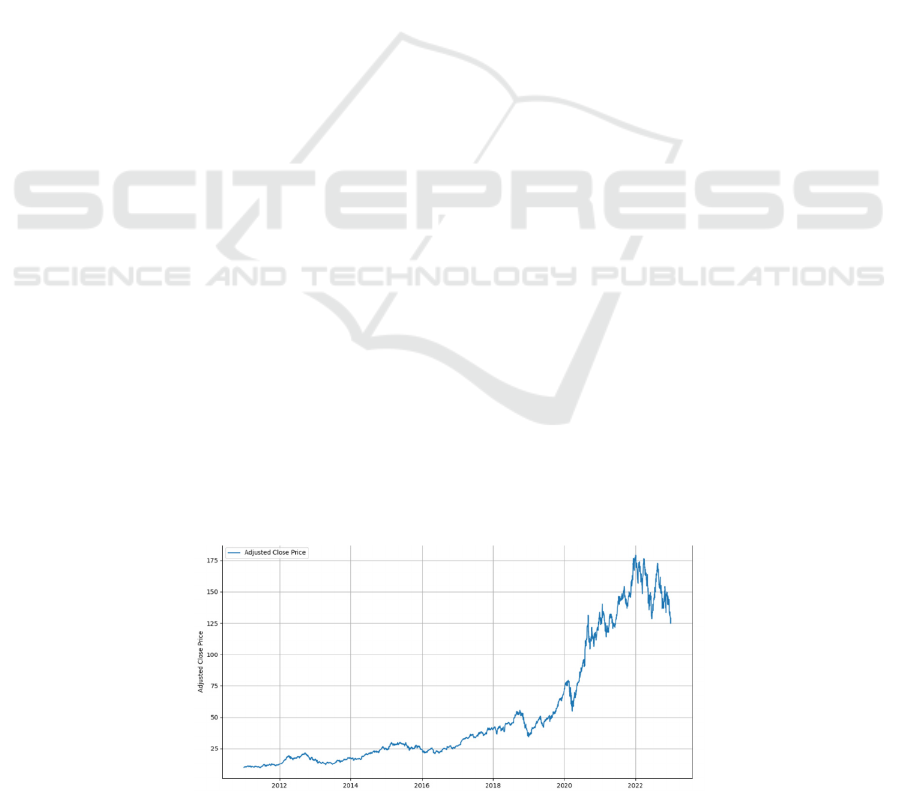
one draws the closing price time series in Figure. 1
Figure 1: Closing price time series chart (Photo/Picture credit: Original).
ECAI 2024 - International Conference on E-commerce and Artificial Intelligence
438
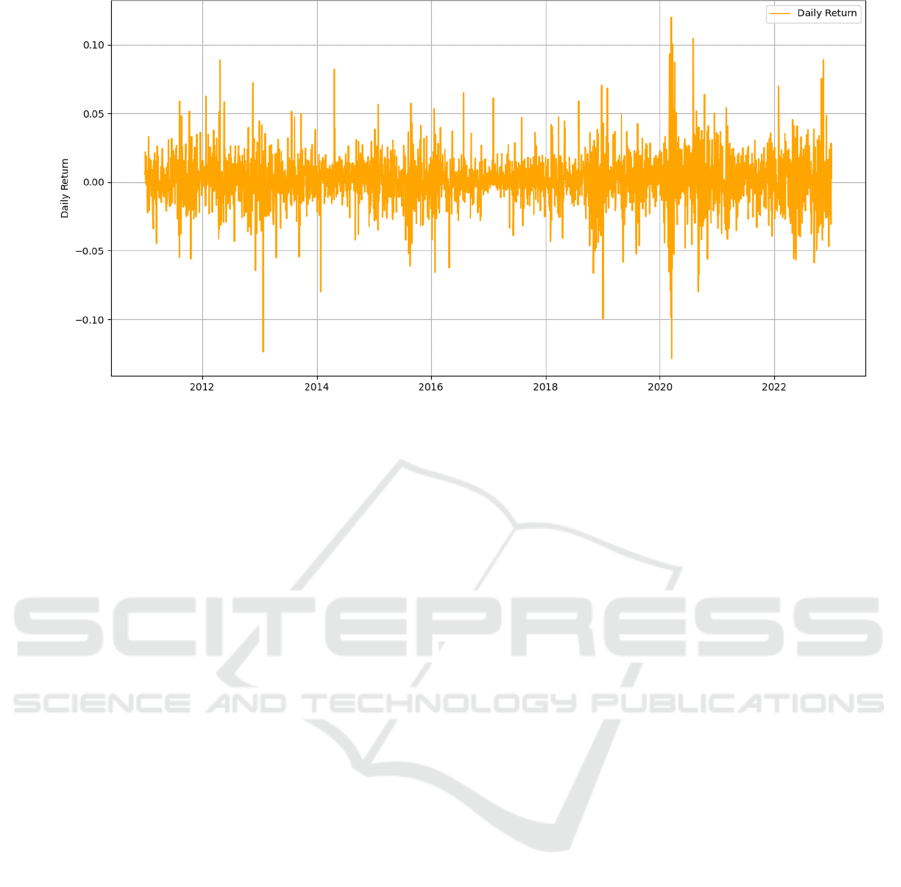
Figure 2: Daily Yield Time Series Chart (Photo/Picture credit: Original).
As shown in Figure. 1, AAPL's stock price
experienced significant growth from 2010 to 2022. At
the beginning of 2010, AAPL's closing price was
relatively low, close to $20. In the following years,
AAPL's stock price experienced a steady increase,
especially after 2019, when the stock price rapidly
climbed and reached its peak at around $180 in late
2021 and early 2022. The significant growth during
this period reflects Apple's success in the global
market and the widespread acceptance of its products
and services. However, in 2022, one can observe a
slight decline in AAPL's stock price, showing
significant volatility. From Figure. 2, the daily return
changes of AAPL stocks. Daily return reflects the
percentage change in stock prices relative to the
previous day and is an important indicator for
measuring stock volatility. The chart shows that the
daily returns of AAPL are mostly concentrated
between -0.05 and 0.05, indicating that the price
fluctuations of AAPL are relatively small on most
trading days. However, there were also some extreme
fluctuations, especially during the periods of 2014
and 2020, where there were significant periods of
high volatility, with yields reaching above 0.1 or
below -0.1. These extreme fluctuations are usually
related to major market events or important news
released by companies. Overall, the distribution of
daily returns indicates that AAPL stocks experienced
multiple periods of high volatility between 2010 and
2022, but overall maintained a relatively stable
growth trend, which is why chose AAPL stocks.
2.2 Variables,
Cleaning
and Selection
In the original dataset, AAPL stock data consisted of
3021 rows and 284 columns, with some features
containing missing values. One addressed this by
removing features with over 10% missing data and
using interpolation to fill the remaining gaps,
resulting in a cleaned dataset with 276 features. For
constructing the predictive target variable, one
converted the annual risk-free rate into a daily return,
calculated the daily stock return, and labelled it as 1
if it exceeded the risk-free rate, and 0 otherwise. The
target variable was then lagged by one day to predict
future trends. Furthermore, this study visualizes the
distribution of the target variable in Figure. 3. It can
be seen that the distribution of the constructed target
variables is relatively balanced. The number of
samples marked as 0 (daily returns less than or equal
to the risk-free rate) is slightly higher than the number
marked as 1 (daily returns exceeding the risk-free
rate). This distribution indicates that during the
selected time period, the returns of most trading days
did not exceed the risk-free rate, but there were still a
considerable number of trading days with returns
exceeding this benchmark. This distribution feature is
beneficial for model training, as an excessively
imbalanced distribution of target variables may lead
to the model's preference for a certain class, thereby
affecting predictive performance. The relative
balance of target variables will help improve the
generalization ability of the model.
Stock Price Prediction Using Technical Indicators: A CNN+LSTM+Multi-Head Attention Approach
439
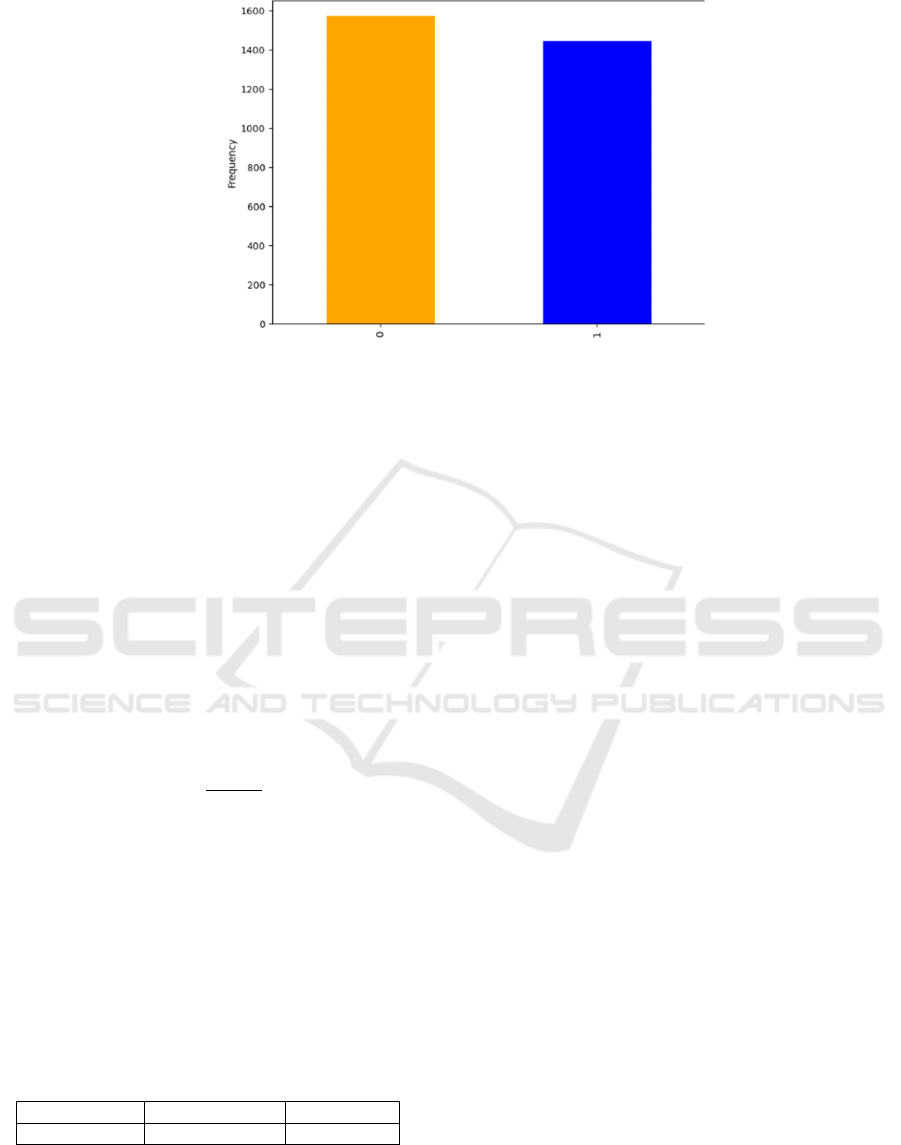
Figure 3: Distribution diagram of target variables (Photo/Picture credit: Original).
In time series prediction tasks, especially in
financial data analysis, class imbalance is a common
phenomenon. The number of days that AAPL stocks
rise and fall may not be balanced, which can cause the
model to be more inclined to predict more frequent
categories during training (for example, the number
of days that fall may be more than the number of days
that rise). To address this issue, one performed the
following operations to balance the class distribution
of the target variable and improve the predictive
performance of the model. One first calculated the
sample size for each category in the target variable.
Category 0 represents daily returns less than or equal
to the risk-free rate, while Category 1 represents daily
returns exceeding the risk-free rate. Calculating the
weight of each category using the following formula:
𝜔
𝑁
𝑛
𝐾
1
Among them, N is the total number of all samples in
the dataset, 𝑛
is the number of samples in i-th
category, and K is the total number of categories.
When training the LSTM model, this study passes
these weights as class Weight parameters to the
model. In this way, the model will adjust the learning
of each category based on weights during each
iteration, thus balancing the problem of imbalanced
categories. After calculation, the weights are shown
in the Table 1.
Table 1: Target variable weight table.
1 0
Weight 1.0833 0.9286
This study applied a series of feature selection and
dimensionality reduction techniques aimed at
extracting the most informative parts from a large
number of features to improve the predictive
performance and efficiency of the model. The entire
process combines Recursive Feature Elimination
(RFE), K-Means clustering, and Self Organizing
Mapping (SOM) to gradually optimize the feature set
through a phased approach. The following is a
detailed algorithm description. Recursive Feature
Elimination (RFE) is an iterative feature selection
method that selects the most useful features for model
prediction by recursively training the model and
gradually eliminating the least important features. In
this project, one uses Random Forest as the base
model and use RFE to filter out 64 of the most
important features from the original feature set. This
step ensures that results are processing the filtered
important features in subsequent steps, reducing the
dimensionality and complexity of the data. After
feature selection, one applied K-Means clustering to
the selected features. K-Means clustering is an
unsupervised learning algorithm that divides features
into several clusters and groups similar features
together. One selected 5 clustering centres and
divided 64 features into 5 categories. The purpose of
clustering is to identify feature groups with similar
patterns or characteristics, in order to facilitate further
processing. Within each K-Means clustering group,
one further applied self-organizing maps (SOM) for
feature dimensionality reduction. SOM is an
unsupervised learning algorithm based on neural
networks that can map high-dimensional features to
low dimensional space while maintaining the
topological structure of the data. Through SOM, one
selected the most representative features within each
cluster group, further reducing the number of features
and retaining the most valuable information for model
prediction. The flowchart of the feature selection
method is shown in Figure. 4.
ECAI 2024 - International Conference on E-commerce and Artificial Intelligence
440
Figure 4: Feature selection flowchart (Photo/Picture credit:
Original).
2.3 Prediction Model
The CNN+LSTM+multi head attention model is a
powerful hybrid architecture designed specifically for
time series forecasting, particularly suitable for
applications such as stock price prediction. This
model combines the advantages of convolutional
neural networks (CNN), long short-term memory
networks (LSTM), and multi head attention
mechanisms, and can simultaneously capture local
and global dependencies in sequence data, thereby
improving prediction performance.
The CNN layer is responsible for extracting short-
term patterns from the input time series data by
applying convolutional filters. These filters help to
identify local trends and fluctuations, which are
critical for understanding immediate market
movements. The output from the CNN layer is then
passed to the LSTM layer, which is adept at capturing
long-term dependencies and temporal relationships.
LSTM networks are particularly effective in retaining
information across different time steps, allowing the
model to learn and predict future trends based on past
data.
Figure 5: Structure diagram of CNN+LSTM+SA model
(Photo/Picture credit: Original).
To further enhance the model's predictive power,
a Multi-Head Attention mechanism is incorporated.
This attention mechanism allows the model to
dynamically focus on different parts of the input
sequence, weighing the importance of various time
steps. By doing so, the model can prioritize the most
relevant information, improving the accuracy and
robustness of the predictions. Finally, the processed
information is passed through an output layer to
generate the final prediction, such as the likelihood of
a stock price increase or decrease. This combination
of CNN, LSTM, and Multi-Head Attention makes the
Stock Price Prediction Using Technical Indicators: A CNN+LSTM+Multi-Head Attention Approach
441
model highly effective in capturing the complexities
of financial time series data, leading to more accurate
and reliable forecasts. The schematic diagram is
illustrated in Figure. 5.
2.4 Model Evaluation
In this study, two main metrics were used to evaluate
the performance of the CNN+LSTM+multi head
attention model: confusion matrix and receiver
operating characteristic (ROC) curve. The confusion
matrix is a commonly used tool in classification tasks,
used to summarize the prediction results of the model
in detail. It generates a table by comparing the actual
results with the predicted results of the model, which
includes the following four key sections:
True Positive (TP): The number of samples
correctly predicted as positive.
True negatives (TN): The number of samples
correctly predicted as negative classes.
False Positive (FP): The number of negative
class samples incorrectly predicted as positive.
False negatives (FN): The number of positive
class samples incorrectly predicted as negative.
This metric helps in understanding not only the
accuracy of the model but also the types of errors it
tends to make.
The Receiver Operating Characteristic (ROC)
curve is a graphical representation that illustrates the
diagnostic ability of a binary classification model by
plotting the true positive rate (sensitivity) against the
false positive rate (1-specificity) at various threshold
settings. The ROC curve provides insight into how
well the model can distinguish between the two
classes across different decision thresholds. The Area
Under the Curve (AUC) is a single scalar value that
summarizes the overall performance of the model.
The AUC ranges from 0 to 1, with a value closer to 1
indicating better model performance. The AUC
provides a clear measure of the model’s ability to
classify outcomes correctly across all possible
thresholds.
3 RESULTS AND DISCUSSION
3.1 Feature Engineering
After performing Recursive Feature Elimination
(RFE), one used K-Means clustering to group the
features. The Elbow Method indicated that 5 clusters
were optimal, as the sum of squared errors (SSE)
began to flatten out at this point, balancing detail
retention with model complexity. Within each cluster,
the Self-Organizing Map (SOM) algorithm was
applied to project high-dimensional features into a
two-dimensional space, maintaining the topological
structure between features. On the SOM map, darker
colors indicated greater differences between features.
To select the most representative features, one
prioritized feature mapped to denser nodes, chose the
most central or relevant feature when multiple
features were mapped to the same node, and ensured
the total number of selected features was around 10.
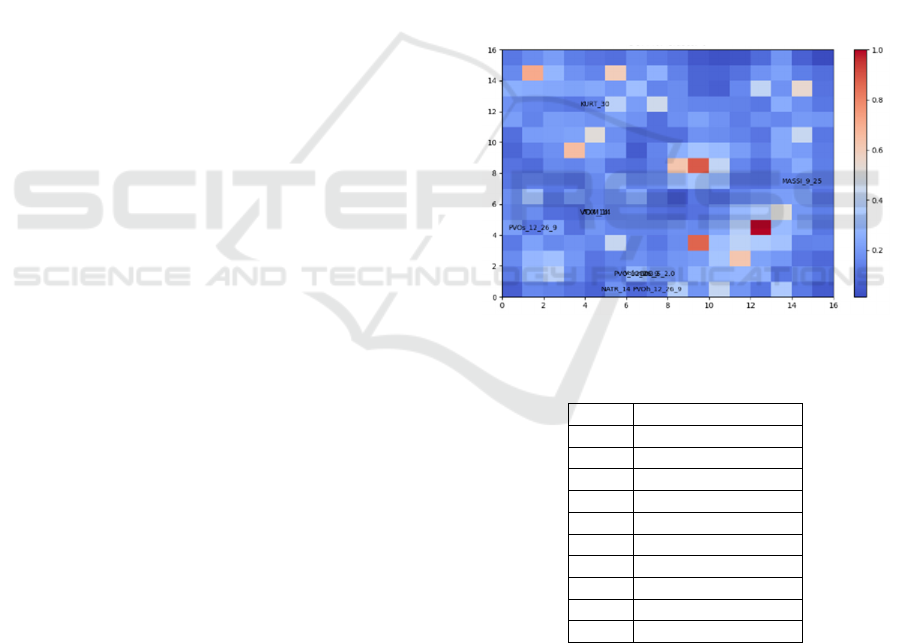
As shown in Figure. 6, the SOM distribution of the
features helped us in selecting the most appropriate
ones. This approach enabled us to select the 10 most
representative features, balancing model efficiency
with high predictive accuracy. In the end, this method
helped us select the 10 most representative features
from high-dimensional features, enabling the model
to run efficiently while maintaining high predictive
ability and accuracy. The Table 2 list the final
selected features.
Figure 6: Som map (Photo/Picture credit: Original).
Table 2: Optimal feature.
No. Features
1 Volume
2 ADX
_
14
3 BBB_5_2.0
4 KURT_30
5 MASSI_9_25
6 NATR
_
14
7 PVO
_
12
_
26
_
9
8 PVOh
_
12
_
26
_
9
9 PVOs_12_26_9
10 VTXM_14
In the correlation analysis, as shown in Figure. 7,
the correlation between PVO12_26_9 and
PVOs_112:26_9 exceeded 0.8. This high correlation
may introduce multicollinearity, which in turn affects
the interpretability and predictive performance of the
model. To avoid this issue, one chose to retain
PVO12_26_9 and remove PVOs_112:26_9,
ECAI 2024 - International Conference on E-commerce and Artificial Intelligence
442
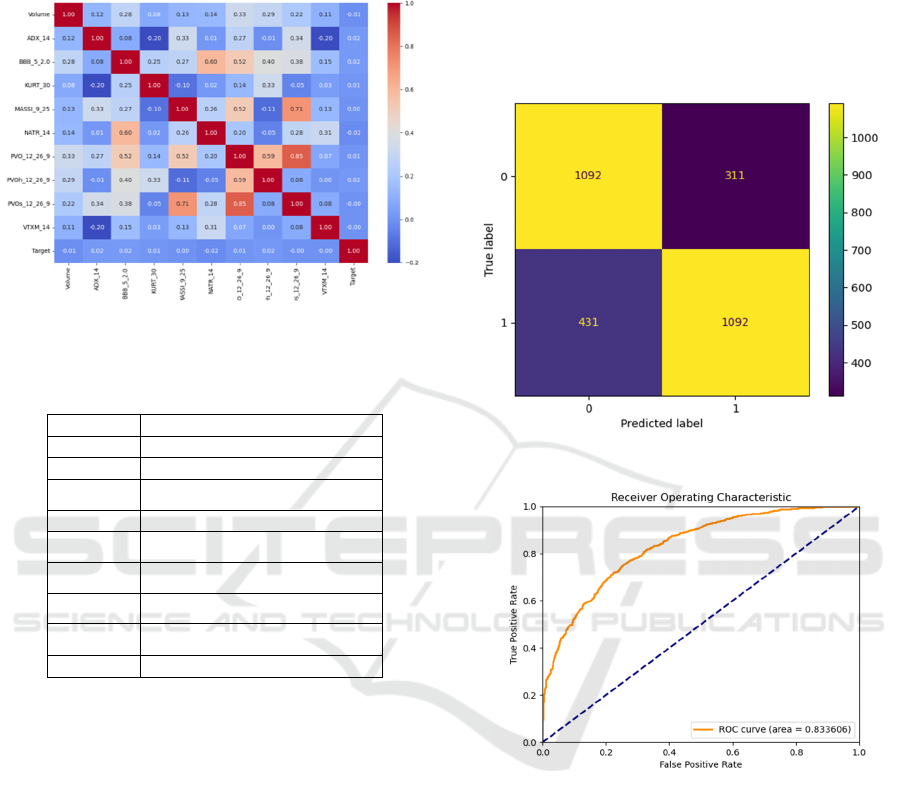
simplifying the model and improving its stability.
After exploratory data analysis, the selected features
are given in Table 3.
Figure 7: Correlation heat map (Photo/Picture credit:
Original).
Table 3 Optimal feature table.
No. Features
1 Volume
2 ADX
_
14
3 BBB_5_2.0
4 KURT_30
5 MASSI_9_25
6 NATR_14
7 PVO_12_26_9
8 PVOh_12_26_9
9 VTXM
_
14
3.2 Prediction Results
In the evaluation of the CNN+LSTM+Multi-Head
Attention model, the confusion matrix (as shown in
Figure. 8) shows that the model performs consistently
well in predicting both positive and negative classes.
Specifically, the model correctly predicted 1092 true
negatives and 1092 true positives, demonstrating its
strong capability to distinguish between upward and
downward trends. Although the model still
encountered some false positives (311) and false
negatives (431), its overall performance is robust.
The ROC curve (as depicted in Figure. 9) further
highlights the model's effectiveness, with the AUC
value reaching 0.833606. This indicates that the
CNN+LSTM+Multi-Head Attention model is highly
effective in processing time-series data and extracting
relevant features, enabling it to capture underlying
patterns in the data and improve classification
performance. In summary, the model demonstrates
high prediction accuracy and a low false positive rate,
making it a reliable choice for stock price prediction
tasks. The combination of CNN’s local feature
extraction, LSTM’s temporal dependency modelling,
and the Multi-Head Attention mechanism’s focused
feature selection ensures strong performance and
practicality in this application.
Figure 8: Confusion matrix (Photo/Picture credit: Original).
Figure 9: ROC plot of model (Photo/Picture credit:
Original).
3.3 Trading Strategy
This study has designed two trading strategies to test
the actual performance of the model predictions.
Trend following strategy is a trading method based on
price trends, aimed at trading by following the
direction of market trends. In this study, the LSTM
model and its variants were used to predict stock price
trends. Specifically, one determines the trading
behavior for the day based on the prediction results of
the previous day's model. If the model predicts that
the price will rise the next day, one holds or buys the
stock; if the model predicts that the price will fall the
next day, sell the stock at the market opening. This
Stock Price Prediction Using Technical Indicators: A CNN+LSTM+Multi-Head Attention Approach
443
strategy aims to generate profits by closely following
short-term market trends. The core idea of the trend
following strategy is to trade based on the predicted
results of stock price trends by the model. Firstly, this
study uses trained LSTM and its variant models to
predict the daily rise or fall of stock prices. If the
previous day's forecast result is an increase (1), then
buy or hold the stock at the opening of the day; if the
previous day's forecast result is a decline (0), sell or
maintain a short position at the opening of the day.
The daily earnings are calculated by the difference
between the closing price of the current day and the
previous day's closing price, while the cumulative
earnings are the sum of daily earnings. The results are
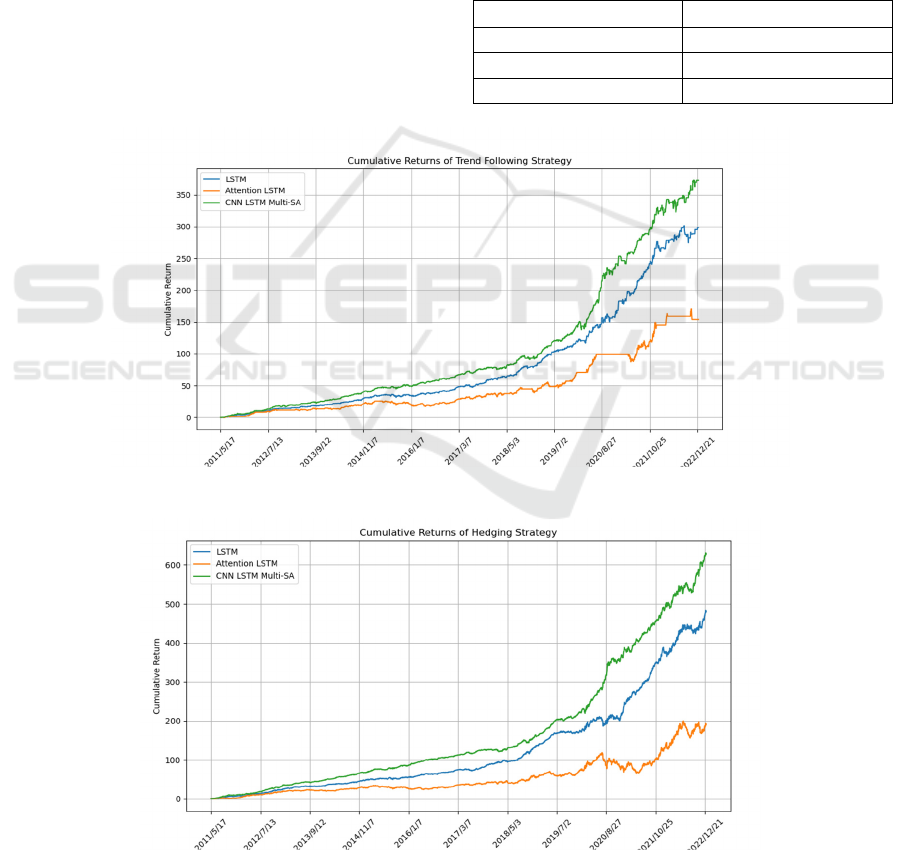
shown in the Table 4 and Figure. 10.
There are significant differences in the
performance of the three different models in the
cumulative return curve of Strategy 1, as shown in
Figure. 10. The cumulative returns of the ordinary
LSTM and CNN+LSTM+Multi-Head Attention
models showed a stable upward trend throughout the
back testing period, with the CNN+LSTM+Multi-
Head Attention model performing particularly well,
achieving the highest cumulative return. This
indicates its strong ability to capture market trends.
The ordinary LSTM model comes second, with
relatively robust performance. The LSTM+self-
attention mechanism model's performance is slightly
inferior; although it showed good revenue growth in
the early stage, there were fluctuations and declines
in revenue performance in the later stage. Overall, the
CNN+LSTM+Multi-Head Attention model performs
Table 4: Cumulative income statement of trend strategy.
Model Cumulative rate of return
LSTM 298.68%
LSTM+SA 153.81%
LSTM+CNN+ Multi-SA 372.77%
Figure 10: Comparison chart of cumulative returns of trend strategy (Photo/Picture credit: Original).
Figure 11: Comparison chart of cumulative returns of long and short strategies (Photo/Picture credit: Original).
ECAI 2024 - International Conference on E-commerce and Artificial Intelligence
444

the best in trend following strategies, demonstrating
its superiority in complex market environments.
The long-short strategy is a two-way trading
strategy that allows for long positions (buying stocks)
when the market rises and short positions (selling
stocks or holding reverse positions) when the market
falls, thereby gaining potential returns across
different market trends. In this study, the LSTM
model and its variants were used to predict the daily
rise and fall of stock prices, and corresponding long
or short operations were carried out based on the
prediction results. Strategy 2 adopts a long-short
approach, conducting daily trades based on the
model's predicted results. When the model predicts
that the stock price will rise the next day, the stock is
bought at the opening of the day and held until the
closing. Conversely, when the model predicts that the
price will fall the next day, the stock is shorted at the
opening and the position is closed at the end of the
day. The daily profit is calculated based on the
position: for long positions, the profit is the closing
price minus the opening price; for short positions, the
profit is the opening price minus the closing price.
Finally, by accumulating daily returns, the
cumulative rate of return for the strategy is calculated
to evaluate its performance in the market. The results
are shown in the Table 5 and Figure. 11.
Table 5: Accumulated income statement of long short
strategy.
Model Cumulative rate of return
LSTM 479.10%
LSTM+SA 189.36%
LSTM+CNN+Multi-SA 627.28%
The results showed that all models significantly
improved their cumulative returns under this strategy,
with the CNN+LSTM+Multi-Head Attention model
achieving notably better cumulative returns than the
other models. As shown in Figure. 11, throughout the
entire trading period, the revenue growth of the
CNN+LSTM+Multi-Head Attention model remained
relatively stable, demonstrating strong growth
momentum, particularly in the later stages. Compared
to Strategy 1, Strategy 2 takes advantage of market
volatility by going long when predicting an uptrend
and short when predicting a downtrend, thereby
enhancing trading flexibility and potential returns.
This approach allows the model to capitalize on profit
opportunities under varying market conditions.
However, the performance of the LSTM with self-
attention mechanism remains relatively weaker,
suggesting that the self-attention mechanism may
require further refinement to better capture trend
signals. Overall, Strategy 2 outperforms Strategy 1 in
terms of revenue performance, particularly when
employing the CNN+LSTM+Multi-Head Attention
model. This model exhibits more stable and robust
revenue growth, making it especially suitable for
markets with high volatility.
3.4 Comparison and Implications
The comparison of the cumulative returns from the
different models demonstrates distinct variations in
performance. The CNN+LSTM+Multi-Head
Attention model outperformed the other models,
showing the highest cumulative returns across both
trend-following and long-short strategies. This
model's ability to capture both local and global
dependencies in the data through convolutional layers,
LSTM layers, and the multi-head attention
mechanism allowed it to adapt more effectively to
market conditions, leading to superior predictive
accuracy and trading outcomes.
The ordinary LSTM model also performed well,
but it lacked the robustness of the
CNN+LSTM+Multi-Head Attention model,
especially in more volatile market environments. The
inclusion of CNN and multi-head attention in the
latter model provided additional layers of insight,
enabling it to better recognize and act on subtle
market signals that the LSTM alone might miss.
The implications of these findings suggest that
hybrid models like CNN+LSTM+Multi-Head
Attention, which combine different neural network
architectures, offer significant advantages in financial
time-series forecasting. By integrating convolutional
layers, which excel at capturing spatial patterns, with
LSTM layers for temporal dependencies and multi-
head attention for enhanced feature selection, this
model demonstrates a comprehensive approach to
understanding and predicting market behavior. As
financial markets continue to grow in complexity, the
use of such advanced models will likely become more
prevalent, offering more accurate tools for traders and
investors.
3.5 Limitations and Prospects
While the CNN+LSTM+Multi-Head Attention
model has demonstrated strong performance, there
are inherent limitations to this study that must be
acknowledged. First, the model's effectiveness is
contingent on the quality and breadth of the input data.
Any bias or gaps in the data could affect the model's
predictions, potentially leading to suboptimal trading
decisions. Additionally, the model is trained on
Stock Price Prediction Using Technical Indicators: A CNN+LSTM+Multi-Head Attention Approach
445

historical data, which may not fully capture future
market conditions, especially during unprecedented
events or structural changes in the market.
Looking ahead to the future, there are several
research directions worth further exploration in
response to these challenges. Firstly, by further
optimizing the attention mechanism, the model's
ability to capture market signals can be enhanced. In
addition, considering integrating alternative data
sources such as sentiment analysis data extracted
from news reports or social media will provide richer
background information for the model's predictions.
Finally, extending the model to more asset classes or
operating across multiple markets not only helps
improve its robustness, but also enhances its
applicability under different market conditions.
4 CONCLUSIONS
To sum up, this study evaluated the effectiveness of
CNN+LSTM+Multi-Head Attention model in stock
price prediction and trading strategy execution. The
research results indicate that the hybrid model
significantly outperforms traditional simple models
in terms of cumulative returns, especially in situations
of high market volatility. By integrating multiple
neural network architectures, this model is able to
effectively capture complex patterns in financial data,
providing traders with powerful support tools.
However, the study also exposed some limitations,
e.g., dependence on historical data and high
computational complexity of the model. Future
research should focus on further optimizing the model
structure and exploring more data sources to enhance
the predictive ability of the model. Overall, the
CNN+LSTM+Multi-Head Attention model
demonstrates broad application prospects in the field
of financial forecasting, with the potential to improve
trading strategies and decision-making processes in
complex market environments.
REFERENCES
Bollerslev, T., 1986. Generalized autoregressive
conditional heteroskedasticity. Journal of econometrics,
31(3), 307-327.
Fischer, T. Krauss, C., 2018. Deep learning with long short-
term memory networks for financial market predictions.
European journal of operational research, 270(2), 654-
669.
Graves, A., 2012. Long short-term memory. Supervised
sequence labelling with recurrent neural networks, 37-
45.
Greff, K., Srivastava, R. K., Koutník, J., Steunebrink, B. R.
Schmidhuber, J., 2016. LSTM: A search space odyssey.
IEEE transactions on neural networks and learning
systems, 28(10), 2222-2232.
Jialin, L., Shanwen, Q., Zhikai, Z., Keyao, L., Jiayong, M.
Toe, T. T., 2022, July. CNN-LSTM Model Stock
Forecasting Based on an Integrated Attention
Mechanism. 2022 3rd International Conference on
Pattern Recognition and Machine Learning (PRML) pp.
403-408.
Kim, T. Kim, H. Y., 2019. Forecasting stock prices with a
feature fusion LSTM-CNN model using different
representations of the same data. PloS one, 14(2),
e0212320.
Li, C., Zhang, X., Qaosar, M., Ahmed, S., Alam, K. M. R.
Morimoto, Y., 2019. Multi-factor based stock price
prediction using hybrid neural networks with attention
mechanism. 2019 IEEE intl conf on dependable,
autonomic and secure computing, intl conf on pervasive
intelligence and computing, intl conf on cloud and big
data computing, intl conf on cyber science and
technology congress
(DASC/PiCom/CBDCom/CyberSciTech), 961-966.
Sezer, O. B., Gudelek, M. U. Ozbayoglu, A. M., 2020.
Financial time series forecasting with deep learning: A
systematic literature review: 2005–2019. Applied soft
computing, 90, 106181.
Siami-Namini, S., Tavakoli, N. Namin, A. S., 2018,
December. A comparison of ARIMA and LSTM in
forecasting time series. 2018 17th IEEE international
conference on machine learning and applications
(ICMLA), 1394-1401.
Thakkar, A. Chaudhari, K., 2021. A comprehensive survey
on deep neural networks for stock market: The need,
challenges, and future directions. Expert Systems with
Applications, 177, 114800.
Vaswani, A., 2017. Attention is all you need. Advances in
Neural Information Processing Systems, 1
Zhang, J., Ye, L. Lai, Y., 2023. Stock price prediction using
CNN-BiLSTM-Attention model. Mathematics, 11(9),
1985.
ECAI 2024 - International Conference on E-commerce and Artificial Intelligence
446
