
Research on Machine Learning Models for Predicting Player Churn
Lilin Peng
a
Brunel College London, North China University of Technology, No. 5 Jinyuanzhuang Road,
Shijingshan District, Beijing, China
Keywords: Churn Prediction, Player Behaviors, Game Analytics, Machine Learning.
Abstract: In recent years, with the rapid development of the gaming industry, predicting player churn to improve game
retention has become a key research area. This review summarizes the main research achievements and
methods in the field of player churn prediction in recent years. By analyzing various machine learning
algorithms such as random forest, decision tree, and logistic regression, the performance of these models in
processing player behavior data and improving prediction accuracy is summarized. These studies demonstrate
the effectiveness of data-driven methods in predicting player behavior, particularly when using long-term data
frames, resulting in significantly improved prediction accuracy. In addition, it also indicates that incorporating
personalized behavior and social relationships of players in the prediction model can enhance the accuracy of
the model. In addition, this article explores the potential applications of cutting-edge methods such as multi-
source data fusion, real-time prediction and intervention, and long-term behavior analysis. The review
concludes that future research should continue to focus on algorithm optimization and the application of
emerging technologies to further improve the accuracy and adaptability of player churn prediction models,
providing a scientific basis for game developers to develop more effective user retention strategies.
1 INTRODUCTION
User churn refers to the group of users who have
previously visited or registered on a website, but have
gradually lost interest in the website and left it,
ultimately leaving the website completely.
Cheng Wang et al. proposed a planar fusion deep
learning model based on domain ranking, namely
Fully Connected Layered Convolutional Neural
Network-Long Short-Term Memory (FCLCNN-
LSTM), for assessing the risk of customer churn in
the telecommunication industry (Wang et al., 2024).
The model incorporates a majority least absolute
shrinkage and selection operator (Maj-LASSO)
algorithm for feature selection under unbalanced data
conditions, addressing feature importance through a
fully connected layer with several Rectified Linear
Unit (ReLU) neurons. By combining a 2D
convolutional neural network for spatial feature
extraction and an LSTM model for temporal
information, the FCLCNN-LSTM model enhances
classification accuracy and generalizability. It was
tested on three public datasets, outperforming
a
https://orcid.org/0009-0004-3597-0530
traditional models such as Logistic Regression,
Support Vector Machine, and Random Forest, with an
accuracy improvement of 3.43% and an area under
the curve (AUC) increase of 4.84%. This approach
provides a robust decision-making tool for
identifying potential churners in the
telecommunications sector.
Player churn prediction is crucial in the gaming
sector. Since the cost of attracting new players is
much higher than retaining existing players,
predicting when players are likely to churn and taking
preventive measures can help gaming companies
enhance player retention, thereby increasing revenue.
It is an important strategy for boosting profitability
and carries commercial value in improving player
retention rates. This article summarizes experimental
results from multiple research papers, comparing the
performance of different models in player churn
prediction and proposing directions for future
research.
Player churn refers to the phenomenon where
players stop using a game. Player behavior data
includes factors such as playtime, purchase history,
and social interactions. The goal of player churn
112
Peng, L.
Research on Machine Learning Models for Predicting Player Churn.
DOI: 10.5220/0013234700004558
In Proceedings of the 1st International Conference on Modern Logistics and Supply Chain Management (MLSCM 2024), pages 112-121
ISBN: 978-989-758-738-2
Copyright © 2025 by Paper published under CC license (CC BY-NC-ND 4.0)

prediction is to identify which players are likely to
stop playing the game within a short period. These
studies primarily focus on utilizing machine learning
models to analyze player behavior data to predict
future behavior.
Existing research indicates that different types of
games and player behavior patterns significantly
impact prediction results.
Mao Ping Ting and Cho Dong Min examine user
dissatisfaction with serious games about Chinese
cultural heritage and attribute it to problems with
game quality and lack of long-term feedback from
users (Ting and Min, 2024). The study identifies two
primary quality dimensions—online gaming factors
and intrinsic serious game factors—using the
theoretical framework of Stimulus-Organism-
Response (SOR) in combination with the Technology
Acceptance Model (TAM). Through analysis of 534
valid responses, the research highlights that
educational objectives, entertainment experience,
quality of the system, and game design significantly
affect how users perceive the usefulness and ease of
use, which in turn impact user churn. The study
emphasizes the critical role of learning objectives and
entertainment experience in reducing churn, offering
practical insights for enhancing game design and user
retention.
Jiao Wang used the COX proportional hazards
model to predict the churn of online game players in
Company A (Wang, 2018). Research has found that
Company A has problems in player churn
management, such as insufficient reference indicators,
a single way to maintain player stability, and a lack of
retention evaluation. To this end, the paper selected
13 variables from three aspects: performance, player
activity, and time interval characteristics, and
screened these variables using the forward LR
method to construct a COX proportional hazards
model. The final research results indicate that 10
variables, including level, combat effectiveness, and
total online time, are closely related to player churn.
Based on the Recency, Frequency, Monetary Model
(RFM) model combined with the coefficient of
variation method, a comprehensive evaluation of
players was conducted, and the first and third types of
players were identified as key retention targets.
Minghan Tu explored the reasons behind mobile
game player churn and the impact of gender
differences by constructing a user churn conceptual
model based on the SOR model, combined with the
Expectation Confirmation Model (ECM) and the
Perceived Entertainment Theory (Tu, 2020). In this
model, external stimuli (S) are divided into two parts:
game factors and social factors. The organism (O)
includes perceived entertainment, expectation
confirmation, perceived usefulness, and satisfaction.
The response (R) is user churn. The research results
indicate that game factors have a significant impact
on perceived entertainment, expectation confirmation,
and user churn, making them a key focus for
companies. Although social factors do not have a
substantial effect on user churn, they do significantly
affect satisfaction. The study also discovered that
gender differences influence the connection between
game elements and user churn, providing companies
with more precise strategies for mobile game product
development.
Wei Zhang developed a player churn prediction
model based on analyzing nearly 200,000 pieces of
user behavior data (Zhang, 2021). The study first
preprocessed the dataset and used regression models
to fill in missing values. Players were then
categorized into two groups—normal and churned—
based on a customized login time interval. Nine
feature variables were selected for modeling based on
variable correlation and importance. The dataset was
split into training and testing sets with a 70:30 ratio,
and decision tree, random forest, and neural network
models were built. The parameters of each model
were repeatedly adjusted to achieve optimal
prediction performance. The results showed that the
recall rates of individual models could be further
improved. Finally, the study attempted to linearly
combine the individual models and customized the
threshold for binary classification, which enhanced
the sensitivity in predicting churned users. The
findings indicate that the combined model effectively
improves the recall rate and is suitable as the final
prediction model.
2 METHODOLOGIES
2.1 Dataset Collection and
Preprocessing
The dataset is typically sourced from the server logs
of game companies, containing player behavior data
such as gameplay time, login frequency, session
duration, and more. Data preprocessing includes
managing absent values, addressing outliers, and
normalizing the data. Additionally, it is necessary to
define the observation period and behavioral metrics
to facilitate model training and evaluation.
In this study, the experimental data is derived
from multiple research papers. The specific dataset
introduction is shown in Table 1.
Research on Machine Learning Models for Predicting Player Churn
113

Table 1: Dataset.
Literature name Dataset
Early churn prediction
with personalized targeting
in mobile social games
(Milošević et al., 2017)
Using data from two
million players of the
game "Top Eleven -
Become a Football
Manager".
Modelling Early User-
Game Interactions for
Joint Estimation of
Survival Time and Churn
Probability (Bonometti et
al., 2019)
Using data from six
different games from
Square Enix Limited:
Hitman Go (hmg),
Hitman Sniper (hms), Just
Cause 3 (jc3), Just Cause
4 (jc4), Life is Strange
(lis), and Life is Strange:
Before the Storm (lisbf).
The dataset contains
information on Churners
and Non-Churners in each
game, with 80000
Churners and 80000 Non-
Churners for each game.
The observation period of
data is defined as the
number of game sessions
that users have from their
first interaction to
reaching a specific cutoff
p
oint.
Exploiting limited players’
behavioral data to predict
churn in gamification
(Loria & Marconi, 2021)
Use data from gamified
applications (Play&Go)
and casual online F2P
games (TagPro).
Match experiences affect
interest: Impacts of
matchmaking and
performance on churn in a
competitive game (Kang et
al., 2024)
Based on data from the
multiplayer online
competitive game
'Everyone's Marble',
using game logs covering
42 days and game data
from over 260000
players, including records
of over 6 million matches
in total.
Predicting subscription
renewal using binary
classification in World of
Warcraft (Hossain et al.,
2023)
Using a dataset called
"Warcraft Avatar History
(WoWAH)" that includes
records from January
2006 to January 2009.
The dataset includes
player data recorded
ever
y
10 minutes.
2.2 Feature Extraction and Selection
Feature extraction is a critical step in churn
prediction. Commonly used features include
gameplay time, session frequency, win rate, and
activity index. Feature selection is performed using
methods like Principal Component Analysis (PCA) or
Recursive Feature Elimination (RFE) to identify the
most predictive features.
The study "Match experiences affect interest:
Impacts of matchmaking and performance on churn
in a competitive game" (Kang et al., 2024) defined
variables related to matchmaking experience and
player performance, including average skill gap, skill
gap variance, win rate, winning streak rate, and losing
streak rate. By extracting and selecting these features,
the impact of match experience on churn was
analyzed.
2.3 Basic Model Introduction
Model training uses various machine learning
algorithms for churn prediction. Common evaluation
metrics include Accuracy, AUC, F1 Score, etc.
Firstly, this article will introduce several basic
machine learning models.
2.3.1 Logistic Regression (LR)
Logistic regression is a fundamental but effective
binary classification model commonly used for churn
prediction. Its advantages lie in the simplicity of the
model, ease of explanation, and good performance in
many application scenarios. However, logistic
regression cannot capture the complex nonlinear
relationships between features, which limits its
performance on complex datasets.
2.3.2 Decision Tree (DT) and Random
Forest (RF)
Decision Tree is a tree-structured model that predicts
outcomes by iteratively dividing the dataset into
smaller subsets. It is easy to understand and interpret,
capable of handling various data types, and is suitable
for scenarios that require strong interpretability and
do not have strict requirements on data distribution.
Random forests improve prediction performance and
robustness by constructing multiple decision trees
and averaging them.
Decision trees and random forests are two
methods that work well with complex data and
capture nonlinear relationships between features.
2.3.3 Gradient Boosting (GB)
Gradient boosting is a method of boosting that
gradually reduces prediction errors by constructing
multiple weak learners (such as decision trees). Its
advantage is high precision, which can capture
complex data patterns and is suitable for handling
MLSCM 2024 - International Conference on Modern Logistics and Supply Chain Management
114

nonlinear relationships. Suitable for scenarios that
require high prediction accuracy and can accept
longer training times.
2.3.4 Naive Bayes (NB)
Naive Bayes is a straightforward probabilistic
classifier grounded in Bayes' theorem, assuming that
features are independent of each other. Its advantages
include fast computation and good performance on
small datasets. It is suitable for scenarios where
feature independence is relatively strong.
2.3.5 ElasticNet (EN)
This model combines the advantages of ridge
regression and LASSO regression, and controls the
model complexity through two regularization
parameters. The effect of handling multicollinearity
problems is significant and suitable for high-
dimensional data. Suitable for scenarios where both
variable selection and model interpretability need to
be considered simultaneously.
2.3.6 The Multilayer Perceptron
It is a basic neural network structure suitable for
dealing with nonlinear relationships.
MLPr (Multilayer Perceptron Regressor) is a
neural network regression model that uses a multi-
layer perceptron (MLP) to achieve nonlinear
mapping.
MLPc (Multilayer Perceptron Classifier) is a
neural network classification model that uses a MLP
to achieve nonlinear classification.
Both methods are capable of handling complex
nonlinear relationships and are suitable for large-
scale datasets. And it is suitable for scenarios that
require high classification accuracy and large
amounts of data.
These models predict the probability of a player's
loss by analyzing historical behavior data.
3 EXPERIMENTAL ANALYSIS
AND DISCUSSION
3.1 Interpretation of evaluation
indicators
Table 2 shows the various evaluation indicators and
their corresponding meanings.
Table 2: Interpretation of evaluation indicators.
Evaluation In
d
icators Inter
p
retation
SMAPE (Symmetric
average absolute
percentage error)
Indicates the disparity
between the model's predicted
value and the actual value.
The lower the value, the better
the model performs in
estimating survival time.
F1 Score It represents the harmonic
mean of precision and recall.
The higher the value, the
better the model performs in
estimatin
g
churn
p
robabilit
y
.
AUC Reflects the overall
effectiveness of the model in
classification tasks.
A higher value signifies better
classification
p
erformance.
Precision The percentage of samples
predicted as positive by the
model that are genuinely
p
ositive.
Recall The proportion of actual
positive examples that are
correctly identified as
p
ositive.
3.2 Multiple Machine Learning
Algorithms
3.2.1 Literature Review
Miloš Milošević et al. proposed a method for
predicting early customer churn in mobile social
games and preventing it using personalized push
notifications (Milošević et al, 2017). The system
consists of two stages: churn prediction (framed as a
binary classification task) and churn prevention
through personalized push notifications. The study
utilized data from the game "Top Eleven - Be a
Football Manager," involving two million players,
and trained several models, including LR, DT, RF,
NB, and GB.
The models used the player's first-day behavior
data to predict churn, with churn defined as a player
not returning to the game within 14 days of their last
activity. The study sent personalized push
notifications to predicted churn users based on their
most interacted game features and sent notifications
encouraging users to explore core game features they
had not yet interacted with. Among the tested models,
Gradient Boosting performed the best. The
personalized notifications were shown to effectively
reduce churn by up to 28%.
Research on Machine Learning Models for Predicting Player Churn
115
3.2.2 Model Performance
Below is the performance of models across different
evaluation metrics (AUC, Precision, Recall, F1
Score).
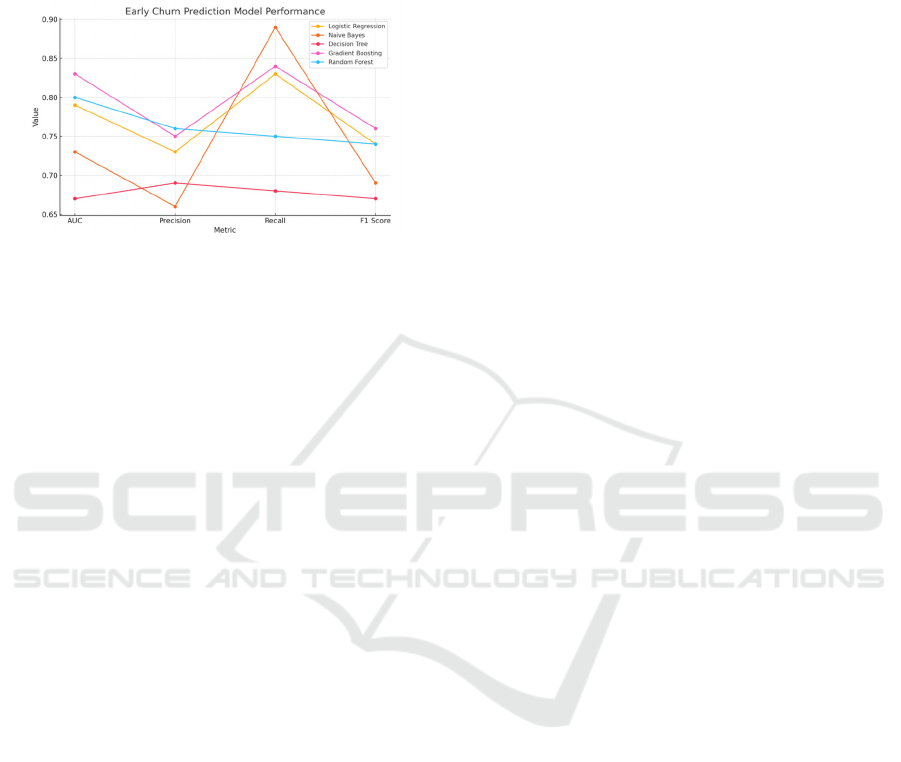
Figure 1: Model Performance. (Photo/Picture credit:
Original).
According to Figure 1, observing the AUC
metrics of each model, it was found that the Gradient
Boosting algorithm had the highest AUC, reaching
0.83, indicating its overall predictive ability was the
best. The Random Forest algorithm follows closely
behind with an AUC of 0.80. The AUC of logistic
regression is 0.79, which also performs well. The
AUC of Naive Bayes and Decision Tree are relatively
low, at 0.73 and 0.67, respectively.
Observing the accuracy index, it is found that the
random forest algorithm outperformed the others in
terms of accuracy, reaching 0.76. The accuracy of
gradient boosting algorithm and logistic regression is
also relatively high, at 0.75 and 0.73, respectively.
Naive Bayes has the lowest accuracy, at 0.66.
Observing the recall index, it was found that Naive
Bayes performed outstandingly in recall, reaching
0.89, indicating its effectiveness in identifying lost
users. The recall rates of gradient boosting algorithm
and logistic regression are 0.84 and 0.83, respectively,
which also perform well. The recall rate of the
decision tree is the lowest, at 0.68.
Observing the F1 Score indicator, it is discovered
that the gradient boosting algorithm achieved the
highest, reaching 0.76, indicating its best
performance in balancing accuracy and recall. The F1
scores of random forest and logistic regression are
relatively close, at 0.74 and 0.74, respectively. Naive
Bayes has a low F1 score of 0.69, although it has a
high recall rate, its accuracy is low.
3.2.3 Summary
In summary, the Gradient Boosting algorithm
performs very well on all metrics, especially in AUC
and F1 scores, indicating that it is most effective in
churn prediction. Random Forest algorithm also
performs strongly, especially in terms of accuracy,
but its recall rate is slightly lower than that of gradient
boosting algorithm. Logistic regression performs well
overall and is a simple and effective choice. Naive
Bayes performs well in recall, but due to its low
accuracy, its overall F1 score is not high. Decision
trees perform relatively poorly on all metrics and may
not be suitable for this type of churn prediction task.
Therefore, it is recommended to use gradient boosting
algorithm or random forest algorithm for churn
prediction, as they perform the best in balancing
accuracy and recall.
3.3 Bifurcating Model
3.3.1 Literature Review
Bonometti et al. conducted three experiments to
model early user interactions in games for joint
estimation of survival time and churn probability
(Bonometti et al. 2019). The study compared various
models, including EN, MLPr, LR, and MLPc, across
different datasets.
Experiment One focused on evaluating the
performance of EN and MLPr in estimating survival
time, and LR and MLPc in predicting churn
probability. The results indicated that MLPr
outperformed EN in survival time estimation, while
MLPc surpassed LR in churn prediction.
Experiment Two expanded the dataset to include
all data points, rather than summary statistics, to test
model performance. The unfolded data slightly
improved survival time estimation, particularly with
the MLPr model, and enhanced the performance of
the MLPc model in churn prediction.
Experiment Three introduced a newly proposed
Bifurcation Model (BM) using the unfolded data. BM
outperformed the other models in both survival time
and churn probability estimation, showing superior
SMAPE values for survival time and F1 scores for
churn prediction.
These findings suggest that incorporating early
user interaction metrics and explicit time structures,
such as those used in LSTM models, can significantly
improve the accuracy and reliability of predicting
future player engagement and churn.
3.3.2 Model Comparison
This paper collates the experimental data in this study
and generates the corresponding summary chart.
MLSCM 2024 - International Conference on Modern Logistics and Supply Chain Management
116
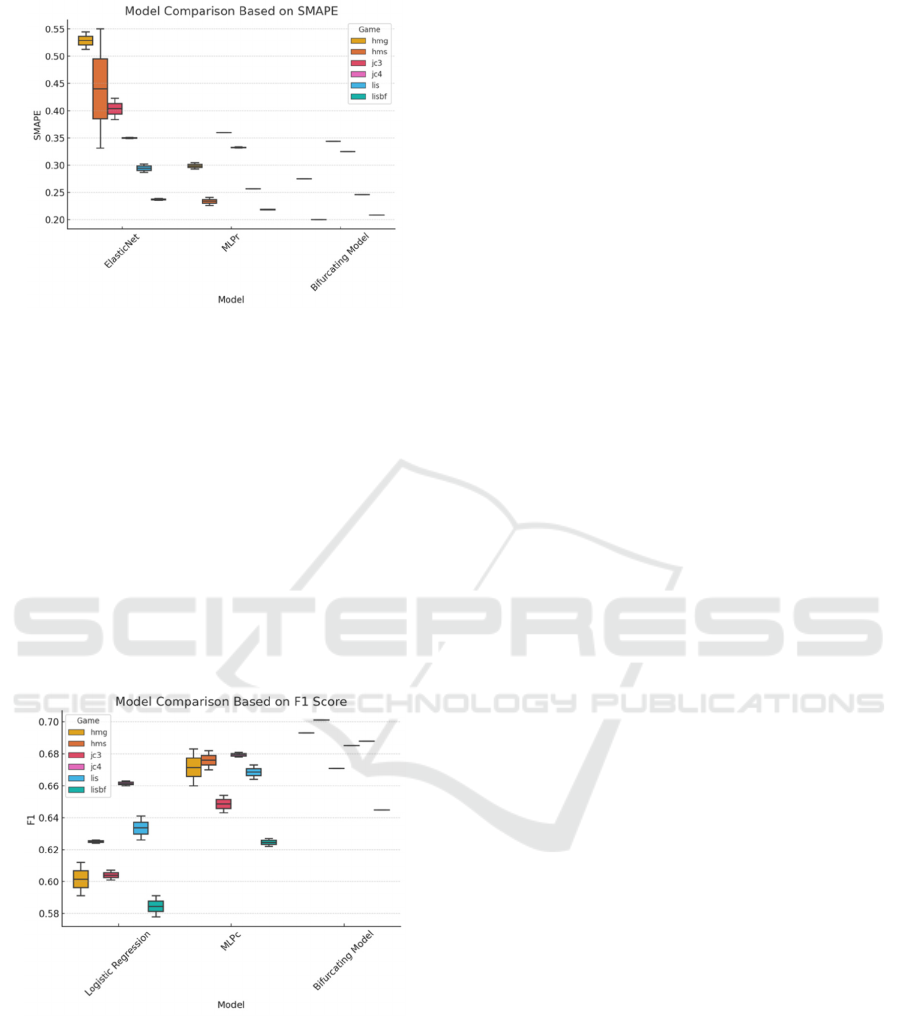
Figure 2: Based on SMAPE. (Photo/Picture credit:
Original).
Figure 2 shows the performance of three
models—ElasticNet, MLPr, and the Bifurcating
Model—across different games. The figure indicates
that the Bifurcating Model exhibits the most stable
performance across all games and has the lowest
SMAPE (Symmetric Mean Absolute Percentage
Error), meaning it has the smallest prediction error.
The ElasticNet model generally performs worse than
the other two models in most games, with particularly
high variability in the hms game. The MLPr model
shows significant improvement over ElasticNet, but
its performance in some games, such as jc3 and lis, is
slightly inferior to that of the Bifurcating Model.
Figure 3: Based on F1 Score. (Photo/Picture credit:
Original).
Figure 3 displays the performance of Logistic
Regression, MLPc, and the Bifurcating Model across
different games. The Bifurcating Model consistently
achieves high F1 Scores in all games, demonstrating
its stability and accuracy in predicting player churn.
Logistic Regression shows significant variability in
performance across different games, with notably low
F1 Scores in the hmg and lisbf games, indicating poor
predictive accuracy. The MLPc model outperforms
Logistic Regression, especially in the hms and jc3
games, but still does not match the performance of the
Bifurcating Model in all games.
3.3.3 Summary
By comparing the SMAPE and F1 values across
different games, it is clear that the Bifurcating Model
excels in both estimating survival time and predicting
churn probability. In contrast, the ElasticNet and
Logistic Regression models perform relatively
poorly, particularly when faced with different game
types, showing instability. The MLP models perform
well in some cases but are generally outperformed by
the Bifurcating Model.
3.4 Random Forest
3.4.1 Literature review
Enrica Loria and Annapaola Marconi used data from
gamification applications (Play&Go) and casual
online F2P games (TagPro) (Loria & Marconi, 2021).
A random forest model was trained on gamified
application data and validated on F2P game data,
testing different sampling methods to select player
records for training the model. And participation
features such as frequency of use, game actions, and
integration were used to analyze the original form and
embedded performance impact values of these
features. The research results indicate that these
features can be effectively used for churn prediction,
and through the visualization and interpretation of the
tree, it was found that the time invested by players in
the game is directly proportional to their likelihood of
churn. Game time and usage frequency have been
found to be significant predictors of churn.
3.4.2 Model Performances
The following is the performance of various
selections across different evaluation metrics (MSE:
Mean Squared Error, RMSE: Root Mean Squared
Error, MAE:
Mean Absolute Error, R2: R-Squared).
Research on Machine Learning Models for Predicting Player Churn
117
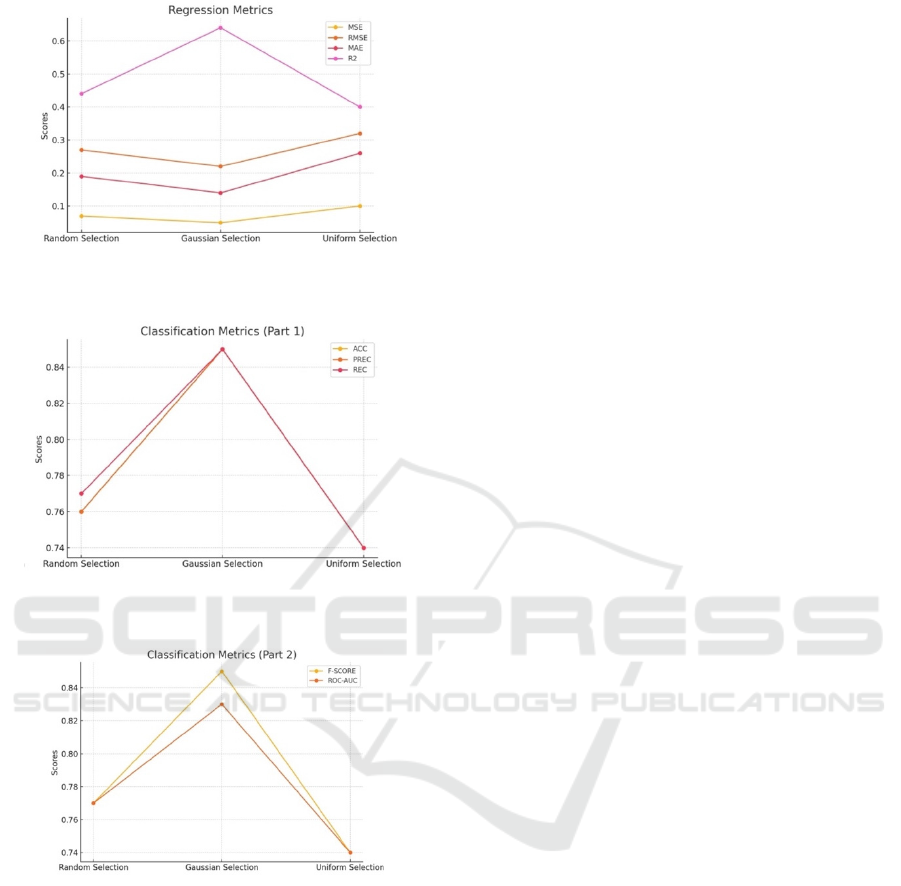
Figure 4: Regression Metrics. (Photo/Picture credit :
Original).
Figure 5: Classification Metrics (Part 1). (Photo/Picture
credit : Original)
Figure 6: Classification Metrics (Part 2). (Photo/Picture
credit: Original).
Upon observing Figure 4, it is evident that the
Gaussian Selection method performs the best across
all regression metrics (MSE, RMSE, MAE, and R2),
indicating its superior ability in predicting churn time.
In contrast, the performance of Random Selection and
Uniform Selection is relatively similar, but Gaussian
Selection significantly outperforms both of these
methods.
Looking at Figures 5 and 6, it becomes clear that
Gaussian Selection also excels in classification
metrics (Accuracy, Precision, Recall, and F1 Score).
Additionally, the classification Receiver Operating
Characteristic Curve-Area Under the Curve (ROC-
AUC) for Gaussian Selection is higher than that of the
other methods, highlighting its strong discriminative
power in classification tasks.
3.4.3 Summary
In summary, the Gaussian Selection method shows
optimal performance across most metrics,
particularly in terms of accuracy and precision in both
regression and classification tasks. While the Random
Selection method also performs well, it is slightly
inferior to Gaussian Selection. The Uniform Selection
method, however, performs the worst across all
metrics, making it less suitable as a selection method
for churn prediction.
3.5 Matching algorithm
3.5.1 Literature Review
Hyunjae Kang et al. conducted a comprehensive
analysis of the relationship between players' matching
experience and churn in the competitive game
"Everyone's Marble" by utilizing a fixed effects
model (Kang et al., 2024). Analyzing match records
from over 260,000 players across 42 days,
encompassing more than 6 million matches, the study
explored how matching mechanisms, competition
outcomes, and player performance influence churn.
The study found that matching with stronger
opponents increases the likelihood of churn, while
matching with weaker opponents reduces it.
Significant differences in opponent skill levels were
shown to positively impact churn, whereas frequent
and consecutive victories were found to reduce
attrition. Additionally, the study highlighted that
consecutive defeats have varying effects on churn
depending on the player's skill level.
These findings offer both theoretical insights and
practical implications for understanding user churn in
competitive games and provide valuable guidance for
game developers aiming to enhance user retention.
3.5.2 Algorithms Impacts
The following are the impacts of different matching
algorithms and performance metrics on player churn.
Matchmaking Algorithm A refers to the Elo
Rating System. The Elo Rating System is a classic
probabilistic model used for matching players based
on their skill levels. In the literature, the Elo Rating
System is employed to improve matchmaking quality,
allowing players to compete against others with
similar skill levels.
MLSCM 2024 - International Conference on Modern Logistics and Supply Chain Management
118

Figure 7: Impacts of matching algorithms. (Photo/Picture
credit : Original).
Matchmaking Algorithm B refers to the TrueSkill
System. TrueSkill is an improvement over the Elo
Rating System, enhancing he precision and flexibility
of skill ratings, with the goal of providing a fairer
matchmaking experience for players.
Performance Metric A refers to Win Rate. Win
Rate represents the percentage of games a player wins
over a certain period and is a key indicator of player
performance. The literature suggests that a higher
Win Rate can reduce player churn.
Performance Metric B refers to Winning Streak
Rate and Losing Streak Rate. Winning Streak Rate is
the proportion of consecutive wins within a day,
while Losing Streak Rate is the proportion of
consecutive losses. These metrics are used to analyze
the impact of winning or losing streaks on player
churn.
Based on Figure 7, the following findings and
conclusions can be drawn:
Matchmaking Algorithms A and B primarily
influence the reduction of player churn rates. The
churn rate reduction for Matchmaking Algorithm A is
0.05, while for Matchmaking Algorithm B, it is 0.07.
Performance Metrics A and B primarily influence the
increase in player engagement. The increase in player
engagement for Performance Metric A is 0.10, and
for Performance Metric B, it is 0.12.
Matchmaking Algorithm B is more effective in
reducing player churn compared to Matchmaking
Algorithm A, indicating that a better matchmaking
algorithm can significantly decrease player churn.
Performance Metric B shows the best performance in
increasing player engagement, followed by
Performance Metric A. This suggests that optimizing
game performance and providing a better player
experience can significantly enhance player
engagement.
3.5.3 Summary
In conclusion, game developers should prioritize
improving matchmaking algorithms, particularly
efficient ones like Matchmaking Algorithm B, to
reduce churn rates. Additionally, attention should be
given to optimizing performance metrics, especially
Performance Metric B, to increase player engagement
and satisfaction.
Overall, by improving matchmaking algorithms
and optimizing performance metrics, game
companies can effectively reduce player churn rates
and increase player engagement, thereby enhancing
the overall performance of the game and user
retention.
3.6 Binary Classification Model
3.6.1 Literature Review
Md. Yousuf Hossain et al. compared data on player
history, class, and guild over time in World of
Warcraft (WoW) and estimated the probability of
renewal (Hossain et al., 2023). This study used LR,
DT, linear discriminant analysis (LDA), quadratic
discriminant analysis (QDA), RF, and NB algorithms
as binary classifiers, and trained and tested the models
using a 10-fold cross validation method to compare
their performance. The research results indicate that
the RF and DT algorithms provide the highest
accuracy (over 90%) in all cases. This is
accomplished by utilizing levels and guilds as
parameters, as well as extracting active days and total
game time from various time periods of the previous
month.
3.6.2 Model Performances
The following outlines the performance of various
machine learning algorithms across different
evaluation metrics.
By observing Table 3-5, it was found that RF and
DT performed the best in subscription renewal
prediction tasks, especially when using data over a
longer time range (such as 1-30 days or including 16-
30 days), with an accuracy rate of over 96%. Despite
the longer training
and scoring time of RF, its predictive performance is
significantly better than other models, especially in
key performance metrics such as accuracy, recall, F1
score, and AUC-ROC. DT achieve a good balance
between performance and computational efficiency,
making them suitable for resource limited
environments. In contrast, LDA and LR perform
moderately well, while NB and QDA perform poorly,
especially when dealing with complex subscription
renewal prediction tasks.
Research on Machine Learning Models for Predicting Player Churn
119

Table 3: Subscription Renewal (1-30 Days). (Hossain et al., 2023).
Model Accuracy Precision Recall F1 score AUC ROC
RF 0.906488 0.838773 0.77583 0.901711 0.890999
DT 0.9018 0.821999 0.778555 0.898253 0.855967
LR 0.854728 0.865415 0.530796 0.797524 0.703723
LDA 0.857118 0.733282 0.596764 0.828296 0.699635
QDA 0.843145 0.683084 0.625792 0.828696 0.731092
NB 0.824722 0.653181 0.636632 0.819722 0.711776
Table 4: Subscription Renewal (16-30 Days). (Hossain et al., 2023).
Model Accuracy Precision Recall F1 score AUC ROC
RF 0.94192 0.893297 0.879788 0.941413 0.963323
DT 0.937915 0.879352 0.88301 0.938064 0.920068
LR 0.854933 0.852507 0.533484 0.798971 0.704236
LDA 0.856416 0.72849 0.599294 0.828767 0.699565
QDA 0.842045 0.681928 0.631716 0.829468 0.724304
NB 0.800357 0.631051 0.646273 0.805868 0.714753
Table 5: Subscription Renewal (1-15, 16-30, 1-30 Days). (Hossain et al., 2023).
Model Accuracy Precision Recall F1 score AUC ROC
RF 0.966464 0.916762 0.906857 0.954368 0.978386
DT 0.965346 0.912339 0.916879 0.955468 0.965803
LR 0.867574 0.826457 0.546759 0.807272 0.703612
LDA 0.886416 0.72849 0.599294 0.828767 0.69565
QDA 0.777983 0.618308 0.652812 0.792026 0.7045
NB 0.651834 0.589744 0.620902 0.632991 0.708269
3.6.3 Summary
Overall, RF and DT are the preferred models,
especially in scenarios that require high accuracy, as
they can provide strong support for developers, while
decision tree models can provide effective predictions
in situations where computing resources are limited.
4 DISCUSSION
The current research on player churn prediction faces
many challenges, including data acquisition and
processing, model complexity, adaptability and so on.
Further research can explore optimizing data
utilization, improving model accuracy, and
expanding application scope, providing more refined
and efficient solutions for the gaming industry.
In the future, the following improvements can be
considered:
Multisource Data Integration
Integrate data from various sources (such as social
media interactions, in-game purchase behavior, etc.)
into the predictive model to enhance its accuracy and
comprehensiveness.
Real-Time Prediction and Intervention
Develop real-time churn prediction systems
capable of instantly identifying high-risk players and
implementing personalized intervention strategies to
increase player retention.
MLSCM 2024 - International Conference on Modern Logistics and Supply Chain Management
120

Long-Term Behavior Analysis
Extend the research timeframe to analyze long-
term player behavior patterns and identify key factors
that influence long-term engagement and loyalty.
Application of Machine Learning and Deep
Learning
Investigate more sophisticated machine learning
and deep learning algorithms, including
reinforcement learning and graph neural networks, to
improve the performance and adaptability of
predictive models.
5 CONCLUSION
This paper highlights the significance of player churn
prediction in the gaming industry. Whether for
subscription-based games or free-to-play games,
accurately predicting when players are likely to churn
is crucial for developing effective retention strategies.
This not only helps game developers maintain player
engagement but also increases revenue and extends
the lifecycle of the game.
Through the analysis of multiple research papers,
the study demonstrates that using player behavior
data for prediction is highly effective. Various
algorithms, such as Random Forest, Decision Trees,
and Logistic Regression, are widely applied and show
high prediction accuracy. Among them, Random
Forest and Decision Tree models generally perform
the best, especially when handling complex player
behavior data. Additionally, the paper highlights that
different time frames have a significant impact on
prediction accuracy. Using data over a longer period
(e.g., 30 days) typically improves prediction accuracy,
indicating that long-term player behavior patterns are
more accurate indicators of future engagement than
short-term behaviors.
Furthermore, the paper underscores the crucial
role of incorporating personalized factors and social
interactions in predictive models. For instance,
factors such as a player's social network within the
game, guild membership, and the number of active
days can significantly influence the probability of
churn. This suggests that predictive models should
not only consider individual player behaviors but also
integrate social interactions to improve prediction
precision. Optimizing matchmaking algorithms and
game performance can effectively reduce player
churn and enhance engagement.
The paper also discusses how to make effective
predictions in scenarios with limited data. By
optimizing data preprocessing and selecting
appropriate features, accurate predictions can be
achieved even with limited data, which is particularly
important for emerging games or situations with
limited data collection. Future research should focus
on multisource data integration, real-time prediction
and intervention, long-term behavior analysis, and the
application of advanced machine learning and deep
learning algorithms to further enhance the
performance and adaptability of predictive models.
Through these optimizations, game developers can
more accurately predict player behavior, develop
more effective user retention strategies, and improve
game performance and user satisfaction.
REFERENCES
Wang, C., Rao, C., Hu, F., Xiao, X., & Goh, M., 2024. Risk
assessment of customer churn in telco using FCLCNN-
LSTM model. Expert Systems with Applications, 248,
123352. https://doi.org/10.1016/j.eswa.2024.123352
Ting, M. P., & Cho, D. M., 2024. What drives user churn in
serious games? An empirical examination of the TAM,
SOR theory, and game quality in Chinese cultural
heritage games. Entertainment Computing, 52, 100758.
https://doi.org/10.1016/j.entcom.2024.100758
Wang, J., 2018. Research on Online Game Player Churn
Prediction Based on COX Proportional Hazards Model
(Master's thesis, Jinan University).
Tu, M. H., 2020. Study on the Factors Influencing Mobile
Game User Churn (Master’s thesis, Shanghai
University of Finance and Economics). https://doi.org/
10.27296/d.cnki.gshcu.2020.002449
Zhang, W., 2021. Analysis on Online Game Player Churn
Prediction (Master’s thesis, Beijing University of
Technology). https://doi.org/10.26935/d.cnki.gbjgu.20
21.000617
Milošević, M., Živić, N., & Andjelković, I., 2017. Early
churn prediction with personalized targeting in mobile
social games. Expert Systems with Applications, 83,
326-332. https://doi.org/10.1016/j.eswa.2017.04.014
Bonometti, V., Ringer, C., Hall, M., Wade, A. R., &
Drachen, A., 2019. Modelling early user-game
interactions for joint estimation of survival time and
churn probability. In Proceedings of the IEEE
Conference on Games 2019. IEEE. https://doi.org/
10.1109/CoG.2019.8847993
Loria, E., & Marconi, A., 2021. Exploiting limited players’
behavioral data to predict churn in gamification.
Electronic Commerce Research and Applications, 47,
101057. https://doi.org/10.1016/j.elerap.2021.101057
Kang, H., Suh, C., & Kim, H. K., 2024. Match experiences
affect interest: Impacts of matchmaking and performance
on churn in a competitive game. Heliyon, 10(3), e24891.
https://doi.org/10.1016/j.heliyon.2024.e24891
Hossain, M. Y., Azizi, E., & Zaman, L., 2023. Predicting
subscription renewal using binary classification in
World of Warcraft. Entertainment Computing, 44,
100522. https://doi.org/10.1016/j.entcom.2023.100522
Research on Machine Learning Models for Predicting Player Churn
121
