
Analysis of Feature Importance Based on Random Forest for Stock
Selection
Yiru Wang
School of Economics, London School of Economics and Political Science, Houghton Street, London, U.K.
Keywords: Technical Indicators, Semiconductor, Public Utility, Information Gain.
Abstract: As a matter of fact, feature importances are quite crucial for stock selection. This study investigates the
application of feature importance analysis using a random forest model for stock price prediction, focusing
on the semiconductor and public utility sectors. Given the inherent volatility and complexity of stock markets,
traditional linear models often fall short in capturing non-linear relationships and interactions among variables.
This research leverages machine learning techniques, particularly random forests, to identify key technical
indicators that significantly influence stock performance. By analysing data from Yahoo Finance, the study
incorporates a diverse set of factors, including momentum and volatility indicators, to assess their predictive
power. The findings reveal that volatile sectors like semiconductors benefit from indicators such as short-term
trends and volatility, while stable sectors like public utilities are more influenced by sector-specific conditions.
These results provide a comprehensive framework for factor selection in stock analysis, highlighting the
importance of a tailored approach based on sector characteristics. Future research should expand this analysis
to include macroeconomic conditions and sentiment indicators, offering a more holistic view of the factors
driving stock prices and enhancing investment strategies.
1 INTRODUCTION
Stock price prediction is crucial for investors and
financial institutions to facilitate informed decision-
making and optimize portfolio management
techniques. By accurately predicting future trends,
investors are able to make informed financial
decisions and optimize their returns. The inherent
volatility and complexity of stock values present
considerable obstacles to attaining accurate
predictions. This is particularly crucial in short-term
forecasting, because even little inaccuracies can lead
to significant economic losses (Rapach & Zhou,
2021). Conventional statistical models frequently fail
to accurately represent stock price movements
because of their significant nonlinearity and non-
stationarity (Feng et al., 2020). Furthermore, the
performance of models can be adversely affected by
the substantial disturbance present in stock price data
(Nti et al., 2019). Unlike conventional linear pricing
models, such as the Capital Asset Pricing Model
(CAPM) and the Fama-French factor model, the
incorporation of machine learning in this domain
mitigates the curse of dimensionality and provides
novel insights into the determinants affecting the
market. Machine learning techniques, such as
decision trees and neural networks, are successful
because they can capture nonlinear relationships and
interactions among factors that conventional models
frequently fail to capture (Gu et al., 2020).
In the context of stock selection, various efforts
have been made to apply machine learning techniques
for maximizing portfolio returns. One notable
approach involves automated stock selection using
random forests, which assess future returns based on
outperformance probabilities (Breitung, 2023).
Additionally, Yang et al. compared different machine
learning methods using mean squared error to
evaluate the top 20% of stocks for portfolio formation
(Yang et al., 2018). However, these models typically
require the pre-selection of factor groups before the
price prediction process, which can introduce
additional complexity. In addition to the challenges
of identifying contextual and nonlinear interactions,
selecting meaningful factors is crucial for effective
decision-making in stock selection. A factor refers to
a quality or attribute believed to influence a stock's
performance and potential return (Leippold et al.,
2022). Investors often rely on various groups of
factors, each serving different functions in the stock
374
Wang, Y.
Analysis of Feature Importance Based on Random Forest for Stock Selection.
DOI: 10.5220/0013233500004568
In Proceedings of the 1st International Conference on E-commerce and Artificial Intelligence (ECAI 2024), pages 374-379
ISBN: 978-989-758-726-9
Copyright © 2025 by Paper published under CC license (CC BY-NC-ND 4.0)

selection process. Key factors include firm
fundamentals, equity factors, and technical indicators,
all of which should be considered when evaluating
stock performance (Wolff & Echterling, 2023).
However, it remains uncertain which of these factors
will exert the most significant quantitative impact on
stock evaluation (Rasekhschaffe & Jones, 2019).
The purpose of this study is to utilize the random
forest model to assess the impact of various technical
factors on stock price predictions and to evaluate their
performance based on feature importance. The
research aims to provide insights into stock selection
and explain variations between sectors. The
remainder of the paper is organized as follows.
Section 2 describes the data and the data cleaning
methods, as well as the model selection process and
evaluation criteria. Section 3 presents the results of
the analysis, discusses their implications, and
addresses the limitations of the findings along with
future prospects for factor analysis. Finally, Section 4
summarizes the paper.
2 DATA AND METHOD
In this paper, data was collected from Yahoo Finance,
focusing on the semiconductor and public utility
sectors. The dataset includes key variables such as
open, close, high, and low prices, as well as trading
volume for the selected stocks. To ensure the integrity
of the dataset, any missing values were either
replaced with average values or removed, thereby
maintaining clean and reliable input features.
Technical features were calculated using the
stockstats package in Python. To enrich the feature set
for the random forest model, this research
incorporated a subset of Alpha 101 factors. These
factors, which encompass various signals based on
price movements, trading volume, and volatility,
were derived from historical stock price data
(Kakushadze, 2016). The features generated from
these Alpha factors were combined with traditional
technical indicators in the model.
The semiconductor and public utility sectors were
chosen for this study due to their distinct
characteristics and roles in the U.S. economy. The
semiconductor sector is known for its rapid
innovation and significant impact on technology-
driven industries, making it a critical area for
investors seeking high growth potential. The sector
experiences considerable volatility, influenced by
factors such as technological advancements, market
demand, and global supply chain dynamics. In
contrast, the public utility sector is characterized by
its stability and consistent demand, driven by
essential services such as electricity, water, and
natural gas. This sector typically offers lower
volatility and more predictable returns, appealing to
risk-averse investors. By analyzing both sectors, this
research aims to provide a comprehensive
understanding of how technical indicators perform
across different market environments, thereby
offering valuable insights for diverse investment
strategies.
The choice of the random forest model for feature
importance analysis in stock selection is driven by its
robust capability to handle high-dimensional data and
its inherent mechanism for evaluating feature
importance. Unlike many traditional models, random
forests operate as an ensemble of decision trees,
which allows them to capture complex nonlinear
relationships among variables without extensive
preprocessing. One of the key advantages of this
model is its ability to rank features based on their
contribution to the predictive accuracy of the
ensemble. This is achieved through metrics such as
mean decrease in impurity and permutation
importance, providing clear insights into which
technical indicators significantly influence stock
selection. Furthermore, random forests are less prone
to overfitting compared to single decision trees,
making them a reliable choice for financial data,
which often exhibit noise and volatility. This
combination of robustness, interpretability, and
effective feature ranking makes random forests
particularly suitable for this analysis.
The model was trained on the preprocessed
dataset, which was divided into training and testing
subsets to ensure robust evaluation. During the
training process, the model was fitted to the selected
technical indicators, identified as features through
their Information Gain values. Various
hyperparameters, including maximum tree depth and
minimum samples per split, were systematically
adjusted to optimize the model's performance. After
each adjustment, the accuracy score was assessed to
evaluate the impact of the changes, guiding further
modifications. Upon completing the training, the
model automatically calculated the importance of
each feature based on its effectiveness in reducing
model impurity. This resulted in a straightforward
matrix that highlighted which technical indicators
were most influential in the stock selection process
and which had minimal contribution, thereby
providing valuable insights for further analysis.
Analysis of Feature Importance Based on Random Forest for Stock Selection
375
3 RESULTS AND DISCUSSION
3.1 Factors Selection
In this analysis, several technical indicators were
selected from the StockStats package in Python to
enhance the stock selection process, focusing on
various market functions such as momentum, trend,
and volatility. The Average True Range (ATR) was
chosen to assess volatility, calculating the average
range between high and low prices over a specified
period, thereby providing insights into market
fluctuations. The Average Directional Index (ADX)
was included to measure trend strength, indicating
whether a market is trending and the intensity of that
trend. Additionally, the Money Flow Index (MFI)
was utilized as a momentum indicator, incorporating
both price and volume to assess overbought or
oversold conditions. Other indicators, such as
Bollinger Bands, gauged price volatility relative to its
moving average, while the Exponential Moving
Average (EMA) provided a responsive measure of
price trends. Together, these indicators offer a
comprehensive view of market behavior, aiding in the
identification of profitable trading opportunities.
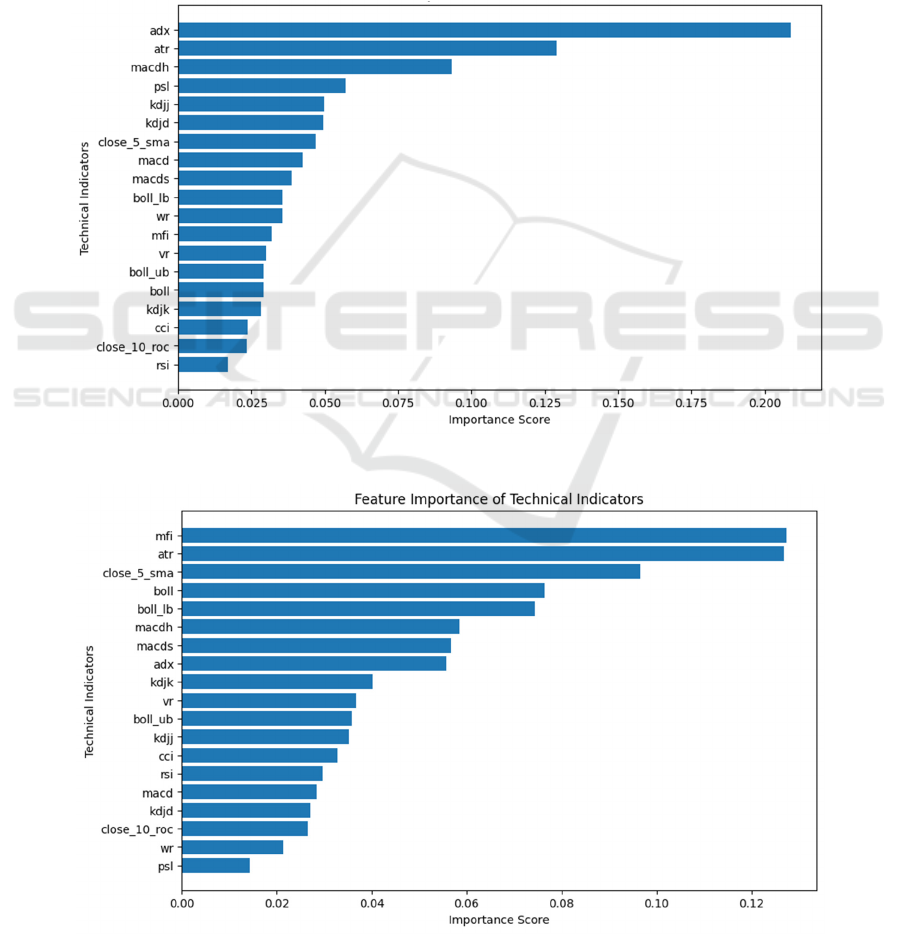
Figure 1:
Ranking
of feature importance for semiconductor (Photo/Picture credit: Original).
Figure 2: Ranking of feature importance for public utility (Photo/Picture credit: Original).
ECAI 2024 - International Conference on E-commerce and Artificial Intelligence
376
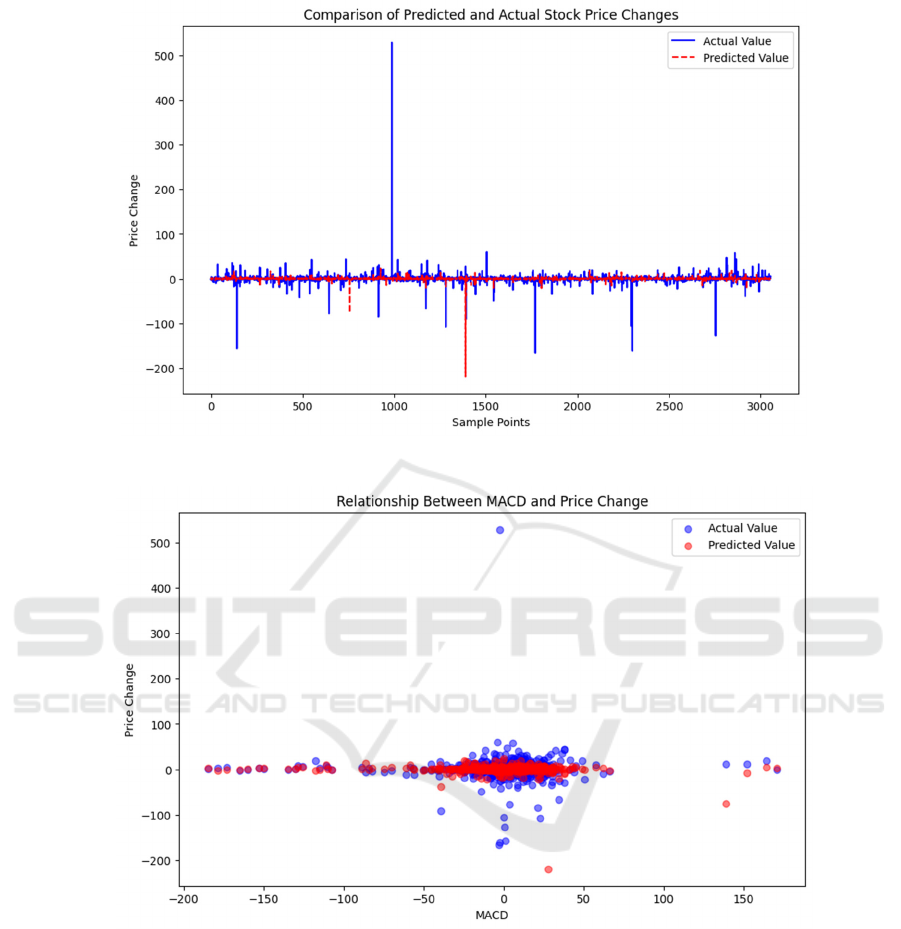
Figure 3: Comparison for prediction values for semiconductor (Photo/Picture credit: Original).
Figure 4: Relationship between MACD and
price
change for semiconductor (Photo/Picture credit: Original).
3.2 Feature Importance, Explanation
and Implications
The factors are ranked based on information gain as
the valuation method for feature importance. The
results are listed in Fig. 1 and Fig. 2. The adx and mfi
show great importances for semiconductor and public
utility, respectively. In the semiconductor sector,
ADX is used to assess whether the sector is in a strong
upward or downward trend. For example, if ADX is
above 20 and rising, it indicates a strong trend,
suggesting that semiconductor stocks are
experiencing significant movement, potentially due
to market events like earnings reports or
technological advancements. ATR provides insights
into how much semiconductor stocks are likely to
move in a given timeframe. In times of high volatility
(high ATR), traders might anticipate larger price
movements, which can be critical for decision-
making. When ADX indicates a strong trend (above
20) and ATR is also high, this combination can
suggest that the semiconductor sector is not only
trending but also experiencing significant price
Analysis of Feature Importance Based on Random Forest for Stock Selection
377
movement. This might indicate heightened investor
interest or reactions to news affecting the sector. In
such scenarios, unexpected company policies or
technological breakthroughs can further amplify
these dynamics, presenting favorable investment
opportunities (seen from Fig. 3 and Fig. 4).
In the public utility sector, MFI can help
determine when stocks are overbought or oversold.
For instance, if MFI exceeds 80, it might signal that
utility stocks are overbought due to factors such as
regulatory changes or interest rate fluctuations,
prompting a potential price correction. Conversely, if
MFI falls below 20, it may indicate that stocks are
oversold, potentially signaling a buying opportunity,
especially if the sector is experiencing stable demand.
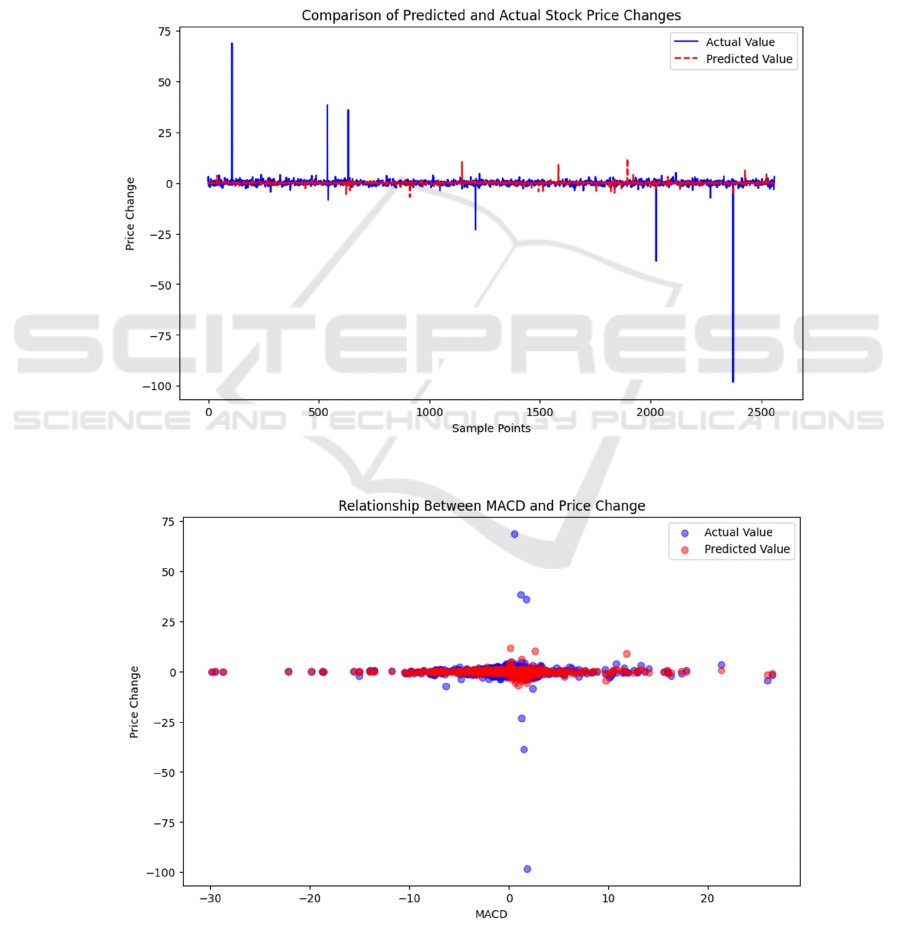
If MFI shows oversold conditions while ATR is low,
it may indicate a stable environment where utility
stocks could rebound, suggesting a potential buying
opportunity for investors looking for safer, long-term
investments. Combined with decreasing interest rates
and steady growth prospects in the public utility
sector, this scenario can attract increased investor
interest, further enhancing the appeal of these stocks
(seen from Fig. 5 and Fig. 6).
Figure 5: Comparison for prediction values for public utility (Photo/Picture credit: Original).
Figure 6: Relationship between MACD and price change for public utility (Photo/Picture credit: Original).
ECAI 2024 - International Conference on E-commerce and Artificial Intelligence
378

3.3 Limitations and Prospects
The selection of technical indicators in this study is
primarily driven by the availability of data sourced
from Yahoo Finance; however, this reliance may
limit the comprehensiveness of the analysis. As a
result, the chosen indicators might not fully capture
all essential market dynamics, potentially
overlooking critical signs that could inform
investment decisions. While the focus on technical
indicators offers quantifiable and straightforward
metrics for model integration, it inherently narrows
the scope of the analysis. Other influential factors,
such as macroeconomic conditions—like interest
rates, inflation, and GDP growth—and investor
sentiment, which can be gleaned from social media
and news sources, are significant drivers of stock
market behavior. To enhance the model's predictive
accuracy and factor identification capabilities, it is
imperative to explore and incorporate these additional
parameters. For instance, integrating macroeconomic
indicators could provide a more holistic view of the
market context, allowing for better understanding of
how external economic factors impact stock
performance. Furthermore, incorporating sentiment
analysis could help capture the emotional and
psychological dimensions of investor behavior,
which often play a crucial role in market movements.
By expanding the range of indicators and factors
considered, future studies can develop a more robust
framework for stock prediction, ultimately leading to
improved investment strategies. This comprehensive
approach would not only enrich the analytical model
but also align it more closely with the multifaceted
nature of financial markets, increasing its
applicability and relevance to real-world trading
scenarios.
4 CONCLUSIONS
In summary, feature importance analysis provides
essential statistical support for factor selection in
stock selection. The results demonstrate that sectors
with distinct characteristics should assess tailored
groups of technical factors for achieving more
accurate price predictions. In volatile sectors, such as
semiconductors, short-term trends and volatility
emerge as critical indicators for effective decision-
making. Conversely, in more stable sectors like
public utilities, emphasis should be placed on broader
sector conditions to capture essential dynamics. As
the field evolves, the identification of more
meaningful and relevant factors that influence the
stock selection process is vital. A comprehensive
analysis that incorporates a wider array of related
factors can achieve deeper insights into stock
performance and selection strategies. This paper
presents a robust framework for determining which
factors to integrate into models for stock price
prediction and selection. Future research should focus
on quantifying additional factors, including
macroeconomic conditions, industry-specific trends,
and fundamental indicators, to further enhance this
feature importance analysis. On this basis, investors
can develop a more comprehensive understanding of
the factors driving stock prices, ultimately leading to
more informed and strategic investment decisions.
REFERENCES
Breitung, C., 2023. Automated stock picking using random
forests. Journal of Empirical Finance, 72, 532–556.
Feng, G., Giglio, S., Xiu, D., 2020. Taming the Factor Zoo:
A Test of New Factors. The Journal of Finance, 75(3),
1327–1370.
Gu, S., Kelly, B., Xiu, D., 2020. Empirical Asset Pricing
via Machine Learning. Review of Financial Studies,
33(5), 2223–2273.
Kakushadze, Z., 2016. 101 Formulaic Alphas. Wilmott,
2016(84), 72–81.
Leippold, M., Wang, Q., Zhou, W., 2022. Machine learning
in the Chinese stock market. Journal of Financial
Economics, 145(2), 64–82.
Nti, I. K., Adekoya, A. F., Weyori, B. A., 2019. Random
Forest Based Feature Selection of Macroeconomic
Variables for Stock Market Prediction. American
Journal of Applied Sciences, 16(7), 200–212.
Rapach, D., Zhou, G., 2021. Asset Pricing: Time-Series
Predictability. SSRN Electronic Journal, 3941499
Rasekhschaffe, K. C., Jones, R. C., 2019. Machine
Learning for Stock Selection. Financial Analysts
Journal, 75(3), 70–88.
Wolff, D., Echterling, F., 2023. Stock picking with machine
learning. Journal of Forecasting, 43(1), 81–102.
Yang, H., Liu, X., Wu, Q., 2018. A Practical Machine
Learning Approach for Dynamic Stock
Recommendation. SSRN Electronic Journal, 3302088.
Analysis of Feature Importance Based on Random Forest for Stock Selection
379
